Consumer Internet of Things (IoT) Market Analysis North America, Europe, APAC, South America, Middle East and Africa - US, Canada, China, Germany, UK - Size and Forecast 2024-2028

Consumer Internet of Things (IoT) Market Analysis North America, Europe, APAC, South America, Middle East and Africa - US, Canada, China, Germany, UK - Size and Forecast 2024-2028

Published: Jan 2024 100 Pages SKU: IRTNTR77110

Market Overview at a Glance

$127.18 B
Market Opportunity
13.14%
CAGR
10.97
YoY growth 2023-2024(%)

Consumer IoT Market Size 2024-2028 

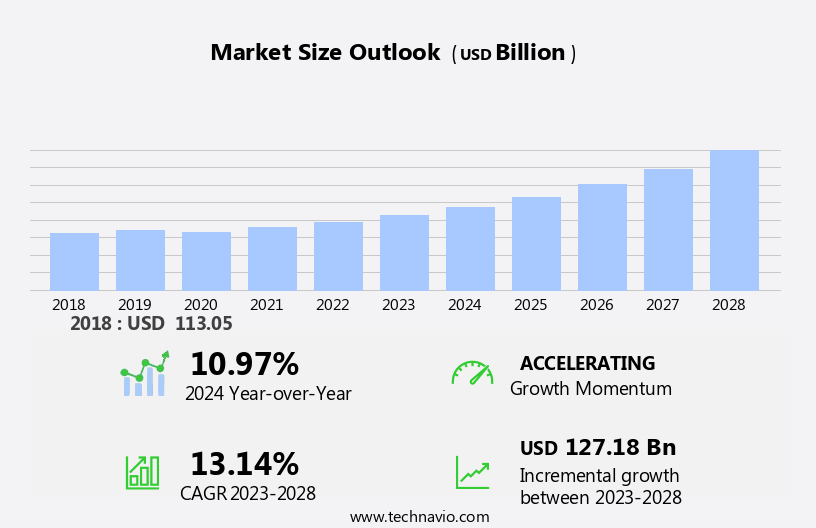
The consumer IoT market size is forecast to increase by USD 127.18 billion at a CAGR of 13.14% between 2023 and 2028.

  • The market is experiencing significant growth due to the increasing popularity of connectivity solutions for home automation and monitoring applications. Energy management is another key driver, as consumers seek to reduce energy usage and save costs. Wearable technology, particularly in the areas of health consciousness and chronic disease management, is also fueling market expansion.However, concerns over data security and privacy are major challenges, necessitating the development of advanced security solutions. Semiconductor companies are addressing these challenges through the production of chipsets designed for IoT applications. Geographic presence and strategic collaborations are also important factors, with companies expanding their offerings in home automation, autonomous driving, mobility, and IoT development kits. The market is further influenced by the integration of IoT technology into various sectors, including home entertainment, toys, and networking. As digitalization continues to transform industries, the market is poised for continued growth.

What will be the Consumer IoT Market Size During the Forecast Period?

Consumer IOT Market Size

 Request Free Sample

  • The Internet of Things (IoT) has emerged as a game-changer in various industries, and the consumer sector is no exception. The integration of technologically advanced devices into everyday life has become increasingly popular, with home appliances leading the charge. This trend is driven by the availability of microcontrollers and wireless technologies, enabling seamless connectivity between devices and computers. The market encompasses a wide range of smart devices, from fitness trackers and smart thermostats to connected doorbells and security systems. These interconnected systems offer numerous benefits, including convenience, improved lifestyle, and data management capabilities.
  • However, they also present unique challenges, such as cyberattacks and data breaches. Internet users in both developed and developing economies are embracing the IoT revolution, with a growing number of households adopting smart devices. Fitness enthusiasts, for instance, can monitor their health metrics and track workouts using wearable devices. Meanwhile, homeowners can optimize energy usage with smart thermostats and enhance security with connected doorbells. As the number of connected devices grows, so does the amount of consumer data being generated. Data management software and predictive analytics play a crucial role in ensuring the secure and efficient handling of this data.

How is this market segmented and which is the largest segment?

The market research report provides comprehensive data (region-wise segment analysis), with forecasts and estimates in "USD billion" for the period 2024-2028, as well as historical data from 2018-2022 for the following segments.
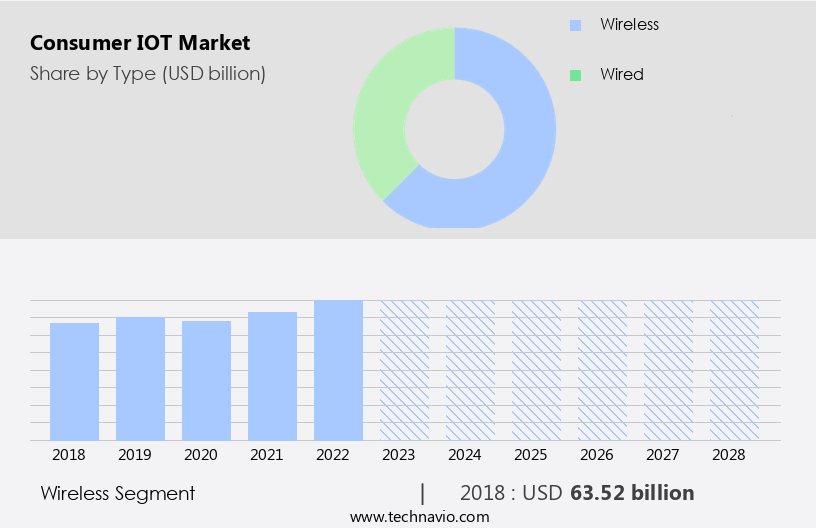
  • Type
    • Wireless
    • Wired
  • End-user
    • Home automation
    • Consumer electronics
    • Wearable devices
    • Healthcare
  • Geography
    • North America
      • Canada
      • US
    • Europe
      • Germany
      • UK
    • APAC
      • China
    • South America
    • Middle East and Africa

By Type Insights

  • The wireless segment is estimated to witness significant growth during the forecast period.

In the market, suppliers of technology and components for wearable devices and biosensors hold a moderate level of influence. While standard components like sensors, chips, and connectivity modules are sourced from various suppliers, those offering specialized or proprietary technology hold more power due to their unique offerings. These unique offerings may include advanced algorithms for analyzing heart rate, sleep patterns, blood sugar levels, and other vital variables. In the realm of patient care, remote monitoring, and observation, IoT devices such as smartwatches and wireless wearable biosensors play a significant role.

Furthermore, as healthcare professionals increasingly rely on these devices for treatment and observation, the demand for advanced and accurate sensors and software solutions is on the rise. CE marking and other regulatory requirements ensure the quality and safety of these devices. 

Consumer IOT Market Size

Get a glance at the market report of share of various segments Request Free Sample

The wireless segment was valued at USD 63.52 billion in 2018 and showed a gradual increase during the forecast period.

Regional Analysis

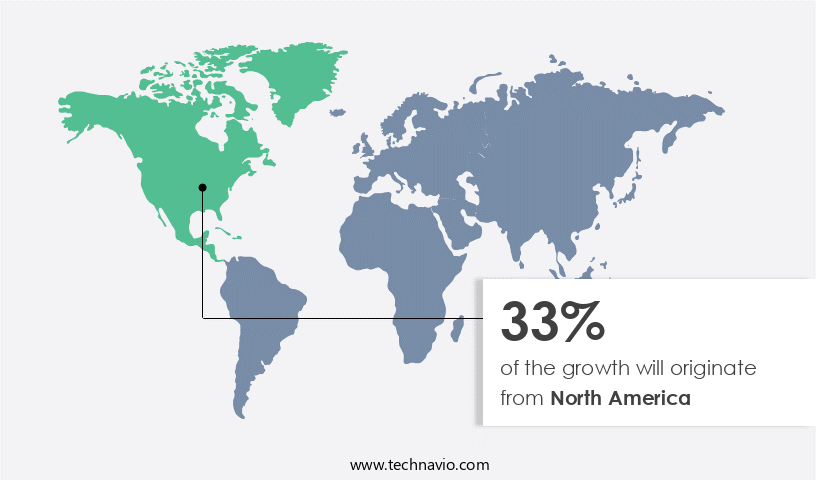
  • North America is estimated to contribute 33% to the growth of the global market during the forecast period.

Technavio's analysts have elaborately explained the regional trends and drivers that shape the market during the forecast period.

Consumer IOT Market Share by Geography

For more insights on the market share of various regions Request Free Sample

In North America, the Internet of Things (IoT) market has experienced substantial progress due to advancements in connectivity infrastructure. High-speed Internet, 5G network deployments, and enhanced cellular connectivity enable IoT devices to communicate effectively. The region's tech-savvy populace embraces new technologies, making them among the first adopters of IoT products. Regulatory initiatives, such as the California Consumer Privacy Act (CCPA) and ongoing discussions regarding IoT security standards, foster consumer trust by emphasizing data privacy and security. IoT devices, including smart lighting, connected washing machines, dishwashers, and healthcare gadgets like blood pressure monitors, fitness and heart rate monitors, pulse oximeters, and blood glucose meters, are increasingly popular.

Wearable tech, such as smartwatches and smart glasses, body-worn cameras, fitness trackers, and connected cars with in-car infotainment, traffic management, and smart thermostats, are also gaining traction. Manufacturers face challenges in complying with these regulations but prioritize user privacy and security to maintain consumer confidence. The Matter protocol, a new connectivity standard, simplifies the process of connecting and managing IoT devices. However, cyberattacks and data breaches pose threats to consumer data and IoT security. Implementing strong security measures and protocols is crucial to mitigate these risks and ensure a seamless user experience. 

Market Dynamics

Our researchers analyzed the data with 2023 as the base year, along with the key drivers, trends, and challenges. A holistic analysis of drivers will help companies refine their marketing strategies to gain a competitive advantage.

What are the key market drivers leading to the rise in adoption of Consumer IOT Market?

Strong demand for smart wearables is the key driver of the market.

  • The market encompasses the use of data coverage and forecasting techniques to analyze trends in the adoption of connected devices, such as smart wearables. These devices, including fitness trackers and smartwatches, offer advanced health monitoring features and convenience. Consumers in the US and North America are increasingly prioritizing their health and lifestyle, leading to a growing demand for these devices. Exponential smoothing and statistical analysis are employed to forecast future trends in this sector. Technological advancements, such as 5G, artificial intelligence, and machine learning, are transforming city infrastructure and the development of smart cities. Exchange rates and data management software are essential for businesses operating in this market.
  • Trade associations and technology platforms play a significant role in shaping industry standards and driving innovation. The level of digitization in the US and North America is high, with a significant number of internet users relying on interconnected devices for convenience and efficiency. Wearables, in particular, offer the benefit of quick access to notifications, calls, messages, and other smartphone functionalities, making them an attractive option for consumers. Predictive analytics and business operations are further enhanced by the integration of these devices with other IoT devices. Continuous technological advancements have led to improvements in battery life, sensor accuracy, sleeker designs, and better integration with smartphones and other devices.

What are the market trends shaping the Consumer IoT Market?

Rising smart home integration is the upcoming trend in the market.

  • In today's digital age, the demand for Internet of Things (IoT) devices in the consumer market, particularly for home automation, is on the rise. IoT devices, such as smart thermostats, security cameras, speakers, and appliances, are increasingly popular due to their ability to offer control, automation, and convenience.
  • These devices provide numerous benefits, including energy efficiency, enhanced home security, and the ability to manage various tasks remotely. With the integration of voice assistants like Salesforce Quip, consumers can easily control their smart home devices using simple voice commands. As consumers continue to seek out ways to make their homes more connected and efficient, the adoption of IoT technology is likely to increase.

What challenges does the Consumer IoT Market face during the growth?

Data privacy issues associated with IoT is a key challenge affecting the market growth.

  • In the rapidly expanding market, connectivity and security solutions are paramount. With an increasing number of home automation and monitoring applications, energy management systems, wearable devices, and medical devices becoming part of our daily lives, the importance of securing these devices cannot be overstated. Sensitive user data, including health consciousness information for chronic disease patients and personal preferences, is at risk of being compromised. Unfortunately, many IoT devices lack adequate security measures, leaving them vulnerable to hacking or unauthorized access. The lack of standardized security protocols across various IoT devices poses a significant challenge. Devices from different manufacturers may offer varying levels of security.
  • Compromised IoT devices can be harnessed to form botnets, which can then be used to launch large-scale cyberattacks, disrupting services or networks. Semiconductor companies like Texas Instruments and strategic collaborations between industry leaders are addressing these concerns by developing advanced chipsets and IoT development kits. These initiatives aim to improve security, ensuring a consistent level of protection across devices. Moreover, IoT devices are not limited to home automation applications or medical devices. They are also being integrated into toys, networking, home entertainment, wearable technology, mobility, and autonomous driving. Ensuring the security of these diverse applications is crucial to maintaining user trust and privacy.

Exclusive Customer Landscape

The market forecasting report includes the adoption lifecycle of the market, covering from the innovator's stage to the laggard's stage. It focuses on adoption rates in different regions based on penetration. Furthermore, the market report also includes key purchase criteria and drivers of price sensitivity to help companies evaluate and develop their market growth analysis strategies.
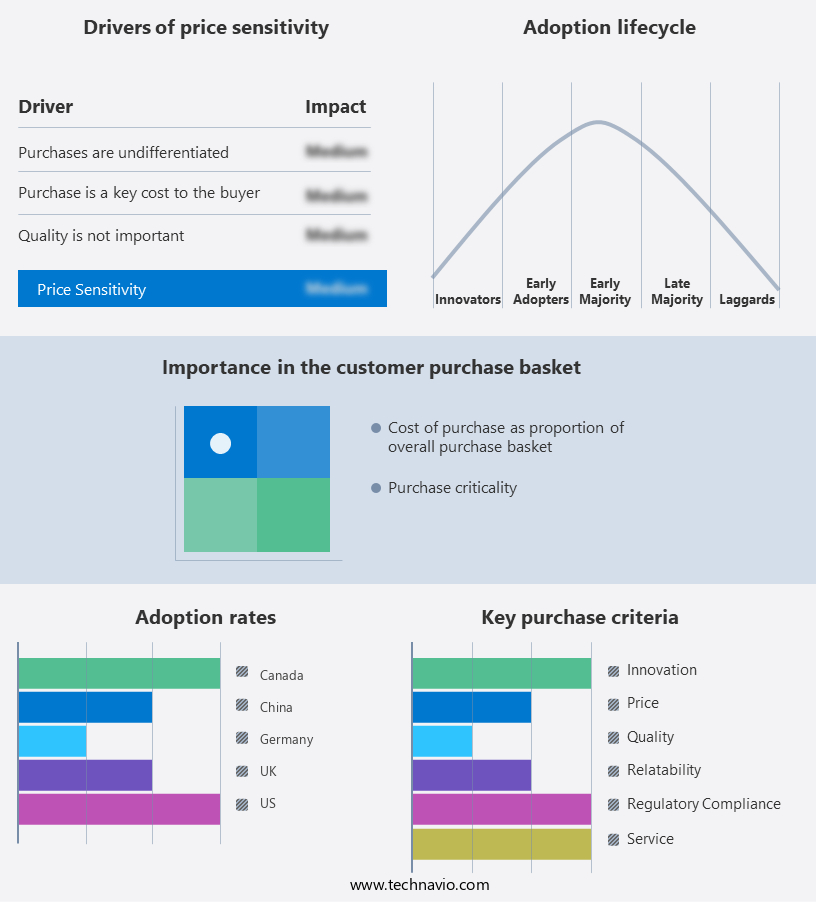
Consumer IOT Market Share by Geography

 Customer Landscape

Key Companies & Market Insights

Companies are implementing various strategies, such as strategic alliances, market forecast, partnerships, mergers and acquisitions, geographical expansion, and product/service launches, to enhance their presence in the market. The market research and growth report includes detailed analyses of the competitive landscape of the market and information about key companies, including:

  • Amazon.com Inc.
  • Apple Inc.
  • AT and T Inc.
  • Broadcom Inc.
  • Cisco Systems Inc.
  • Hewlett Packard Enterprise Co.
  • Honeywell International Inc.
  • Intel Corp.
  • International Business Machines Corp.
  • LG Corp.
  • Microsoft Corp.
  • NXP Semiconductors NV
  • Qorvo Inc.
  • Qualcomm Inc.
  • Samsung Electronics Co. Ltd.
  • Schneider Electric SE
  • Sony Group Corp.
  • STMicroelectronics International N.V.
  • TE Connectivity Ltd.
  • Texas Instruments Inc.

Qualitative and quantitative analysis of companies has been conducted to help clients understand the wider business environment as well as the strengths and weaknesses of key market players. Data is qualitatively analyzed to categorize companies as pure play, category-focused, industry-focused, and diversified; it is quantitatively analyzed to categorize companies as dominant, leading, strong, tentative, and weak.

Research Analyst Overview

The market is witnessing significant growth due to the increasing demand for technologically advanced devices that connect digital objects with physical objects. Home appliances, microcontrollers, and wireless technologies are at the heart of this interconnected system, transforming various sectors such as healthcare, sports, and home automation. Users are increasingly relying on smartphones and smart wearables like smartwatches and fitness trackers to monitor health parameters, improve fitness, and manage their homes. The Consumer IoT applications span across personal healthcare, where patients and doctors can remotely monitor variables like heart rate, sleep, blood sugar, and blood pressure. In the sports sector, athletes use wearable devices to optimize performance and training.

The hardware, services, and software components of the Consumer IoT ecosystem include processors, temperature and pressure sensors, accelerometers, inertial measurement units, humidity and light sensors, camera modules, memory devices, logic devices, data management software, and predictive analytics. The market is witnessing technological developments in areas like connectivity technology, wireless wearable biosensors, and cybersecurity measures. Consumer electronics, smart home devices, and smart city projects are major contributors to the market's growth. However, concerns around data security and privacy are key challenges that need to be addressed. The market report covers historical data, forecasts, regional opportunities, and service providers offering consulting services, implementation services, support & maintenance, and managed services. The market is expected to grow exponentially due to increasing internet penetration, disposable incomes, and the convenience and lifestyle benefits offered by connected devices.

Market Scope

Report Coverage

Details

Page number

100

Base year

2023

Historic period

2018-2022

Forecast period

2024-2028

Growth momentum & CAGR

Accelerate at a CAGR of 13.14%

Market Growth 2024-2028

USD 127.18 billion

Market structure

Fragmented

YoY growth 2023-2024(%)

10.97

Key countries

US, Canada, China, Germany, and UK

Competitive landscape

Leading Companies, Market Positioning of Companies, Competitive Strategies, and Industry Risks

Request Free Sample

What are the Key Data Covered in this Market Research and Growth Report?

  • CAGR of the market during the forecast period
  • Detailed information on factors that will drive the market growth and forecasting between 2024 and 2028
  • Precise estimation of the size of the market  and its contribution of the market in focus to the parent market
  • Accurate predictions about upcoming market growth and trends and changes in consumer behaviour
  • Growth of the market across North America, Europe, APAC, South America, and Middle East and Africa
  • Thorough analysis of the market's competitive landscape and detailed information about companies
  • Comprehensive analysis of factors that will challenge the growth of market companies

We can help! Our analysts can customize this market research report to meet your requirements. Get in touch

1 Executive Summary

  • 1.1 Market overview
    • Exhibit 01: Executive Summary – Chart on Market Overview
    • Exhibit 02: Executive Summary – Data Table on Market Overview
    • Exhibit 03: Executive Summary – Chart on Global Market Characteristics
    • Exhibit 04: Executive Summary – Chart on Market by Geography
    • Exhibit 05: Executive Summary – Chart on Market Segmentation by Type
    • Exhibit 06: Executive Summary – Chart on Market Segmentation by End-user
    • Exhibit 07: Executive Summary – Chart on Incremental Growth
    • Exhibit 08: Executive Summary – Data Table on Incremental Growth
    • Exhibit 09: Executive Summary – Chart on Vendor Market Positioning

2 Market Landscape

  • 2.1 Market ecosystem
    • Exhibit 10: Parent market
    • Exhibit 11: Market Characteristics

3 Market Sizing

  • 3.1 Market definition
    • Exhibit 12: Offerings of vendors included in the market definition
  • 3.2 Market segment analysis
    • Exhibit 13: Market segments
  • 3.3 Market size 2023
    • 3.4 Market outlook: Forecast for 2023-2028
      • Exhibit 14: Chart on Global - Market size and forecast 2023-2028 ($ billion)
      • Exhibit 15: Data Table on Global - Market size and forecast 2023-2028 ($ billion)
      • Exhibit 16: Chart on Global Market: Year-over-year growth 2023-2028 (%)
      • Exhibit 17: Data Table on Global Market: Year-over-year growth 2023-2028 (%)

    4 Historic Market Size

    • 4.1 Global Consumer IOT Market 2024-2028 2018 - 2022
      • Exhibit 18: Historic Market Size – Data Table on global consumer iot market 2024-2028 2018 - 2022 ($ billion)
    • 4.2 Type Segment Analysis 2018 - 2022
      • Exhibit 19: Historic Market Size – Type Segment 2018 - 2022 ($ billion)
    • 4.3 End-user Segment Analysis 2018 - 2022
      • Exhibit 20: Historic Market Size – End-user Segment 2018 - 2022 ($ billion)
    • 4.4 Geography Segment Analysis 2018 - 2022
      • Exhibit 21: Historic Market Size – Geography Segment 2018 - 2022 ($ billion)
    • 4.5 Country Segment Analysis 2018 - 2022
      • Exhibit 22: Historic Market Size – Country Segment 2018 - 2022 ($ billion)

    5 Five Forces Analysis

    • 5.1 Five forces summary
      • Exhibit 23: Five forces analysis - Comparison between 2023 and 2028
    • 5.2 Bargaining power of buyers
      • Exhibit 24: Chart on Bargaining power of buyers – Impact of key factors 2023 and 2028
    • 5.3 Bargaining power of suppliers
      • Exhibit 25: Bargaining power of suppliers – Impact of key factors in 2023 and 2028
    • 5.4 Threat of new entrants
      • Exhibit 26: Threat of new entrants – Impact of key factors in 2023 and 2028
    • 5.5 Threat of substitutes
      • Exhibit 27: Threat of substitutes – Impact of key factors in 2023 and 2028
    • 5.6 Threat of rivalry
      • Exhibit 28: Threat of rivalry – Impact of key factors in 2023 and 2028
    • 5.7 Market condition
      • Exhibit 29: Chart on Market condition - Five forces 2023 and 2028

    6 Market Segmentation by Type

    • 6.1 Market segments
      • Exhibit 30: Chart on Type - Market share 2023-2028 (%)
      • Exhibit 31: Data Table on Type - Market share 2023-2028 (%)
    • 6.2 Comparison by Type
      • Exhibit 32: Chart on Comparison by Type
      • Exhibit 33: Data Table on Comparison by Type
    • 6.3 Wireless - Market size and forecast 2023-2028
      • Exhibit 34: Chart on Wireless - Market size and forecast 2023-2028 ($ billion)
      • Exhibit 35: Data Table on Wireless - Market size and forecast 2023-2028 ($ billion)
      • Exhibit 36: Chart on Wireless - Year-over-year growth 2023-2028 (%)
      • Exhibit 37: Data Table on Wireless - Year-over-year growth 2023-2028 (%)
    • 6.4 Wired - Market size and forecast 2023-2028
      • Exhibit 38: Chart on Wired - Market size and forecast 2023-2028 ($ billion)
      • Exhibit 39: Data Table on Wired - Market size and forecast 2023-2028 ($ billion)
      • Exhibit 40: Chart on Wired - Year-over-year growth 2023-2028 (%)
      • Exhibit 41: Data Table on Wired - Year-over-year growth 2023-2028 (%)
    • 6.5 Market opportunity by Type
      • Exhibit 42: Market opportunity by Type ($ billion)
      • Exhibit 43: Data Table on Market opportunity by Type ($ billion)

    7 Market Segmentation by End-user

    • 7.1 Market segments
      • Exhibit 44: Chart on End-user - Market share 2023-2028 (%)
      • Exhibit 45: Data Table on End-user - Market share 2023-2028 (%)
    • 7.2 Comparison by End-user
      • Exhibit 46: Chart on Comparison by End-user
      • Exhibit 47: Data Table on Comparison by End-user
    • 7.3 Home automation - Market size and forecast 2023-2028
      • Exhibit 48: Chart on Home automation - Market size and forecast 2023-2028 ($ billion)
      • Exhibit 49: Data Table on Home automation - Market size and forecast 2023-2028 ($ billion)
      • Exhibit 50: Chart on Home automation - Year-over-year growth 2023-2028 (%)
      • Exhibit 51: Data Table on Home automation - Year-over-year growth 2023-2028 (%)
    • 7.4 Consumer electronics - Market size and forecast 2023-2028
      • Exhibit 52: Chart on Consumer electronics - Market size and forecast 2023-2028 ($ billion)
      • Exhibit 53: Data Table on Consumer electronics - Market size and forecast 2023-2028 ($ billion)
      • Exhibit 54: Chart on Consumer electronics - Year-over-year growth 2023-2028 (%)
      • Exhibit 55: Data Table on Consumer electronics - Year-over-year growth 2023-2028 (%)
    • 7.5 Wearable devices - Market size and forecast 2023-2028
      • Exhibit 56: Chart on Wearable devices - Market size and forecast 2023-2028 ($ billion)
      • Exhibit 57: Data Table on Wearable devices - Market size and forecast 2023-2028 ($ billion)
      • Exhibit 58: Chart on Wearable devices - Year-over-year growth 2023-2028 (%)
      • Exhibit 59: Data Table on Wearable devices - Year-over-year growth 2023-2028 (%)
    • 7.6 Healthcare - Market size and forecast 2023-2028
      • Exhibit 60: Chart on Healthcare - Market size and forecast 2023-2028 ($ billion)
      • Exhibit 61: Data Table on Healthcare - Market size and forecast 2023-2028 ($ billion)
      • Exhibit 62: Chart on Healthcare - Year-over-year growth 2023-2028 (%)
      • Exhibit 63: Data Table on Healthcare - Year-over-year growth 2023-2028 (%)
    • 7.7 Market opportunity by End-user
      • Exhibit 64: Market opportunity by End-user ($ billion)
      • Exhibit 65: Data Table on Market opportunity by End-user ($ billion)

    8 Customer Landscape

    • 8.1 Customer landscape overview
      • Exhibit 66: Analysis of price sensitivity, lifecycle, customer purchase basket, adoption rates, and purchase criteria

    9 Geographic Landscape

    • 9.1 Geographic segmentation
      • Exhibit 67: Chart on Market share by geography 2023-2028 (%)
      • Exhibit 68: Data Table on Market share by geography 2023-2028 (%)
    • 9.2 Geographic comparison
      • Exhibit 69: Chart on Geographic comparison
      • Exhibit 70: Data Table on Geographic comparison
    • 9.3 North America - Market size and forecast 2023-2028
      • Exhibit 71: Chart on North America - Market size and forecast 2023-2028 ($ billion)
      • Exhibit 72: Data Table on North America - Market size and forecast 2023-2028 ($ billion)
      • Exhibit 73: Chart on North America - Year-over-year growth 2023-2028 (%)
      • Exhibit 74: Data Table on North America - Year-over-year growth 2023-2028 (%)
    • 9.4 Europe - Market size and forecast 2023-2028
      • Exhibit 75: Chart on Europe - Market size and forecast 2023-2028 ($ billion)
      • Exhibit 76: Data Table on Europe - Market size and forecast 2023-2028 ($ billion)
      • Exhibit 77: Chart on Europe - Year-over-year growth 2023-2028 (%)
      • Exhibit 78: Data Table on Europe - Year-over-year growth 2023-2028 (%)
    • 9.5 APAC - Market size and forecast 2023-2028
      • Exhibit 79: Chart on APAC - Market size and forecast 2023-2028 ($ billion)
      • Exhibit 80: Data Table on APAC - Market size and forecast 2023-2028 ($ billion)
      • Exhibit 81: Chart on APAC - Year-over-year growth 2023-2028 (%)
      • Exhibit 82: Data Table on APAC - Year-over-year growth 2023-2028 (%)
    • 9.6 South America - Market size and forecast 2023-2028
      • Exhibit 83: Chart on South America - Market size and forecast 2023-2028 ($ billion)
      • Exhibit 84: Data Table on South America - Market size and forecast 2023-2028 ($ billion)
      • Exhibit 85: Chart on South America - Year-over-year growth 2023-2028 (%)
      • Exhibit 86: Data Table on South America - Year-over-year growth 2023-2028 (%)
    • 9.7 Middle East and Africa - Market size and forecast 2023-2028
      • Exhibit 87: Chart on Middle East and Africa - Market size and forecast 2023-2028 ($ billion)
      • Exhibit 88: Data Table on Middle East and Africa - Market size and forecast 2023-2028 ($ billion)
      • Exhibit 89: Chart on Middle East and Africa - Year-over-year growth 2023-2028 (%)
      • Exhibit 90: Data Table on Middle East and Africa - Year-over-year growth 2023-2028 (%)
    • 9.8 US - Market size and forecast 2023-2028
      • Exhibit 91: Chart on US - Market size and forecast 2023-2028 ($ billion)
      • Exhibit 92: Data Table on US - Market size and forecast 2023-2028 ($ billion)
      • Exhibit 93: Chart on US - Year-over-year growth 2023-2028 (%)
      • Exhibit 94: Data Table on US - Year-over-year growth 2023-2028 (%)
    • 9.9 China - Market size and forecast 2023-2028
      • Exhibit 95: Chart on China - Market size and forecast 2023-2028 ($ billion)
      • Exhibit 96: Data Table on China - Market size and forecast 2023-2028 ($ billion)
      • Exhibit 97: Chart on China - Year-over-year growth 2023-2028 (%)
      • Exhibit 98: Data Table on China - Year-over-year growth 2023-2028 (%)
    • 9.10 Germany - Market size and forecast 2023-2028
      • Exhibit 99: Chart on Germany - Market size and forecast 2023-2028 ($ billion)
      • Exhibit 100: Data Table on Germany - Market size and forecast 2023-2028 ($ billion)
      • Exhibit 101: Chart on Germany - Year-over-year growth 2023-2028 (%)
      • Exhibit 102: Data Table on Germany - Year-over-year growth 2023-2028 (%)
    • 9.11 UK - Market size and forecast 2023-2028
      • Exhibit 103: Chart on UK - Market size and forecast 2023-2028 ($ billion)
      • Exhibit 104: Data Table on UK - Market size and forecast 2023-2028 ($ billion)
      • Exhibit 105: Chart on UK - Year-over-year growth 2023-2028 (%)
      • Exhibit 106: Data Table on UK - Year-over-year growth 2023-2028 (%)
    • 9.12 Canada - Market size and forecast 2023-2028
      • Exhibit 107: Chart on Canada - Market size and forecast 2023-2028 ($ billion)
      • Exhibit 108: Data Table on Canada - Market size and forecast 2023-2028 ($ billion)
      • Exhibit 109: Chart on Canada - Year-over-year growth 2023-2028 (%)
      • Exhibit 110: Data Table on Canada - Year-over-year growth 2023-2028 (%)
    • 9.13 Market opportunity by geography
      • Exhibit 111: Market opportunity by geography ($ billion)
      • Exhibit 112: Data Tables on Market opportunity by geography ($ billion)

    10 Drivers, Challenges, and Trends

    • 10.1 Market drivers
      • 10.2 Market challenges
        • 10.3 Impact of drivers and challenges
          • Exhibit 113: Impact of drivers and challenges in 2023 and 2028
        • 10.4 Market trends

          11 Vendor Landscape

          • 11.1 Overview
            • 11.2 Vendor landscape
              • Exhibit 114: Overview on Criticality of inputs and Factors of differentiation
            • 11.3 Landscape disruption
              • Exhibit 115: Overview on factors of disruption
            • 11.4 Industry risks
              • Exhibit 116: Impact of key risks on business

            12 Vendor Analysis

            • 12.1 Vendors covered
              • Exhibit 117: Vendors covered
            • 12.2 Market positioning of vendors
              • Exhibit 118: Matrix on vendor position and classification
            • 12.3 Amazon.com Inc.
              • Exhibit 119: Amazon.com Inc. - Overview
              • Exhibit 120: Amazon.com Inc. - Business segments
              • Exhibit 121: Amazon.com Inc. - Key news
              • Exhibit 122: Amazon.com Inc. - Key offerings
              • Exhibit 123: Amazon.com Inc. - Segment focus
            • 12.4 Apple Inc.
              • Exhibit 124: Apple Inc. - Overview
              • Exhibit 125: Apple Inc. - Business segments
              • Exhibit 126: Apple Inc. - Key news
              • Exhibit 127: Apple Inc. - Key offerings
              • Exhibit 128: Apple Inc. - Segment focus
            • 12.5 AT and T Inc.
              • Exhibit 129: AT and T Inc. - Overview
              • Exhibit 130: AT and T Inc. - Business segments
              • Exhibit 131: AT and T Inc. - Key news
              • Exhibit 132: AT and T Inc. - Key offerings
              • Exhibit 133: AT and T Inc. - Segment focus
            • 12.6 Cisco Systems Inc.
              • Exhibit 134: Cisco Systems Inc. - Overview
              • Exhibit 135: Cisco Systems Inc. - Business segments
              • Exhibit 136: Cisco Systems Inc. - Key news
              • Exhibit 137: Cisco Systems Inc. - Key offerings
              • Exhibit 138: Cisco Systems Inc. - Segment focus
            • 12.7 Honeywell International Inc.
              • Exhibit 139: Honeywell International Inc. - Overview
              • Exhibit 140: Honeywell International Inc. - Business segments
              • Exhibit 141: Honeywell International Inc. - Key news
              • Exhibit 142: Honeywell International Inc. - Key offerings
              • Exhibit 143: Honeywell International Inc. - Segment focus
            • 12.8 Intel Corp.
              • Exhibit 144: Intel Corp. - Overview
              • Exhibit 145: Intel Corp. - Business segments
              • Exhibit 146: Intel Corp. - Key news
              • Exhibit 147: Intel Corp. - Key offerings
              • Exhibit 148: Intel Corp. - Segment focus
            • 12.9 International Business Machines Corp.
              • Exhibit 149: International Business Machines Corp. - Overview
              • Exhibit 150: International Business Machines Corp. - Business segments
              • Exhibit 151: International Business Machines Corp. - Key news
              • Exhibit 152: International Business Machines Corp. - Key offerings
              • Exhibit 153: International Business Machines Corp. - Segment focus
            • 12.10 LG Corp.
              • Exhibit 154: LG Corp. - Overview
              • Exhibit 155: LG Corp. - Business segments
              • Exhibit 156: LG Corp. - Key offerings
              • Exhibit 157: LG Corp. - Segment focus
            • 12.11 Microsoft Corp.
              • Exhibit 158: Microsoft Corp. - Overview
              • Exhibit 159: Microsoft Corp. - Business segments
              • Exhibit 160: Microsoft Corp. - Key news
              • Exhibit 161: Microsoft Corp. - Key offerings
              • Exhibit 162: Microsoft Corp. - Segment focus
            • 12.12 Samsung Electronics Co. Ltd.
              • Exhibit 163: Samsung Electronics Co. Ltd. - Overview
              • Exhibit 164: Samsung Electronics Co. Ltd. - Business segments
              • Exhibit 165: Samsung Electronics Co. Ltd. - Key news
              • Exhibit 166: Samsung Electronics Co. Ltd. - Key offerings
              • Exhibit 167: Samsung Electronics Co. Ltd. - Segment focus
            • 12.13 Schneider Electric SE
              • Exhibit 168: Schneider Electric SE - Overview
              • Exhibit 169: Schneider Electric SE - Business segments
              • Exhibit 170: Schneider Electric SE - Key news
              • Exhibit 171: Schneider Electric SE - Key offerings
              • Exhibit 172: Schneider Electric SE - Segment focus
            • 12.14 Sony Group Corp.
              • Exhibit 173: Sony Group Corp. - Overview
              • Exhibit 174: Sony Group Corp. - Business segments
              • Exhibit 175: Sony Group Corp. - Key news
              • Exhibit 176: Sony Group Corp. - Key offerings
              • Exhibit 177: Sony Group Corp. - Segment focus
            • 12.15 STMicroelectronics International N.V.
              • Exhibit 178: STMicroelectronics International N.V. - Overview
              • Exhibit 179: STMicroelectronics International N.V. - Business segments
              • Exhibit 180: STMicroelectronics International N.V. - Key news
              • Exhibit 181: STMicroelectronics International N.V. - Key offerings
              • Exhibit 182: STMicroelectronics International N.V. - Segment focus
            • 12.16 TE Connectivity Ltd.
              • Exhibit 183: TE Connectivity Ltd. - Overview
              • Exhibit 184: TE Connectivity Ltd. - Business segments
              • Exhibit 185: TE Connectivity Ltd. - Key offerings
              • Exhibit 186: TE Connectivity Ltd. - Segment focus
            • 12.17 Texas Instruments Inc.
              • Exhibit 187: Texas Instruments Inc. - Overview
              • Exhibit 188: Texas Instruments Inc. - Business segments
              • Exhibit 189: Texas Instruments Inc. - Key news
              • Exhibit 190: Texas Instruments Inc. - Key offerings
              • Exhibit 191: Texas Instruments Inc. - Segment focus

            13 Appendix

            • 13.1 Scope of the report
              • 13.2 Inclusions and exclusions checklist
                • Exhibit 192: Inclusions checklist
                • Exhibit 193: Exclusions checklist
              • 13.3 Currency conversion rates for US$
                • Exhibit 194: Currency conversion rates for US$
              • 13.4 Research methodology
                • Exhibit 195: Research methodology
                • Exhibit 196: Validation techniques employed for market sizing
                • Exhibit 197: Information sources
              • 13.5 List of abbreviations
                • Exhibit 198: List of abbreviations

              Research Methodology

              Technavio presents a detailed picture of the market by way of study, synthesis, and summation of data from multiple sources. The analysts have presented the various facets of the market with a particular focus on identifying the key industry influencers. The data thus presented is comprehensive, reliable, and the result of extensive research, both primary and secondary.

              INFORMATION SOURCES

              Primary sources

              • Manufacturers and suppliers
              • Channel partners
              • Industry experts
              • Strategic decision makers

              Secondary sources

              • Industry journals and periodicals
              • Government data
              • Financial reports of key industry players
              • Historical data
              • Press releases

              DATA ANALYSIS

              Data Synthesis

              • Collation of data
              • Estimation of key figures
              • Analysis of derived insights

              Data Validation

              • Triangulation with data models
              • Reference against proprietary databases
              • Corroboration with industry experts

              REPORT WRITING

              Qualitative

              • Market drivers
              • Market challenges
              • Market trends
              • Five forces analysis

              Quantitative

              • Market size and forecast
              • Market segmentation
              • Geographical insights
              • Competitive landscape

              Interested in this report?

              Get your sample now to see our research methodology and insights!

              Download Now

              Frequently Asked Questions

              Consumer IOT market growth will increase by $ 127.18 bn during 2024-2028 .

              The Consumer IOT market is expected to grow at a CAGR of 13.14% during 2024-2028 .

              Consumer IOT market is segmented by Type( Wireless, Wired) End-user( Home automation, Consumer electronics, Wearable devices, Healthcare)

              Amazon.com Inc., Apple Inc., AT and T Inc., Broadcom Inc., Cisco Systems Inc., Hewlett Packard Enterprise Co., Honeywell International Inc., Intel Corp., International Business Machines Corp., LG Corp., Microsoft Corp., NXP Semiconductors NV, Qorvo Inc., Qualcomm Inc., Samsung Electronics Co. Ltd., Schneider Electric SE, Sony Group Corp., STMicroelectronics International N.V., TE Connectivity Ltd., Texas Instruments Inc. are a few of the key vendors in the Consumer IOT market.

              North America will register the highest growth rate of 33% among the other regions. Therefore, the Consumer IOT market in North America is expected to garner significant business opportunities for the vendors during the forecast period.

              US, Canada, China, Germany, UK

              • Robust demand for smart wearablesSmart wearables is the driving factor this market.
              • such as fitness trackers and smartwatches is the driving factor this market.
              • offer advanced health monitoring features such as heart rate tracking is the driving factor this market.
              • sleep analysis is the driving factor this market.
              • step counting is the driving factor this market.
              • and workout tracking. Consumers are increasingly health-conscious and seek these devices to monitor and improve their fitness levels and overall well-being. Wearables offer convenience by providing quick access to notifications is the driving factor this market.
              • calls is the driving factor this market.
              • messages is the driving factor this market.
              • and other smartphone functionalities directly from the wrist. This connectivity aspect is particularly appealing to consumers who want to stay connected while on the go without having to check their phones constantly. Continuous technological advancements in wearables have led to improved battery life is the driving factor this market.
              • enhanced sensors for accurate health tracking is the driving factor this market.
              • sleeker designs is the driving factor this market.
              • and better integration with smartphones and other IoT devices is the driving factor this market.
              • making them more attractive to consumers. The growing demand for smart wearables will boost the growth of the global consumer IoT market during the forecast period. is the driving factor this market.

              The Consumer IOT market vendors should focus on grabbing business opportunities from the Wireless segment as it accounted for the largest market share in the base year.