
Courier, Express, And Parcel (CEP) Market Size 2026-2030
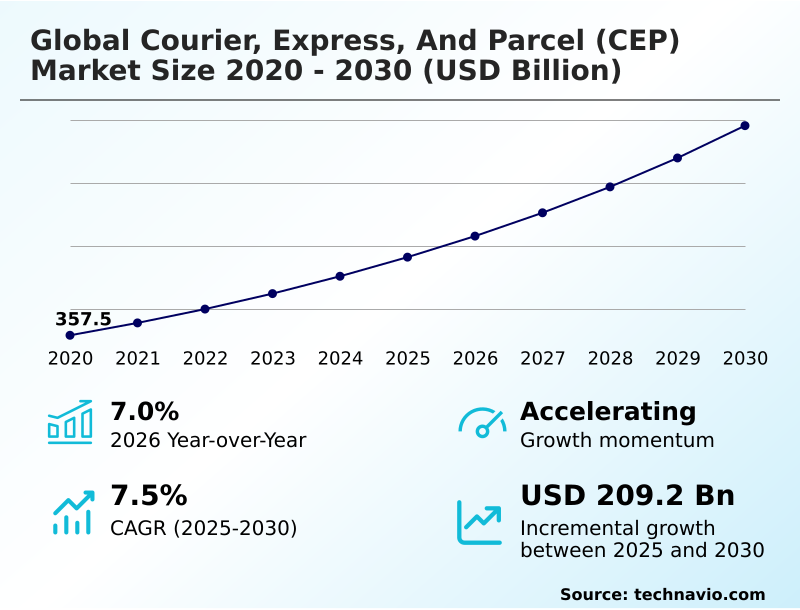
The courier, express, and parcel (cep) market size is valued to increase by USD 209.2 billion, at a CAGR of 7.5% from 2025 to 2030. Rapid proliferation of social commerce and digital platforms will drive the courier, express, and parcel (cep) market.
Major Market Trends & Insights
- APAC dominated the market and accounted for a 42.3% growth during the forecast period.
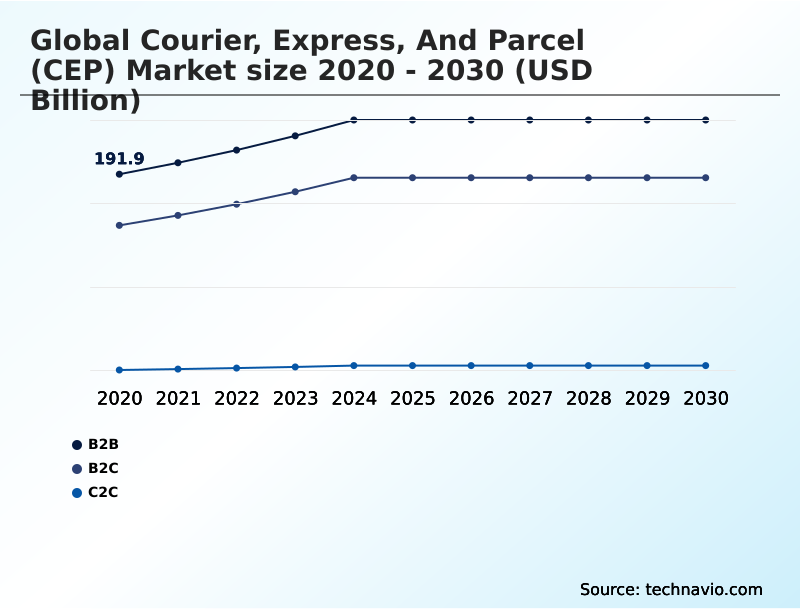
- By Consumer - B2B segment was valued at USD 239.8 billion in 2024
- By Delivery - International segment accounted for the largest market revenue share in 2024
Market Size & Forecast
- Market Opportunities: USD 333.5 billion
- Market Future Opportunities: USD 209.2 billion
- CAGR from 2025 to 2030 : 7.5%
Market Summary
- The courier, express, and parcel (cep) market is navigating a strategic pivot from volume-driven growth to operational excellence, fueled by technology. The rise of social commerce logistics has shifted focus to last-mile delivery optimization and hyper-local fulfillment, compelling investments in predictive route planning and warehouse automation.
- Companies are deploying robotic sorting systems and ai-powered visibility tools to manage fluctuating demand and enhance last-mile routing precision. A key scenario involves managing supply chains for e-commerce retailers, where autonomous delivery robots and on-demand courier services are used to meet same-day delivery promises in dense urban areas, reducing transit times by up to 40%.
- The adoption of sustainable aviation fuel and electric delivery vehicles is also becoming critical for regulatory compliance and meeting consumer expectations for green logistics solutions. This transition toward a technology-led model, emphasizing freight forwarding services and cross-border e-commerce logistics, defines the industry’s trajectory, with a focus on efficiency and sustainability through innovations like intermodal transportation and automated returns workflows.
- This digital transformation is essential for maintaining competitiveness in a market shaped by instant gratification and global connectivity.
What will be the Size of the Courier, Express, And Parcel (CEP) Market during the forecast period?
Get Key Insights on Market Forecast (PDF) Get Free Sample
How is the Courier, Express, And Parcel (CEP) Market Segmented?
The courier, express, and parcel (cep) industry research report provides comprehensive data (region-wise segment analysis), with forecasts and estimates in "USD billion" for the period 2026-2030, as well as historical data from 2020-2024 for the following segments.
- Consumer
- B2B
- B2C
- C2C
- Delivery
- International
- Domestic
- Service type
- Standard delivery
- Express delivery
- Same day or last mile delivery
- Geography
- APAC
- China
- Japan
- India
- North America
- US
- Canada
- Mexico
- Europe
- Germany
- UK
- France
- Middle East and Africa
- UAE
- Saudi Arabia
- South Africa
- South America
- Brazil
- Argentina
- Rest of World (ROW)
- APAC
By Consumer Insights
The b2b segment is estimated to witness significant growth during the forecast period.
The B2B segment of the global courier, express, and parcel (cep) market underpins industrial trade by moving commercial documents, manufacturing parts, and inventory restocks.
This ecosystem demands integration with client systems, facilitating automated booking and real-time shipment tracking via mobile-native logistics interfaces.
Strategic priorities include freight transport and specialized handling for sensitive cargo like medical equipment, enabled by customs clearance automation and ai-powered visibility tools.
As just-in-time models become standard, tailored b2b express services minimize on-site stock, with network optimization technology improving delivery reliability by over 15%.
This focus on network resilience, green logistics solutions, and advanced freight forwarding services ensures stability for global manufacturing and trade.
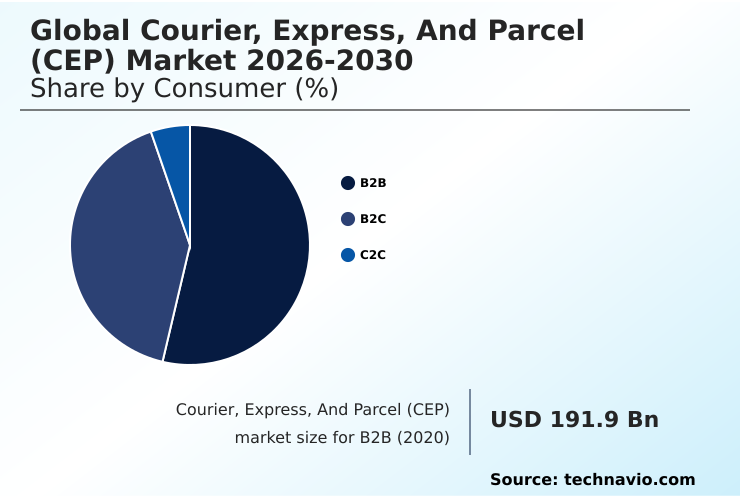
The B2B segment was valued at USD 239.8 billion in 2024 and showed a gradual increase during the forecast period.
Regional Analysis
APAC is estimated to contribute 42.3% to the growth of the global market during the forecast period.Technavio’s analysts have elaborately explained the regional trends and drivers that shape the market during the forecast period.
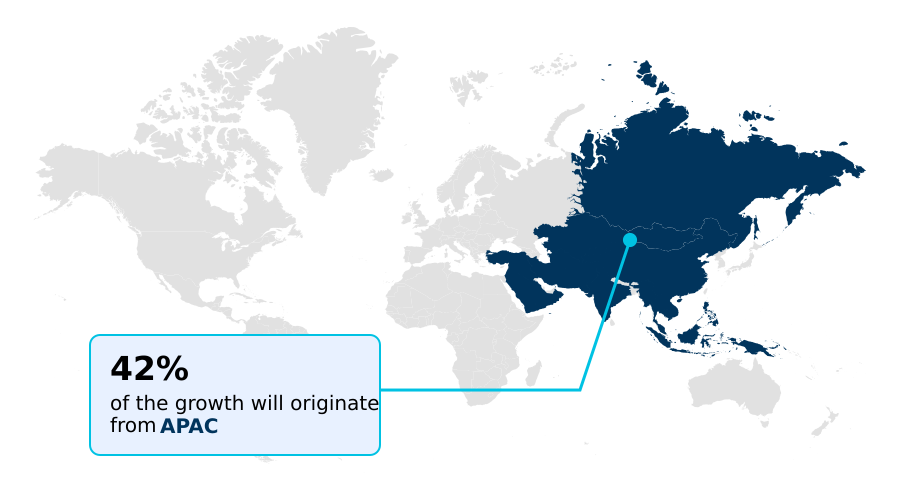
See How Courier, Express, And Parcel (CEP) Market Demand is Rising in APAC Get Free Sample
The geographic landscape of the courier, express, and parcel (cep) market is led by APAC, which accounts for over 42% of the incremental growth opportunity, driven by high-volume manufacturing and a surging digital economy.
North America follows, contributing nearly 29% to market expansion, with a focus on network optimization technology and healthcare-related cold chain logistics.
In Europe, which represents 22% of growth, the emphasis is on sustainability, with companies deploying electric delivery vehicles and investing in sustainable aviation fuel to comply with stringent regulations.
Operators in these key regions are using robotic sorting systems and freight forwarding services to manage both domestic parcel delivery and international express services, adapting to regional demands for B2B express services and last-mile routing precision.
Market Dynamics
Our researchers analyzed the data with 2025 as the base year, along with the key drivers, trends, and challenges. A holistic analysis of drivers will help companies refine their marketing strategies to gain a competitive advantage.
- The courier, express, and parcel (cep) market is increasingly focused on specialized use cases and complex operational challenges. A core focus is managing logistics for social commerce spikes, which requires agile demand forecasting and scalable infrastructure.
- This is closely tied to leveraging AI for demand forecasting and integrating AI for last mile routing precision, ensuring that delivery networks can handle sudden surges in volume without compromising efficiency. Firms are also prioritizing reducing carbon footprint with electric delivery vehicles, a key component of sustainable packaging in CEP market strategies that resonates with eco-conscious consumers.
- For international shipments, optimizing cross-border trade with customs automation is critical for minimizing delays and navigating complex tariff structures. In urban logistics, improving delivery density with urban consolidation centers and deploying autonomous delivery robots for urban logistics are becoming standard practices.
- The implementation of sustainable aviation fuel for air freight addresses long-haul emissions, while scaling operations with robotic sorting systems enhances throughput in fulfillment centers. Other vital areas include enhancing security for high-value B2B shipments, managing costs with predictive fleet maintenance, and streamlining returns with automated workflows.
- This is particularly relevant in specialized sectors like cold chain logistics for pharmaceutical delivery, where reliability is paramount. The difference between domestic vs international parcel services is becoming more nuanced with technology bridging the gap.
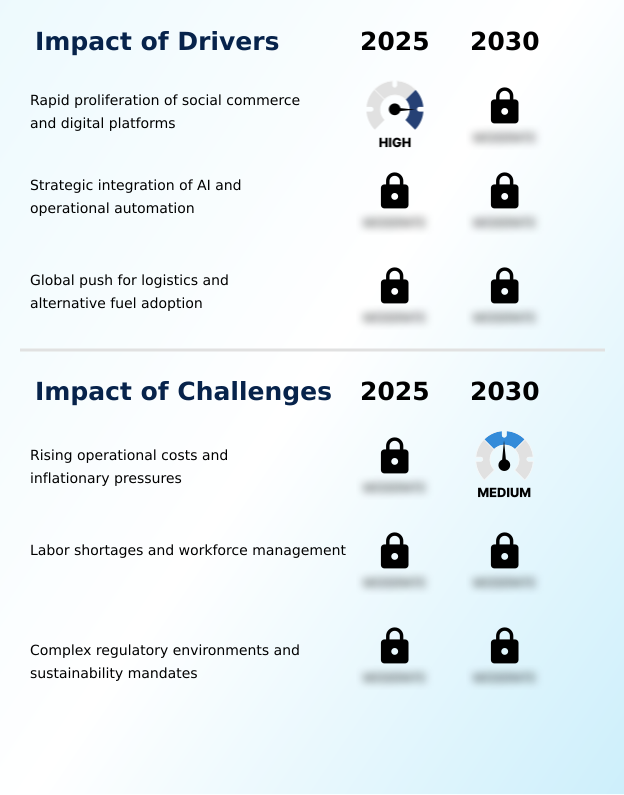
What are the key market drivers leading to the rise in the adoption of Courier, Express, And Parcel (CEP) Industry?
- The rapid proliferation of social commerce and digital platforms is a primary driver for the market, transforming retail flows toward individualized residential deliveries.
- Market growth is primarily driven by the convergence of social commerce logistics and the widespread adoption of AI.
- The proliferation of in-app purchasing has created a massive influx of lightweight parcel traffic, compelling investment in high-density distribution points and micro-fulfillment centers, which has cut last-mile delivery times by up to 35% in major cities.
- AI-powered visibility tools and machine learning algorithms are optimizing every stage of the supply chain, from predictive maintenance that reduces fleet downtime to the precision of last-mile routing.
- This strategic use of technology in both domestic and international parcel delivery allows logistics providers to offer specialized data insights, transitioning them from transport firms to technology-led partners.
- This evolution is crucial for handling express delivery and standard delivery volumes efficiently.
What are the market trends shaping the Courier, Express, And Parcel (CEP) Industry?
- Intelligent systems are transforming logistics operations, shifting the industry from basic automation toward agentic artificial intelligence capable of executing autonomous decisions.
- A dominant trend in the courier, express, and parcel (cep) market is the move toward autonomous logistics execution. Agentic artificial intelligence systems now independently reroute shipments to bypass disruptions, improving on-time delivery rates by up to 12% in volatile trade lanes. This shift enables real-time synchronization of inventory with demand signals, reducing stockouts by over 20% for e-commerce sellers.
- The adoption of PUDO network and parcel locker networks is also accelerating, offering consumers flexible out-of-home delivery solutions that lower last-mile operational costs. These intelligent systems, combined with a focus on decentralized delivery networks, are making the industry more resilient and responsive. Essential functions like package distribution and residential delivery are being redefined by these smart logistics capabilities.
What challenges does the Courier, Express, And Parcel (CEP) Industry face during its growth?
- Rising operational costs and persistent inflationary pressures present a key challenge to the industry, squeezing profit margins and impacting investment capabilities.
- A primary challenge facing the courier, express, and parcel (cep) market is navigating rising operational costs amid complex regulatory environments. Volatile fuel prices and wage inflation are squeezing margins, while investments in asset protection protocols and unmanned delivery vehicles require significant capital, increasing the cost of funding expansions by 10% in some regions.
- Furthermore, compliance with evolving sustainability mandates, such as emissions trading systems, and data privacy laws adds administrative complexity. The ongoing shortage of skilled labor, particularly drivers and warehouse personnel, creates further pressure, with some companies experiencing a 15% increase in hiring costs.
- These factors force operators to balance service quality with rigorous cost management, making operational efficiency paramount for last-mile delivery services and same-day delivery.
Exclusive Technavio Analysis on Customer Landscape
The courier, express, and parcel (cep) market forecasting report includes the adoption lifecycle of the market, covering from the innovator’s stage to the laggard’s stage. It focuses on adoption rates in different regions based on penetration. Furthermore, the courier, express, and parcel (cep) market report also includes key purchase criteria and drivers of price sensitivity to help companies evaluate and develop their market growth analysis strategies.
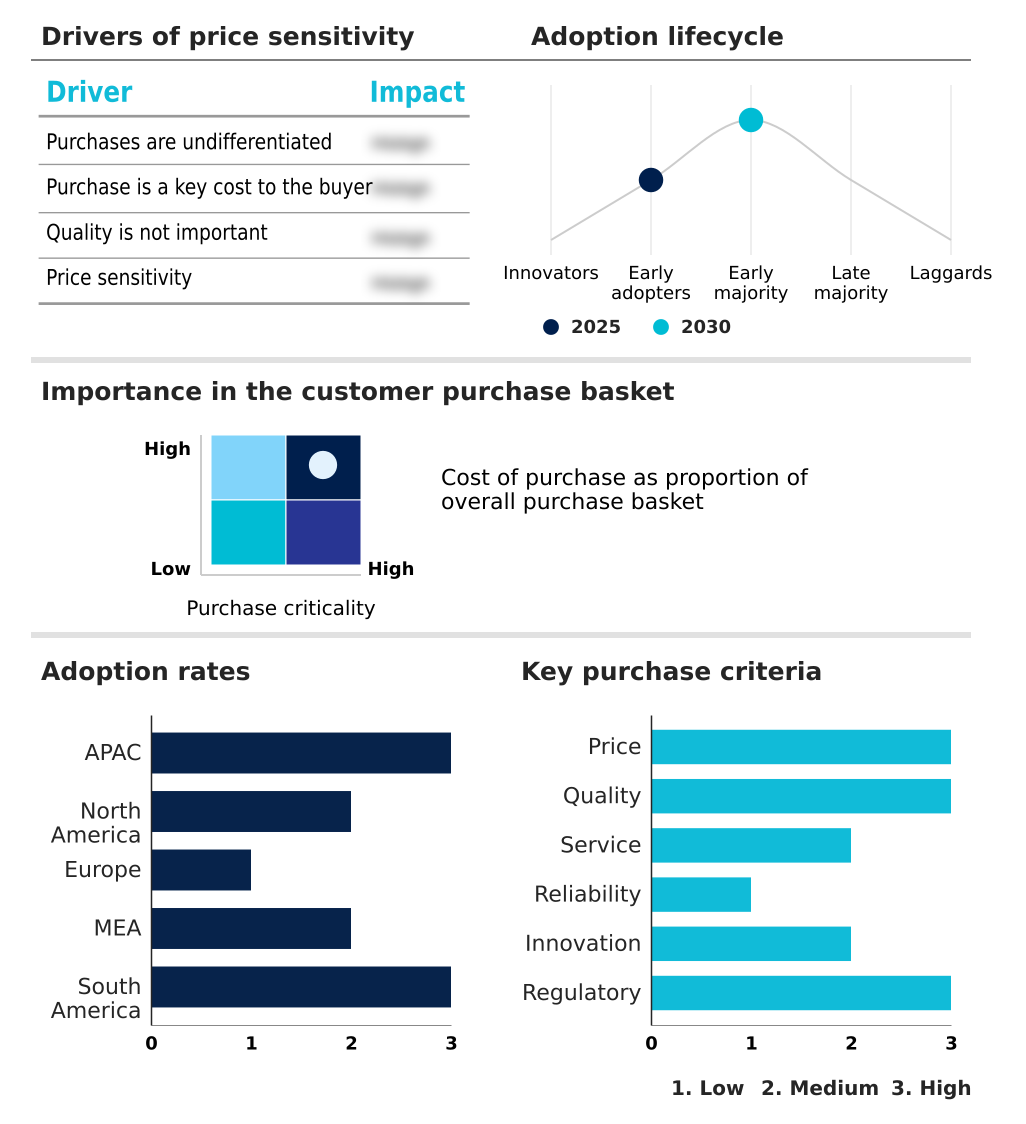
Customer Landscape of Courier, Express, And Parcel (CEP) Industry
Competitive Landscape
Companies are implementing various strategies, such as strategic alliances, courier, express, and parcel (cep) market forecast, partnerships, mergers and acquisitions, geographical expansion, and product/service launches, to enhance their presence in the industry.
Aramex PJSC - Delivers a portfolio of courier, express, and parcel (CEP) services, including time-definite international and domestic express solutions for B2B and B2C clients.
The industry research and growth report includes detailed analyses of the competitive landscape of the market and information about key companies, including:
- Aramex PJSC
- Australian Postal Corp.
- Canada Post Corp.
- CJ Logistics Corp.
- Delhivery Ltd.
- DHL International GmbH
- Evri Ltd.
- FedEx Corp.
- General Logistics Systems BV
- Geopost
- Japan Post Holdings Co. Ltd.
- Nippon Express Holdings Inc.
- PostNL NV
- Purolator Inc.
- Royal Mail Group Ltd.
- SF Express Co. Ltd.
- Singapore Post Ltd.
- United Parcel Service Inc.
- ZTO Express Cayman Inc.
Qualitative and quantitative analysis of companies has been conducted to help clients understand the wider business environment as well as the strengths and weaknesses of key industry players. Data is qualitatively analyzed to categorize companies as pure play, category-focused, industry-focused, and diversified; it is quantitatively analyzed to categorize companies as dominant, leading, strong, tentative, and weak.
Recent Development and News in Courier, express, and parcel (cep) market
- In March, 2025, FedEx successfully navigated new US tariff implementations by providing specialized customs clearance solutions to its global customers, leveraging electronic trade documents to minimize transit delays.
- In May, 2025, Uber expanded its domestic courier services in major Indian urban centers, including Delhi and Mumbai, by launching a new offering for the on-demand movement of large shipments.
- In March, 2025, DHL Group highlighted the complexities of its green fleet transition, citing the uneven availability of alternative fuels and the high capital cost of electric long-haul vehicles as significant challenges.
- In April, 2025, DHL eCommerce released its E-Commerce Trends Report, revealing that a significant percentage of global consumers anticipate shopping primarily through social media platforms, reshaping logistics requirements toward individual residential deliveries.
Dive into Technavio’s robust research methodology, blending expert interviews, extensive data synthesis, and validated models for unparalleled Courier, Express, And Parcel (CEP) Market insights. See full methodology.
| Market Scope | |
|---|---|
| Page number | 293 |
| Base year | 2025 |
| Historic period | 2020-2024 |
| Forecast period | 2026-2030 |
| Growth momentum & CAGR | Accelerate at a CAGR of 7.5% |
| Market growth 2026-2030 | USD 209.2 billion |
| Market structure | Fragmented |
| YoY growth 2025-2026(%) | 7.0% |
| Key countries | China, Japan, India, South Korea, Australia, Vietnam, US, Canada, Mexico, Germany, UK, France, Italy, Spain, Poland, UAE, Saudi Arabia, South Africa, Egypt, Qatar, Brazil, Argentina and Chile |
| Competitive landscape | Leading Companies, Market Positioning of Companies, Competitive Strategies, and Industry Risks |
Research Analyst Overview
- The courier, express, and parcel (cep) market is undergoing a fundamental transformation driven by the integration of advanced technologies and a strategic shift toward high-margin services. Core operations now depend on parcel sorting automation and warehouse automation to manage increasing volumes from cross-border e-commerce logistics.
- The push for last-mile delivery optimization is reshaping urban logistics, with companies deploying autonomous delivery robots and on-demand courier services. Boardroom decisions are increasingly centered on sustainability, mandating investments in sustainable aviation fuel and electric delivery vehicles to meet both regulatory targets and consumer demand. For instance, predictive route planning has enabled some operators to reduce fuel consumption by 15%.
- The expansion into specialized areas like cold chain logistics and time-definite international courier services demonstrates a move toward value-added offerings.
- This evolution is supported by technologies such as robotic sorting systems, dynamic rescheduling, and automated returns workflows, which are essential for maintaining profitability and service quality in a competitive global landscape that includes freight transport, air freight, ground transportation, and complex supply chain management.
What are the Key Data Covered in this Courier, Express, And Parcel (CEP) Market Research and Growth Report?
-
What is the expected growth of the Courier, Express, And Parcel (CEP) Market between 2026 and 2030?
-
USD 209.2 billion, at a CAGR of 7.5%
-
-
What segmentation does the market report cover?
-
The report is segmented by Consumer (B2B, B2C, and C2C), Delivery (International, and Domestic), Service Type (Standard delivery, Express delivery, and Same day or last mile delivery) and Geography (APAC, North America, Europe, Middle East and Africa, South America)
-
-
Which regions are analyzed in the report?
-
APAC, North America, Europe, Middle East and Africa and South America
-
-
What are the key growth drivers and market challenges?
-
Rapid proliferation of social commerce and digital platforms, Rising operational costs and inflationary pressures
-
-
Who are the major players in the Courier, Express, And Parcel (CEP) Market?
-
Aramex PJSC, Australian Postal Corp., Canada Post Corp., CJ Logistics Corp., Delhivery Ltd., DHL International GmbH, Evri Ltd., FedEx Corp., General Logistics Systems BV, Geopost, Japan Post Holdings Co. Ltd., Nippon Express Holdings Inc., PostNL NV, Purolator Inc., Royal Mail Group Ltd., SF Express Co. Ltd., Singapore Post Ltd., United Parcel Service Inc. and ZTO Express Cayman Inc.
-
Market Research Insights
- The courier, express, and parcel (cep) market is shaped by the strategic deployment of technology to enhance efficiency and meet evolving consumer demands. Logistics providers are leveraging agentic artificial intelligence and predictive maintenance to optimize operations, with some achieving a 25% reduction in vehicle downtime.
- The expansion of hyper-local fulfillment, supported by micro-fulfillment centers and high-density distribution points, has enabled a 30% improvement in last-mile delivery speeds in urban zones. The integration of mobile-native logistics interfaces directly into social commerce platforms is now standard, as is the use of out-of-home delivery solutions, which reduce failed delivery attempts by over 15%.
- This dynamic environment requires continuous innovation in areas like crowd-sourced delivery and reverse logistics channels to maintain profitability.
We can help! Our analysts can customize this courier, express, and parcel (cep) market research report to meet your requirements.
 RIA -
RIA - 
