
Custom Apparel Market Size 2026-2030
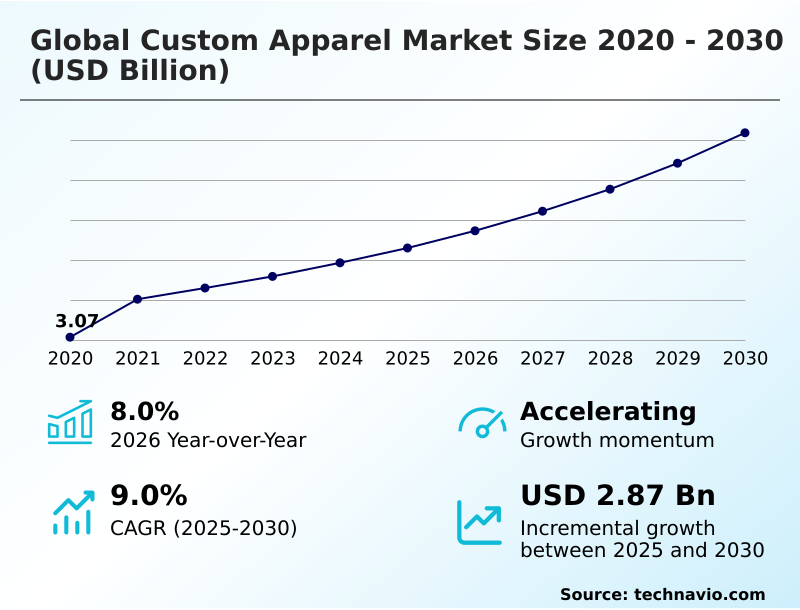
The custom apparel market size is valued to increase by USD 2.87 billion, at a CAGR of 9% from 2025 to 2030. Institutionalization of AI driven design and generative creative tools will drive the custom apparel market.
Major Market Trends & Insights
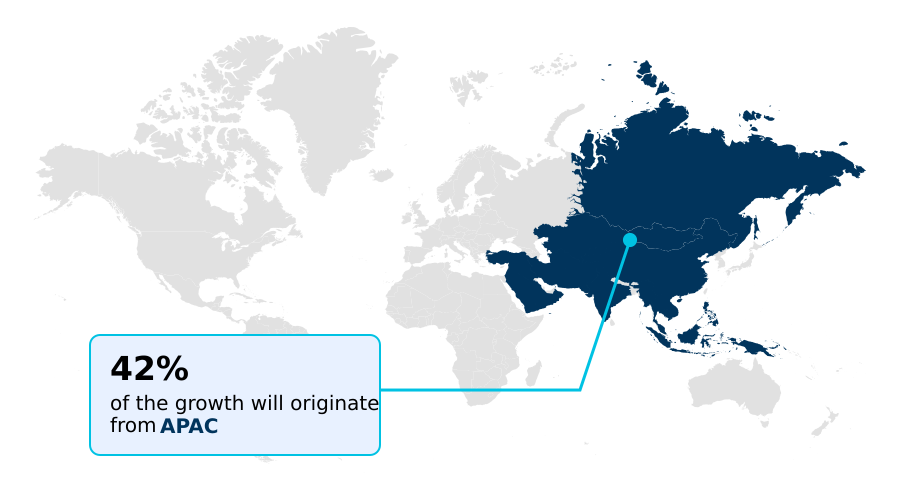
- APAC dominated the market and accounted for a 41.6% growth during the forecast period.
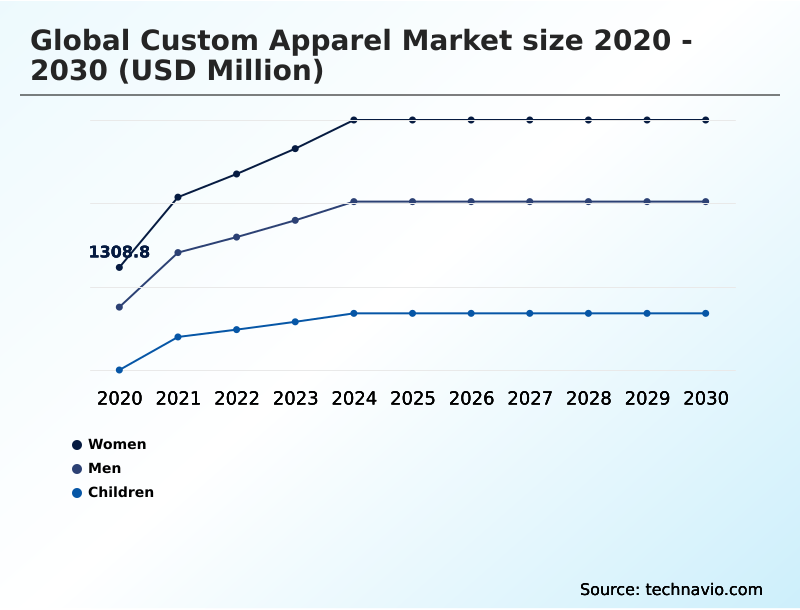
- By End-user - Women segment was valued at USD 2.19 billion in 2024
- By Distribution Channel - Offline segment accounted for the largest market revenue share in 2024
Market Size & Forecast
- Market Opportunities: USD 5.10 billion
- Market Future Opportunities: USD 2.87 billion
- CAGR from 2025 to 2030 : 9%
Market Summary
- The custom apparel market is undergoing profound industrial maturation, driven by the convergence of hyper-personalization technologies and demand for sustainable, small-batch manufacturing. This growth is supported by a shift from mass production to a demand-led economy, where advanced digital printing and automated systems deliver bespoke garments with speed and accuracy.
- Consumers prioritize self-expression, fueling a surge in popularity for items made with high-fidelity techniques. The evolution is accelerated by generative AI and 3D garment simulation software, allowing real-time design modification.
- For instance, a business can leverage a headless commerce architecture to integrate print-on-demand fulfillment services directly into their existing sales channels, enabling the launch of professional-grade creator economy merchandise with minimal capital investment by automating the workflow from design to final shipment, ensuring both scalability and brand consistency.
- This technological integration is pivotal for maintaining a competitive edge in an industry that increasingly values uniqueness and rapid response.
What will be the Size of the Custom Apparel Market during the forecast period?
Get Key Insights on Market Forecast (PDF) Get Free Sample
How is the Custom Apparel Market Segmented?
The custom apparel industry research report provides comprehensive data (region-wise segment analysis), with forecasts and estimates in "USD million" for the period 2026-2030, as well as historical data from 2020-2024 for the following segments.
- End-user
- Women
- Men
- Children
- Distribution channel
- Offline
- Online
- Product type
- T-Shirts
- Hoodies
- Uniforms
- Others
- Geography
- APAC
- China
- India
- Japan
- North America
- US
- Canada
- Mexico
- Europe
- Germany
- UK
- France
- South America
- Brazil
- Argentina
- Middle East and Africa
- Saudi Arabia
- UAE
- South Africa
- Rest of World (ROW)
- APAC
By End-user Insights
The women segment is estimated to witness significant growth during the forecast period.
The women segment is defined by an intense focus on fit, exclusivity, and the integration of digital styling tools like clothing personalization software.
This category has shifted from mass production toward bespoke garment creation, tailored to specific measurements using 3d body scanning for digital twin creation. Consumers utilize these services for hyper-personalized clothing and access a custom apparel sizing guide online.
The use of virtual try-on technology and high-fidelity garment visualization addresses a primary hurdle, reducing logistical burdens by minimizing returns by over 25%.
AI-powered design personalization and the demand for made-to-order clothing are driving sustainable apparel manufacturing practices, including the use of organic cotton blends.
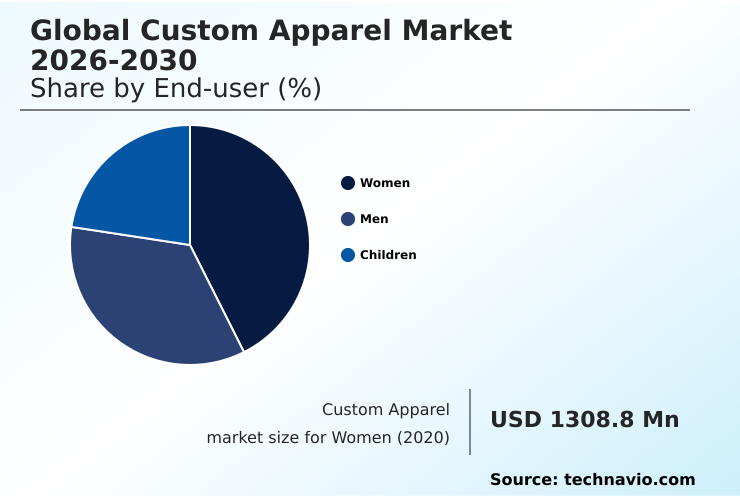
The Women segment was valued at USD 2.19 billion in 2024 and showed a gradual increase during the forecast period.
Regional Analysis
APAC is estimated to contribute 41.6% to the growth of the global market during the forecast period.Technavio’s analysts have elaborately explained the regional trends and drivers that shape the market during the forecast period.
See How Custom Apparel Market Demand is Rising in APAC Get Free Sample
APAC is the fastest-growing region, accounting for 41.6% of incremental growth, propelled by its extensive textile base for personalized corporate apparel.
North America remains a primary revenue driver, contributing 25.6%, reshaped by sophisticated social commerce storefronts and on-demand manufacturing with heat transfer vinyl application.
Europe is a mature market defined by craftsmanship and strict regulations, emphasizing local apparel production and smart textiles integration. The region leads the move toward a system where dye-sublimation printing and automated cutting systems are used in localized fulfillment centers.
Fashion-tech customization tools are common, with cloud-based tailoring platforms managing creator economy merchandise via headless commerce architecture.
Market Dynamics
Our researchers analyzed the data with 2025 as the base year, along with the key drivers, trends, and challenges. A holistic analysis of drivers will help companies refine their marketing strategies to gain a competitive advantage.
- Strategic decision-making in the custom apparel market increasingly revolves around balancing innovation with sustainability and logistical efficiency. Key considerations include evaluating direct-to-garment vs screen printing for small batches, where digital methods offer superior flexibility.
- Firms are now focused on implementing a digital product passport for apparel to meet new regulatory standards and are exploring ai for predictive sizing in custom clothing to enhance customer satisfaction. The precision of 3d body scanning accuracy for bespoke tailoring is a critical factor for premium services.
- For print-on-demand services, sourcing sustainable materials for print-on-demand services is no longer optional. A thorough cost-benefit of nearshoring apparel manufacturing is necessary to counter supply chain disruptions, which have been shown to impact delivery timelines more than twice as much as production delays.
- The successful virtual try-on integration for e-commerce can be a significant differentiator, as can leveraging generative ai for unique textile patterns. Addressing the challenges of reselling returned custom apparel is a major operational hurdle, while integrating blockchain for supply chain transparency builds consumer trust.
- Ultimately, the roi of micro-factories for custom apparel and ensuring compliance with eco-design for sustainable products are central to long-term viability. Other critical focus areas include reducing return rates with ai-driven sizing, refining custom apparel logistics and fulfillment strategies, using smart textiles in functional custom wear, and leveraging the benefits of water-based inks in textile printing.
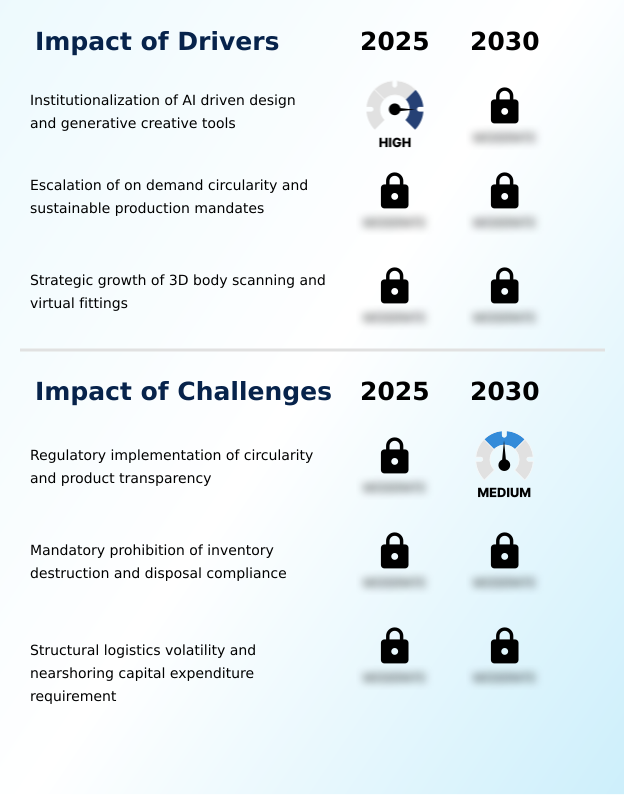
What are the key market drivers leading to the rise in the adoption of Custom Apparel Industry?
- The institutionalization of AI-driven design and generative creative tools that empower consumers is a key market driver.
- A primary driver is the institutionalization of AI tools empowering consumers to lead the design process. The industry is moving toward a hyper-personalized ecosystem for bespoke tailoring services, where AI-driven fit algorithms and textile physics algorithms democratize bespoke garment creation.
- The proliferation of 3D body scanning and digital measurement applications is essential for e-commerce platform integration, virtually eliminating return rates associated with poor fit by over 30%.
- Escalating mandates for ethical fashion production and on-demand circularity favor custom goods, supported by biometric data privacy standards for personal data. This allows for screen printing of promotional product customization with confidence as water-based inks and print-on-demand fulfillment become standard.
What are the market trends shaping the Custom Apparel Industry?
- The market is witnessing significant advancements in sustainable on-demand manufacturing cycles. This trend prioritizes environmental stewardship and waste reduction across the industry.
- The market is shaped by the industrialization of generative design AI and sophisticated apparel design automation, enabling custom pattern generation. This allows for complex, AI-generated graphics, fueling a 61% share for graphic design. Consumers are evolving into active co-creators via automated design libraries, a key feature for custom sportswear solutions.
- Sustainable on-demand manufacturing is another critical trend, with firms adopting direct-to-film printing and zero-waste cutting technology. This pivot to eco-friendly printing solutions and the use of recycled polyester reflects a broader movement where sustainability is a core operational strategy, supported by blockchain-based traceability for custom accessory printing and print-on-demand drop shipping.
What challenges does the Custom Apparel Industry face during its growth?
- The regulatory implementation of circularity and product transparency presents a key challenge affecting industry growth.
- A primary challenge is transitioning to regulatory frameworks for circularity and supply chain transparency tech. Prohibiting inventory destruction is a hurdle for on-demand merchandise production, especially for items with 3D puff embroidery where resale is difficult. Logistics volatility, causing price surges of 15%, undermines offshore models for custom team uniforms, affecting digital textile printing services.
- The capital expenditure for nearshoring production and micro-manufacturing models is a barrier for small-batch apparel manufacturing. Firms find a lack of data protocols among direct-to-consumer apparel brands creates compliance issues with the digital product passport. This forces investment in robotic textile handling and automated color correction for a circular fashion framework, even for custom embroidered patches.
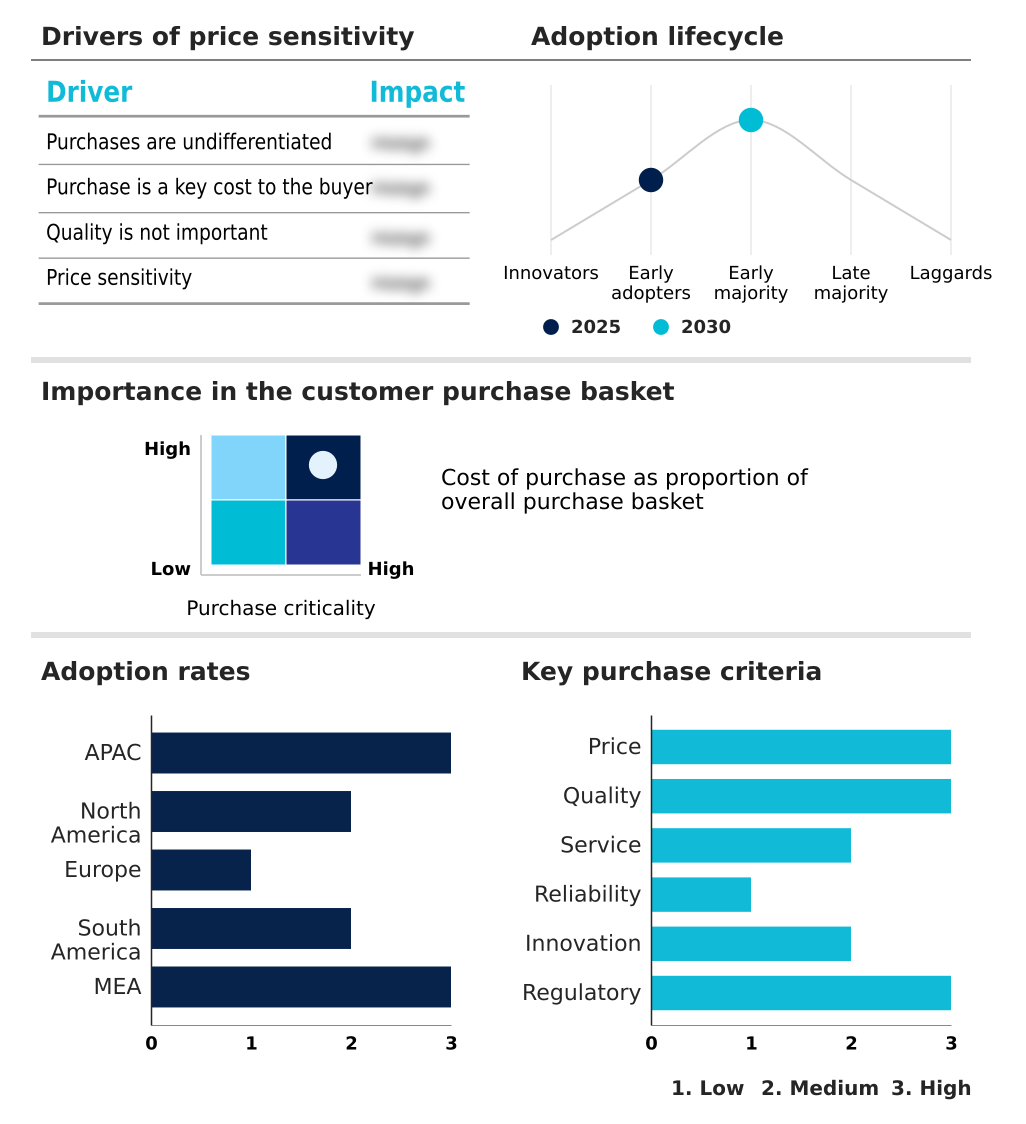
Exclusive Technavio Analysis on Customer Landscape
The custom apparel market forecasting report includes the adoption lifecycle of the market, covering from the innovator’s stage to the laggard’s stage. It focuses on adoption rates in different regions based on penetration. Furthermore, the custom apparel market report also includes key purchase criteria and drivers of price sensitivity to help companies evaluate and develop their market growth analysis strategies.
Customer Landscape of Custom Apparel Industry
Competitive Landscape
Companies are implementing various strategies, such as strategic alliances, custom apparel market forecast, partnerships, mergers and acquisitions, geographical expansion, and product/service launches, to enhance their presence in the industry.
Apliiq - Offers on-demand printing solutions for branded clothing, including custom T-shirts, hoodies, and private-label streetwear with embroidery and woven labels.
The industry research and growth report includes detailed analyses of the competitive landscape of the market and information about key companies, including:
- Apliiq
- Apparel Markets LLC
- Big Frog Franchise Group
- Blanks
- BlueCotton Inc.
- Broken Arrow Custom T-Shirt
- Contrado Imaging Ltd.
- CustomInk LLC
- Designhill Inc.
- Gelato ASA
- JiffyShirts.com
- ooShirts Inc.
- Printfly Corp.
- Printful Inc.
- Printify Inc.
- Real Thread
- Spreadshirt Inc.
- Teespring Inc.
- Threadbird
- UberPrints Inc.
Qualitative and quantitative analysis of companies has been conducted to help clients understand the wider business environment as well as the strengths and weaknesses of key industry players. Data is qualitatively analyzed to categorize companies as pure play, category-focused, industry-focused, and diversified; it is quantitatively analyzed to categorize companies as dominant, leading, strong, tentative, and weak.
Recent Development and News in Custom apparel market
- In August, 2024, Gildan Activewear announced plans to acquire Hanesbrands for $2.2 billion, a move intended to consolidate its market position in large-scale basic apparel customization.
- In February, 2025, Procolored launched an integrated artificial intelligence suite that uses machine learning for automated trend analysis and high-precision mockup generation, significantly reducing ideation and prototyping time.
- In March, 2025, Gelato ASA released its State of Intelligent Print Production 2026 report, highlighting the widespread use of automated software to synchronize global fulfillment networks and reduce production waste.
- In April, 2025, Printful Inc. launched a strategic initiative championing sustainable fashion through made-to-order production workflows, integrating more eco-friendly fabric options and water-based inks for online sellers.
Dive into Technavio’s robust research methodology, blending expert interviews, extensive data synthesis, and validated models for unparalleled Custom Apparel Market insights. See full methodology.
| Market Scope | |
|---|---|
| Page number | 289 |
| Base year | 2025 |
| Historic period | 2020-2024 |
| Forecast period | 2026-2030 |
| Growth momentum & CAGR | Accelerate at a CAGR of 9% |
| Market growth 2026-2030 | USD 2872.4 million |
| Market structure | Fragmented |
| YoY growth 2025-2026(%) | 8.0% |
| Key countries | China, India, Japan, South Korea, Australia, Indonesia, US, Canada, Mexico, Germany, UK, France, Italy, Spain, The Netherlands, Brazil, Argentina, Chile, Saudi Arabia, UAE, South Africa, Turkey and Israel |
| Competitive landscape | Leading Companies, Market Positioning of Companies, Competitive Strategies, and Industry Risks |
Research Analyst Overview
- The custom apparel market is undergoing a structural transformation centered on intelligent automation and sustainable production. The integration of direct-to-garment printing has democratized production, enabling print-on-demand fulfillment at scale. A core boardroom-level focus is on supply chain transparency tech and implementing a circular fashion framework to meet regulatory demands.
- Technologies like generative design AI and automated cutting systems are no longer niche; they are essential for creating unique products and ensuring precision. Firms are leveraging AI-driven fit algorithms with cloud-based tailoring platforms to offer unparalleled personalization.
- The adoption of these tools has a measurable impact; for instance, some companies have achieved a 40% reduction in production turnaround times by using automated color correction and other textile physics algorithms. This efficiency, combined with advanced materials and smart textiles integration, is defining the next wave of competitive advantage.
- The market is shifting toward a model where robotic textile handling and a sophisticated headless commerce architecture are standard.
What are the Key Data Covered in this Custom Apparel Market Research and Growth Report?
-
What is the expected growth of the Custom Apparel Market between 2026 and 2030?
-
USD 2.87 billion, at a CAGR of 9%
-
-
What segmentation does the market report cover?
-
The report is segmented by End-user (Women, Men, and Children), Distribution Channel (Offline, and Online), Product Type (T-Shirts, Hoodies, Uniforms, and Others) and Geography (APAC, North America, Europe, South America, Middle East and Africa)
-
-
Which regions are analyzed in the report?
-
APAC, North America, Europe, South America and Middle East and Africa
-
-
What are the key growth drivers and market challenges?
-
Institutionalization of AI driven design and generative creative tools, Regulatory implementation of circularity and product transparency
-
-
Who are the major players in the Custom Apparel Market?
-
Apliiq, Apparel Markets LLC, Big Frog Franchise Group, Blanks, BlueCotton Inc., Broken Arrow Custom T-Shirt, Contrado Imaging Ltd., CustomInk LLC, Designhill Inc., Gelato ASA, JiffyShirts.com, ooShirts Inc., Printfly Corp., Printful Inc., Printify Inc., Real Thread, Spreadshirt Inc., Teespring Inc., Threadbird and UberPrints Inc.
-
Market Research Insights
- The custom apparel market's dynamics are shaped by a strategic push toward technological integration and operational efficiency. Platforms offering e-commerce platform integration and social commerce storefronts are capitalizing on the demand for accessible personalization. The adoption of virtual fitting room software has been critical, with some retailers reporting a decrease in return rates of over 30%, directly improving profitability.
- Fashion-tech customization tools are enabling direct-to-consumer apparel brands to thrive. Concurrently, logistics volatility has led to price surges of nearly 15% for some materials, pushing companies toward local apparel production models to mitigate supply chain risks and shorten lead times, a key factor in a market where speed-to-customer is paramount.
We can help! Our analysts can customize this custom apparel market research report to meet your requirements.
 RIA -
RIA - 
