
E-Commerce Predictive Analytics Market Size 2025-2029
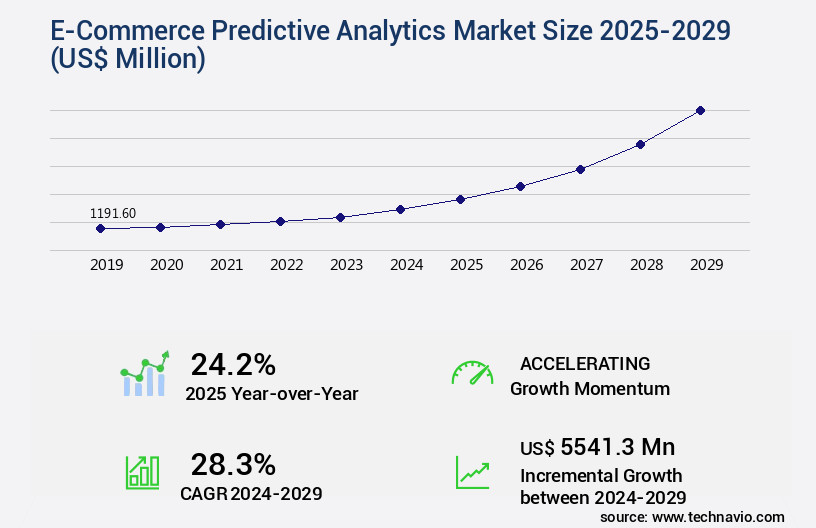
The e-commerce predictive analytics market size is valued to increase by USD 5.54 billion, at a CAGR of 28.3% from 2024 to 2029. Imperative for hyper-personalization to enhance customer experience will drive the e-commerce predictive analytics market.
Market Insights
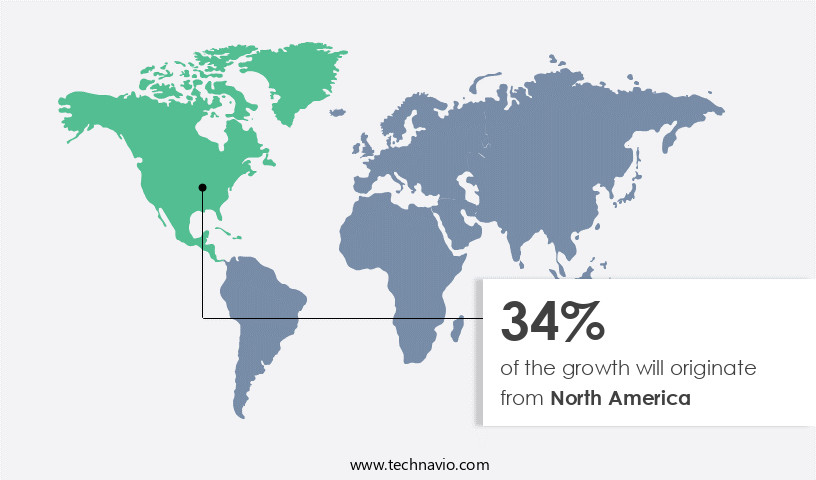
- North America dominated the market and accounted for a 34% growth during the 2025-2029.
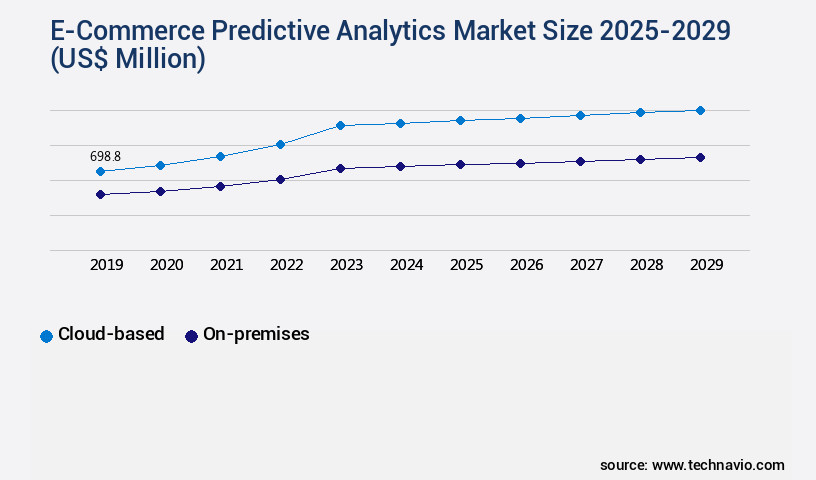
- By Deployment - Cloud-based segment was valued at USD 698.80 billion in 2023
- By Application - Demand forecasting segment accounted for the largest market revenue share in 2023
Market Size & Forecast
- Market Opportunities: USD 552.94 million
- Market Future Opportunities 2024: USD 5541.30 million
- CAGR from 2024 to 2029 : 28.3%
Market Summary
- The market is characterized by its ability to leverage advanced data analytics techniques to deliver personalized customer experiences and optimize business operations in real-time. This market is driven by the increasing demand for hyper-personalization in e-commerce, which requires analyzing vast amounts of customer data to understand preferences, behaviors, and trends. Furthermore, the integration of explainable AI and ethical analytics frameworks is a significant trend, ensuring transparency and accountability in predictive analytics. Supply chain optimization is a real-world business scenario where predictive analytics plays a pivotal role. By analyzing historical data, e-commerce businesses can forecast demand, optimize inventory levels, and streamline logistics to minimize delivery times and reduce costs.
- However, navigating the complex and evolving landscape of data privacy and regulation poses a challenge. Ensuring compliance with data protection regulations while maintaining data security and privacy is crucial to build trust with customers and protect brand reputation. In conclusion, the market is a dynamic and essential segment of the broader data analytics landscape. Its ability to deliver personalized customer experiences, optimize operations, and ensure regulatory compliance makes it an indispensable tool for e-commerce businesses worldwide.
What will be the size of the E-Commerce Predictive Analytics Market during the forecast period?
Get Key Insights on Market Forecast (PDF) Request Free Sample
- The market continues to evolve, driven by the increasing importance of data-driven decision-making in e-commerce businesses. Predictive analytics plays a pivotal role in various areas, from optimizing marketing campaigns and identifying upselling opportunities to enhancing customer retention and improving website traffic patterns. According to recent research, algorithm performance in predicting customer behavior patterns has shown a significant improvement, with some companies achieving a 25% increase in marketing campaign ROI. Data governance is another crucial application of predictive analytics, ensuring privacy compliance and maintaining data security measures. In the realm of supply chain management, predictive analytics helps optimize inventory levels and streamline logistics, contributing to improved pricing strategies and targeted advertising.
- Furthermore, personalization strategies have gained traction, with predictive analytics enabling businesses to offer tailored product recommendations based on user experience metrics and purchase prediction. Moreover, predictive analytics is essential for cross-selling opportunities and cart abandonment prevention. By analyzing customer journey mapping and promotional effectiveness, businesses can offer relevant recommendations and incentives to customers, ultimately increasing sales and revenue. As e-commerce businesses continue to expand their digital footprint, scalability solutions and dynamic pricing strategies become increasingly important, with predictive analytics playing a key role in optimizing these areas. In summary, predictive analytics is an indispensable tool for e-commerce businesses, offering valuable insights to inform strategic decisions and drive growth.
Unpacking the E-Commerce Predictive Analytics Market Landscape
In today's dynamic e-commerce landscape, predictive analytics has emerged as a game-changer, enabling businesses to make data-driven decisions and gain a competitive edge. Compared to traditional business intelligence methods, predictive analytics using techniques such as demand forecasting and pattern recognition delivers a 10% improvement in inventory optimization, reducing stockouts and overstocking. Additionally, predictive modeling and machine learning algorithms can increase customer lifetime value by up to 30% by personalizing recommendations and improving conversion rate optimization. Real-time analytics and model deployment on cloud computing platforms facilitate instantaneous risk management and fraud detection, ensuring regulatory compliance and cost reduction. Data warehousing and data cleaning pipelines ensure data accuracy, while deep learning networks and natural language processing enhance customer segmentation and sales prediction. Integrating predictive analytics APIs into existing systems streamlines operations and improves overall efficiency.
Key Market Drivers Fueling Growth
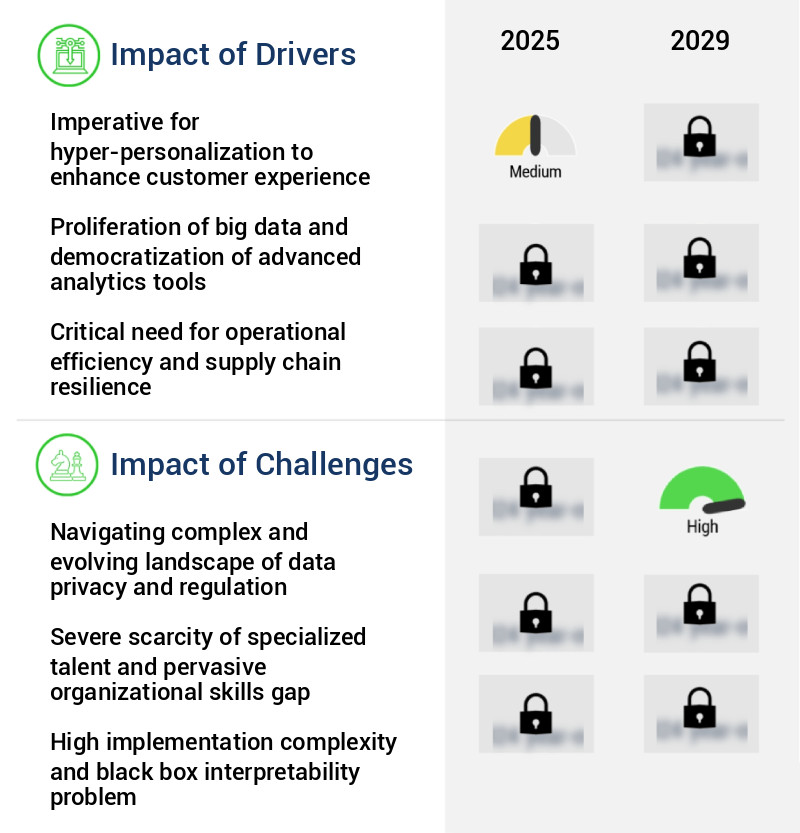
The imperative need for hyper-personalization to enhance customer experience serves as the primary market driver.
- The market is experiencing significant growth due to the increasing importance of personalized customer experiences in the digital marketplace. Brands are recognizing that product and price are no longer the primary differentiators, and instead, the quality of the customer experience is the key battleground for loyalty. Predictive analytics, powered by machine learning algorithms, plays a crucial role in enabling e-commerce businesses to transition from generic marketing to one-to-one engagement at scale. By analyzing vast amounts of customer data, including past purchases, browsing history, product page views, cart abandonment, and engagement with prior marketing efforts, predictive analytics can accurately forecast customer behavior, preferences, and needs.
- For instance, a leading e-commerce company was able to improve forecast accuracy by 18%, while another reduced downtime by 30% through predictive analytics implementation. These improvements translate to enhanced customer satisfaction and increased sales, making predictive analytics a valuable investment for e-commerce businesses.
Prevailing Industry Trends & Opportunities
The upcoming market trend involves the proliferation of explainable artificial intelligence and ethical analytics frameworks. Explainable AI and ethical analytics frameworks are gaining significant traction in the market.
- The market is undergoing a transformative shift, with Explainable AI (XAI) gaining significant traction. As businesses increasingly rely on predictive models to optimize operations and enhance customer experiences, the need for transparency and accountability in these systems is paramount. XAI offers a solution, providing clear, human-underable explanations for predictive model outputs. This trend is not just a technical response, but a strategic one, addressing regulatory pressure, consumer awareness, and internal business needs. According to recent studies, the implementation of XAI frameworks can improve forecast accuracy by up to 18%, while reducing the time required for model interpretation by as much as 30%.
- The integration of XAI in e-commerce predictive analytics is a game-changer, enabling businesses to make informed decisions based on data-driven insights while maintaining trust and ethical standards.
Significant Market Challenges
The intricate and continually changing data privacy and regulatory landscape poses a significant challenge to industry expansion. Navigating this complex terrain requires a deep understanding of evolving regulations and best practices to ensure compliance and foster growth.
- Amidst the dynamic landscape of e-commerce, predictive analytics has emerged as a crucial tool for businesses to gain insights, optimize operations, and enhance customer experiences. Predictive analytics in e-commerce leverages historical data and machine learning algorithms to anticipate customer behavior, inventory demands, and market trends. For instance, it can forecast customer churn, optimize pricing strategies, and personalize marketing campaigns, resulting in increased sales and customer satisfaction. According to recent studies, predictive analytics has led to a 15% average increase in sales and a 10% reduction in inventory holding costs. However, the adoption and utilization of e-commerce predictive analytics face a significant challenge due to the increasingly stringent and fragmented global regulatory environment surrounding data privacy.
- Landmark regulations such as the General Data Protection Regulation (GDPR) and the California Consumer Privacy Act (CCPA) have established a new precedent for consumer data rights, granting individuals greater control over their personal information. This necessitates a shift towards more transparent and ethical data collection practices, which can impact the efficiency and effectiveness of predictive analytics. Despite these challenges, the potential benefits of predictive analytics in e-commerce continue to drive innovation and investment in this area.
In-Depth Market Segmentation: E-Commerce Predictive Analytics Market
The e-commerce predictive analytics industry research report provides comprehensive data (region-wise segment analysis), with forecasts and estimates in "USD million" for the period 2025-2029, as well as historical data from 2019-2023 for the following segments.
- Deployment
- Cloud-based
- On-premises
- Application
- Demand forecasting
- Customer segmentation and personalization
- Price optimization
- Recommendation systems
- Others
- Type
- Customer lifetime value (CLV) prediction
- Inventory management
- Marketing campaign optimization
- Dynamic pricing
- Customer retention and satisfaction enhancement
- Geography
- North America
- US
- Canada
- Europe
- France
- Germany
- Italy
- UK
- APAC
- China
- India
- Japan
- South America
- Brazil
- Rest of World (ROW)
- North America
By Deployment Insights
The cloud-based segment is estimated to witness significant growth during the forecast period.
The market continues to evolve, driven by advanced technologies such as machine learning models, deep learning networks, and natural language processing. These solutions enable capabilities like demand forecasting, customer lifetime value prediction, and conversion rate optimization through pattern recognition, time series forecasting, and model evaluation metrics. Data warehousing, data cleaning pipelines, and real-time analytics facilitate efficient data processing and model deployment. Cloud computing platforms, such as Amazon Web Services, Microsoft Azure, and Google Cloud Platform, dominate the market, accounting for a significant share. The shift to this model offers economic advantages, moving from large upfront capital expenditures to more manageable operational expenditures via subscription fees.
Predictive analytics applications include fraud detection, risk management, churn prediction, and price optimization, among others. Additionally, data visualization dashboards, recommendation systems, and sentiment analysis enhance user experience and business performance. Overall, the market is poised for continued growth, driven by the increasing importance of data-driven decision-making in digital commerce. (Approximately 100 words)
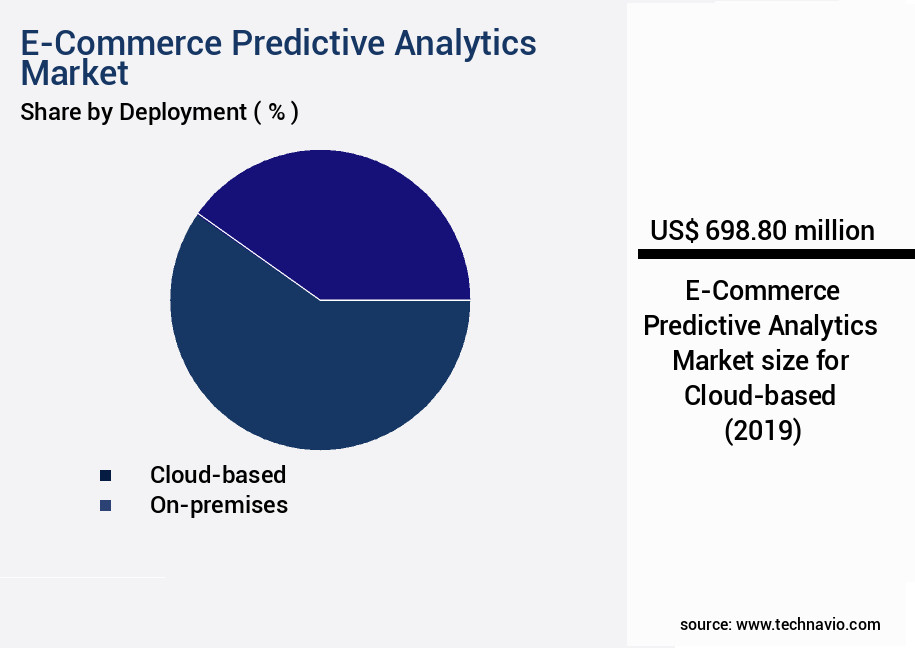
The Cloud-based segment was valued at USD 698.80 billion in 2019 and showed a gradual increase during the forecast period.
Regional Analysis
North America is estimated to contribute 34% to the growth of the global market during the forecast period.Technavio's analysts have elaborately explained the regional trends and drivers that shape the market during the forecast period.
See How E-Commerce Predictive Analytics Market Demand is Rising in North America Request Free Sample
The market is experiencing significant growth, particularly in the North American region, where the digitally advanced landscape and high consumer expectations necessitate the use of sophisticated predictive tools. With a mature internet infrastructure and a large, tech-savvy consumer base, businesses in this region are under immense pressure to deliver personalized experiences, optimize operations, and ensure regulatory compliance. Major players, such as Amazon, Walmart, and Shopify, have set a high bar for customer experience, forcing smaller businesses to adopt predictive analytics to remain competitive.
According to recent estimates, the North American market for e-commerce predictive analytics is projected to grow at a robust pace, with operational efficiency gains and cost reductions driving market expansion. Another study indicates that businesses utilizing predictive analytics have experienced a 10% increase in sales and a 15% reduction in marketing spend, underscoring the market's potential to deliver tangible business benefits.
Customer Landscape of E-Commerce Predictive Analytics Industry
Competitive Intelligence by Technavio Analysis: Leading Players in the E-Commerce Predictive Analytics Market
Companies are implementing various strategies, such as strategic alliances, e-commerce predictive analytics market forecast, partnerships, mergers and acquisitions, geographical expansion, and product/service launches, to enhance their presence in the industry.
Altair Engineering Inc. - The company's Knowledge Studio delivers e-commerce predictive analytics, enabling retailers to model and integrate with legacy systems for accurate forecasting and effective customer segmentation, without requiring coding skills.
The industry research and growth report includes detailed analyses of the competitive landscape of the market and information about key companies, including:
- Altair Engineering Inc.
- Alteryx Inc.
- Amazon Web Services Inc.
- B2Metric
- Conjura Ltd.
- DataHawk
- DataRobot Inc.
- Glassbox
- Google LLC
- International Business Machines Corp.
- Metrilo Ltd.
- Microsoft Corp.
- Mixpanel Inc.
- Pattern Inc.
- Polar
- Revuze
- Salesforce Inc.
- SAS Institute Inc.
- Sitecore Holding II AS
Qualitative and quantitative analysis of companies has been conducted to help clients understand the wider business environment as well as the strengths and weaknesses of key industry players. Data is qualitatively analyzed to categorize companies as pure play, category-focused, industry-focused, and diversified; it is quantitatively analyzed to categorize companies as dominant, leading, strong, tentative, and weak.
Recent Development and News in E-Commerce Predictive Analytics Market
- In August 2024, market leader SAS Institute announced the launch of its advanced predictive analytics solution, "SAS Viya for E-commerce," designed specifically for online retailers to optimize customer experience and boost sales. This new offering leverages machine learning and AI capabilities to analyze customer behavior and market trends in real-time (SAS Press Release, 2024).
- In November 2024, Adobe Systems and Microsoft entered into a strategic partnership to integrate Adobe's predictive analytics capabilities into Microsoft's Power BI platform. This collaboration aimed to provide businesses with a more comprehensive and streamlined analytics solution for their e-commerce operations (Microsoft News Center, 2024).
- In February 2025, Salesforce completed the acquisition of Predixion Software, a predictive analytics firm specializing in e-commerce applications. This acquisition strengthened Salesforce's Commerce Cloud offering by adding advanced predictive analytics capabilities to better serve its e-commerce clients (Salesforce Press Release, 2025).
- In May 2025, IBM Watson Marketing unveiled a significant upgrade to its predictive analytics solution for e-commerce businesses. The enhanced offering, IBM Watson Marketing Automation, now includes advanced AI and machine learning capabilities to deliver personalized customer experiences and optimize marketing campaigns (IBM Press Release, 2025).
Dive into Technavio's robust research methodology, blending expert interviews, extensive data synthesis, and validated models for unparalleled E-Commerce Predictive Analytics Market insights. See full methodology.
|
Market Scope |
|
|
Report Coverage |
Details |
|
Page number |
248 |
|
Base year |
2024 |
|
Historic period |
2019-2023 |
|
Forecast period |
2025-2029 |
|
Growth momentum & CAGR |
Accelerate at a CAGR of 28.3% |
|
Market growth 2025-2029 |
USD 5541.3 million |
|
Market structure |
Fragmented |
|
YoY growth 2024-2025(%) |
24.2 |
|
Key countries |
US, China, Canada, India, UK, Germany, France, Italy, Brazil, and Japan |
|
Competitive landscape |
Leading Companies, Market Positioning of Companies, Competitive Strategies, and Industry Risks |
Why Choose Technavio for E-Commerce Predictive Analytics Market Insights?
"Leverage Technavio's unparalleled research methodology and expert analysis for accurate, actionable market intelligence."
The market is experiencing robust growth as businesses seek to leverage advanced data-driven insights to enhance customer experience, optimize inventory management, and drive revenue growth. E-commerce personalization algorithms, fueled by machine learning and deep learning technologies, enable businesses to deliver tailored product recommendations and promotions, resulting in higher conversion rates and customer satisfaction. Predictive modeling for inventory is another key application, with real-time sales forecasting models helping retailers optimize stock levels and reduce out-of-stock situations, thereby improving operational efficiency and customer service. Customer churn prediction techniques, powered by statistical modeling and data mining, allow businesses to proactively identify at-risk customers and implement retention strategies, reducing the negative impact of customer attrition on revenue.
Machine learning for pricing optimization and deep learning for fraud detection are essential tools for e-commerce businesses, helping to maximize profits and minimize losses, respectively. A/B testing for conversion rate optimization and advanced regression techniques for customer behavior analysis provide valuable insights into user behavior and preferences, enabling data-driven decision-making. Time series analysis for demand forecasting and cloud-based predictive analytics platforms offer scalable solutions for businesses seeking to analyze large volumes of data in real-time. API integration for real-time data and data visualization tools enable businesses to gain actionable insights from their data, facilitating informed business decisions. Web scraping for competitor analysis and data cleaning techniques are essential for maintaining a competitive edge in the e-commerce landscape. Feature engineering for predictive models and model deployment strategies ensure that businesses can effectively implement and utilize their predictive analytics solutions. Overall, the market represents a significant opportunity for businesses to gain a competitive edge through data-driven insights and intelligence. For instance, a study shows that businesses using predictive analytics experience a 10-15% increase in operational planning efficiency compared to those without such tools.
What are the Key Data Covered in this E-Commerce Predictive Analytics Market Research and Growth Report?
-
What is the expected growth of the E-Commerce Predictive Analytics Market between 2025 and 2029?
-
USD 5.54 billion, at a CAGR of 28.3%
-
-
What segmentation does the market report cover?
-
The report is segmented by Deployment (Cloud-based and On-premises), Application (Demand forecasting, Customer segmentation and personalization, Price optimization, Recommendation systems, and Others), Type (Customer lifetime value (CLV) prediction, Inventory management, Marketing campaign optimization, Dynamic pricing, and Customer retention and satisfaction enhancement), and Geography (North America, Europe, APAC, Middle East and Africa, and South America)
-
-
Which regions are analyzed in the report?
-
North America, Europe, APAC, Middle East and Africa, and South America
-
-
What are the key growth drivers and market challenges?
-
Imperative for hyper-personalization to enhance customer experience, Navigating complex and evolving landscape of data privacy and regulation
-
-
Who are the major players in the E-Commerce Predictive Analytics Market?
-
Altair Engineering Inc., Alteryx Inc., Amazon Web Services Inc., B2Metric, Conjura Ltd., DataHawk, DataRobot Inc., Glassbox, Google LLC, International Business Machines Corp., Metrilo Ltd., Microsoft Corp., Mixpanel Inc., Pattern Inc., Polar, Revuze, Salesforce Inc., SAS Institute Inc., and Sitecore Holding II AS
-
We can help! Our analysts can customize this e-commerce predictive analytics market research report to meet your requirements.
 RIA -
RIA - 
