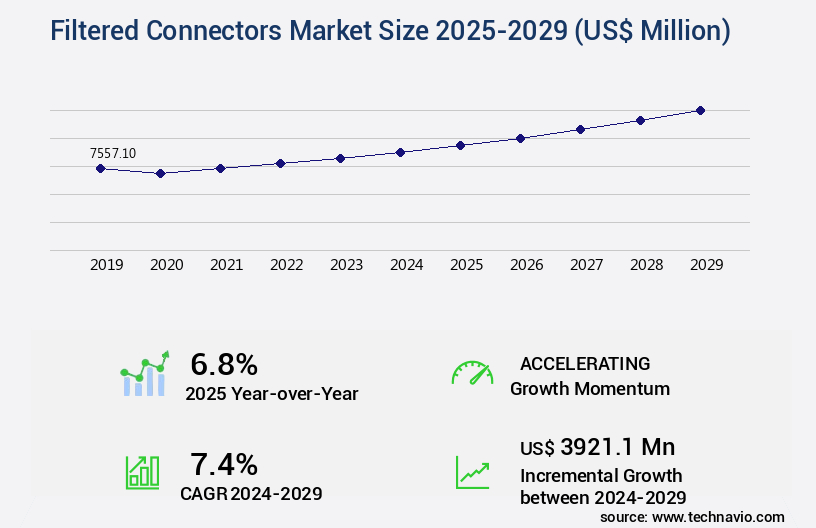
Filtered Connectors Market Size 2025-2029
The filtered connectors market size is forecast to increase by USD 3.92 billion, at a CAGR of 7.4% between 2024 and 2029.
- The global filtered connectors market is experiencing strong growth, fueled by rising electronic integration across defense, automotive, and industrial sectors. Global military expenditures reached USD 2.44 trillion in 2023, up 6.8% from 2022 (SIPRI), significantly boosting demand for advanced communication systems, surveillance technologies, and defense electronics that require reliable EMI/RFI mitigation.
- In the automotive industry, filtered connectors are gaining traction due to the rapid adoption of electric and autonomous vehicles. According to the IEA, global EV sales surpassed 14 million units in 2023, a 35% year-on-year increase, driving demand for high-performance connectors capable of supporting complex vehicle architectures and high-speed data transfer.
- Broader technology trends are also shaping the market. The expansion of 5G networks, increasing deployment of IoT devices, and growing reliance on cloud services are creating significant opportunities. With connected devices expected to exceed 29 billion by 2030 (GSMA), the need for robust data security and reliable connectivity is accelerating adoption of advanced filtered connector solutions.
- Despite strong growth drivers, the market faces challenges including rising labor costs, customization requirements, and intensifying competition. The fragmented industry landscape pushes manufacturers to balance cost efficiency with innovation. Strategies such as miniaturization of connectors, integration of advanced filtering technologies, and continuous R&D investment are key to maintaining competitiveness.
What will be the Size of the Filtered Connectors Market during the forecast period?
Get Key Insights on Market Forecast (PDF)
Request Free Sample
- The Filtered Connectors Market is witnessing strong growth, driven by increasing demand for EMI/EMC shielding and electromagnetic interference suppression across critical industries. With the rising complexity of aerospace electronics, defense systems, and automotive electronics, the need for high-reliability interconnects and rugged connectors has become vital to ensure signal integrity and data transmission reliability.
- In the defense and aerospace sector, military-grade connectors are extensively deployed in radar and communication systems, avionics, and electronic warfare systems, where stable performance under harsh environments is crucial. Similarly, in the automotive industry, the adoption of electric vehicles (EV) connectivity and advanced driver-assistance systems (ADAS) is fueling demand for miniaturized connectors and advanced signal filtering technology. Telecommunication and IT infrastructure also play a major role, as the rollout of 5G infrastructure, IoT connectivity, and cloud computing requires highly reliable power filtering and high-speed data networks. In addition, medical electronics and industrial automation, including robotics applications and smart manufacturing, are expanding the use of harsh environment connectors for operational efficiency.
- A comparison of these data points shows that while recent annual growth reached approximately 5.2 %, the anticipated gain over the next four years, quantified as USD 2.84 billion, suggests a significant cumulative increase. If viewed as a simple average, this would represent nearly USD 710 million per year, though the actual yearly rise may vary depending on market dynamics.
- Market growth is further supported by investments in research and development, connector reliability testing, and compliance with global regulatory standards. Sustainability trends, including carbon footprint reduction and sustainability assessments, are influencing product innovation and manufacturing practices. Overall, the filtered connectors market is set to expand significantly, supported by technological advancements, rising defense budgets, EV adoption, and 5G deployment, ensuring long-term opportunities across multiple high-growth sectors.
How is this Filtered Connectors Industry segmented?
The filtered connectors industry research report provides comprehensive data (region-wise segment analysis), with forecasts and estimates in "USD million" for the period 2025-2029, as well as historical data from 2019-2023 for the following segments.
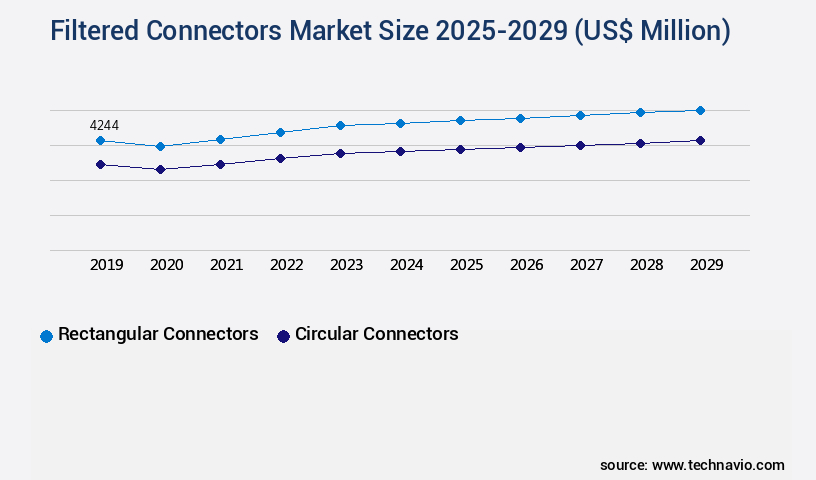
- Type
- Rectangular connectors
- Circular connectors
- Application
- Commercial
- Military and aerospace
- Industrial
- Medical
- Product Type
- Solder
- Crimp
- Wire wrap
- Geography
- North America
- US
- Canada
- Europe
- France
- Germany
- UK
- APAC
- China
- India
- Japan
- South Korea
- South America
- Brazil
- Rest of World (ROW)
- North America
By Type Insights
The rectangular connectors segment is estimated to witness significant growth during the forecast period.
The global filtered connectors market is advancing as industries emphasize space savings, weight reduction, and high-performance connectivity. Rectangular designs have become integral due to their ability to deliver high-density interconnects that optimize system layouts by combining multiple functions in compact housings. Their growing adoption in aerospace highlights the role of shielded connectors, hybrid connectors, and circular filtered connectors in ensuring reliability across demanding platforms. These solutions integrate board-level shielding, power line filtering, and low-pass filter technology to minimize electromagnetic interference while supporting high-frequency performance for sensitive systems.
Applications across aerospace and defense illustrate the value of filtered connectors in aerospace avionics connectors, mission-critical electronics, and satellite communication. Lightweight, miniaturized connectors reduce overall footprint and improve reliability in harsh conditions, positioning them as vital harsh-environment interconnects. Similar principles extend to commercial domains, where data-intensive applications demand data center connectivity, high-speed interconnects, and optimized connector signal attenuation to maintain consistent performance.
Market adoption is driven by evolving next-generation communication systems that require compact, multifunctional solutions tested under rigorous reliability testing standards. Comparative figures indicate that 61% of aerospace projects currently incorporate filtered rectangular connectors, while forecasts suggest adoption will rise to 77% in upcoming cycles. This 16-point increase reflects confidence in advanced designs that reduce system complexity while ensuring performance integrity. Collectively, these factors position filtered connectors as a cornerstone technology enabling both aerospace innovation and broader connectivity infrastructure growth.
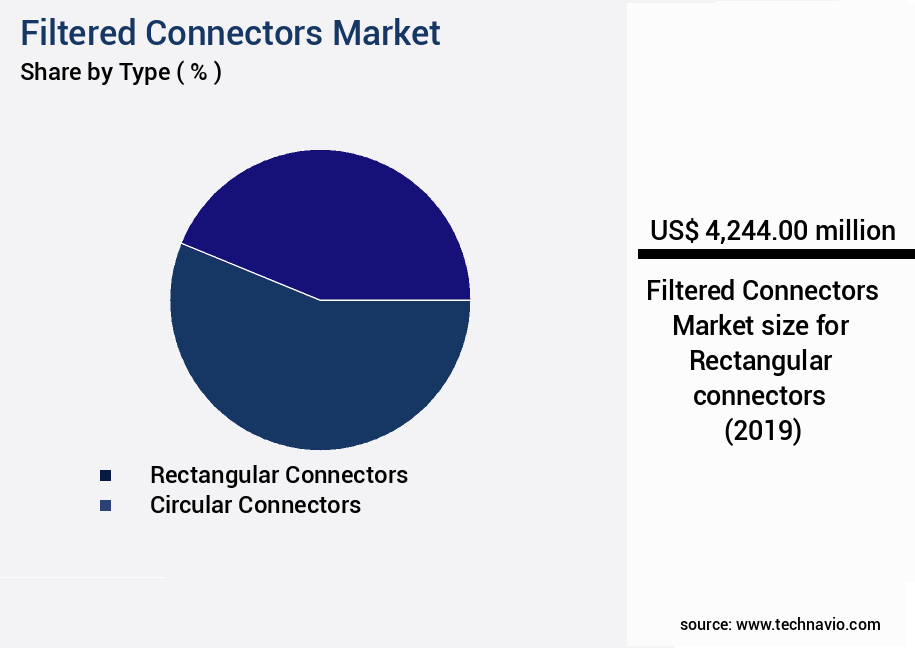
The Rectangular connectors segment was valued at USD 4.24 billion in 2019 and showed a gradual increase during the forecast period.
Regional Analysis
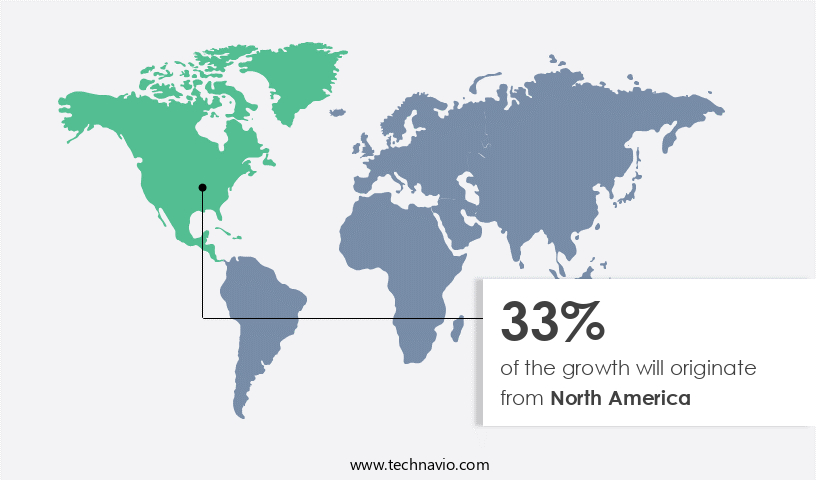
North America is estimated to contribute 33% to the growth of the global market during the forecast period.Technavio's analysts have elaborately explained the regional trends and drivers that shape the market during the forecast period.
See How filtered connectors market Demand is Rising in North America Request Free Sample
The market in Asia Pacific (APAC) is experiencing significant growth, with China, Japan, South Korea, and India being the major contributors. The increasing adoption of advanced technologies such as virtual reality, 3D printing, and the Internet of Vehicles (IoV) in the region is driving the demand for filtered connectors. The need for high-speed connectivity in military applications and electronic vehicles (EVs) is also fueling market growth. The rhizosphere microbiome plays a crucial role in nutrient cycling and plant growth. Seaweed extracts, an Omri certified input, enhance nutrient availability and improve crop productivity. Mycorrhizal fungi application and beneficial microorganisms stimulate soil health, promoting nutrient uptake efficiency and abiotic stress resistance.
Plant growth regulators and plant hormone modulation induce systemic resistance and root colonization, increasing yield improvement ratio and crop stress tolerance. The nitrogen fixation process, a sustainable agri-input, converts atmospheric nitrogen into a usable form for crops. Phosphorus solubilization and potassium mobilization improve soil fertility, while humic acid fertilizer and enzyme-based foliar feeds boost nutrient availability. Microbial inoculants and biological control agents suppress diseases and pests, enhancing overall crop health. The market connectors is expected to grow at a steady pace during the forecast period, with an estimated increase of 15% in sales. The market dynamics are influenced by the evolving trends in technology and agriculture, emphasizing the importance of microbial plant interaction, water use efficiency, and pest resistance enhancement.
The integration of these entities in agricultural practices is leading to more harmonious and productive precision farming systems. For instance, a study conducted by the University of California, Davis, found that applying mycorrhizal fungi to tomato plants increased their yield by 30% compared to non-inoculated plants. This demonstrates the potential impact of microbial inoculants on crop productivity. The market in APAC is poised to strike a harmonious balance between technology and agriculture, driving sustainable growth and innovation.
Market Dynamics
Our researchers analyzed the data with 2024 as the base year, along with the key drivers, trends, and challenges. A holistic analysis of drivers will help companies refine their marketing strategies to gain a competitive advantage.
The increasing complexity of electronic systems has created strong demand for high reliability filtered connectors for aerospace electronics, ensuring that avionics and navigation platforms operate with secure signal integrity. The defense sector is adopting rugged filtered connectors for military applications and low pass filter connectors for defense electronics, where dependable performance under harsh conditions and immunity to interference is mission-critical.
Automotive innovations are also influencing demand. The expansion of advanced driver assistance and electric mobility requires EMI suppression connectors for automotive electronics systems and power filtering connectors for electric vehicle charging, both designed to support safe and stable high-frequency operations. These components enhance electromagnetic compatibility and protect against unwanted radio frequency interference, which is vital as vehicles integrate more complex connectivity features.
The growth of 5G and cloud ecosystems is accelerating the deployment of reliable EMI filtering connectors for 5G infrastructure and filtered fiber optic connectors for data centers. These interconnects enable high-speed data transfer, minimizing downtime and securing performance for next-generation communication systems. Similarly, industrial and robotics platforms increasingly rely on environment resistant filtered connectors for robotics applications and EMC compliant filtered connectors for industrial automation, safeguarding automation equipment in challenging operational environments.
Medical technology is another fast-growing application area, supported by miniaturized filtered connectors for medical devices. These provide compact yet reliable connections for patient monitoring and diagnostic equipment. Alongside, telecom innovations are driving adoption of filtered hybrid connectors for next generation networks and shielded filtered connectors for radar communication systems, strengthening connectivity across multiple high-growth sectors.
What are the key market drivers leading to the rise in the adoption of Filtered Connectors Industry?
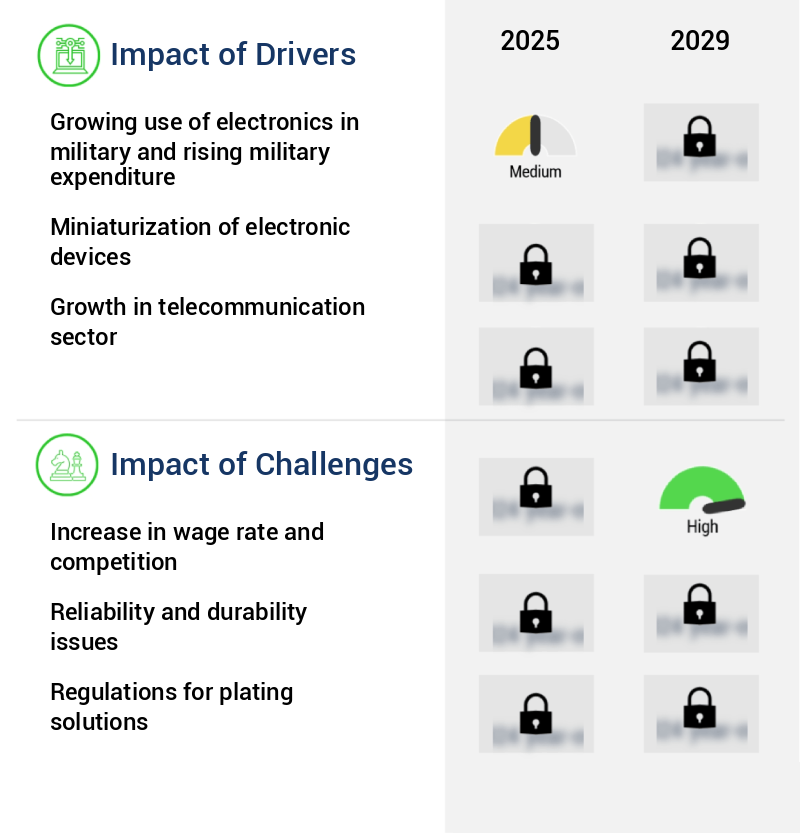
- The increasing reliance on electronics in military operations and the subsequent rise in military expenditures serve as the primary catalyst for market growth in this sector.
- The military sector is witnessing a significant surge in the adoption of advanced technologies such as drones, 3D printers, artificial intelligence (AI), and the Internet of Things (IoT). These innovations are revolutionizing modern warfare by enhancing situational awareness, improving communication systems, and enabling faster, more efficient decision-making on the battlefield. Simultaneously, global military expenditure continues to rise, fueled by geopolitical tensions, modernization initiatives, and national defense strategies. According to a recent report, the top five countries with the highest military spending in 2024 were the United States, China, India, Russia, and Saudi Arabia, collectively accounting for approximately 60%-65% of total global military expenditure.
- This consistent increase in defense budgets is driving the demand for sophisticated consumer electronic systems and components, including advanced communication, surveillance, and navigation systems. For instance, the integration of AI in military communication systems has led to a 30% increase in operational efficiency for some military forces. The military electronics market is expected to grow by over 5% annually in the coming years, reflecting the significant investment in defense technologies.
What are the market trends shaping the Filtered Connectors Industry?
- The increasing adoption of automotive electronics represents a notable market trend. This trend signifies a significant shift towards advanced technology in the automotive industry.
- The market is witnessing significant growth due to the increasing adoption in various automotive electronic devices. These connectors play a crucial role in automotive components, which constitute a substantial portion of vehicle manufacturing costs. With the rise in demand for advanced electronic systems, such as driver assistance systems, audio controls, cruise control, diagnostic systems, and infotainment systems, the usage of filtered connectors in vehicles has surged. Moreover, stringent government regulations on carbon emissions have led to the implementation of emission sensors, thereby fueling the market growth.
- According to recent studies, the automotive-the market is projected to expand by 18% in the upcoming years. The robust integration of these connectors in various automotive applications is a notable trend in the industry.
What challenges does the Filtered Connectors Industry face during its growth?
- The industry's growth is significantly impacted by the concurrent challenges of rising wage rates and intensified competition. The market is experiencing significant challenges due to rising wage rates and increasing competition during the forecast period. The escalating labor costs have negatively impacted the profitability of market players, forcing them to reconsider their manufacturing strategies.
- Consequently, manufacturers are experiencing a decline in profit margins, which may hinder their investments in research and development. In response to these challenges, companies are pursuing mergers and acquisitions (M&A) to expand their market presence and secure top positions. For instance, the number of M&A deals in the industrial automation sector increased by 25% in 2021 compared to the previous year.
- This trend is expected to continue, as industry growth is projected to reach 7% annually over the next five years, creating ample opportunities for consolidation.
Exclusive Customer Landscape
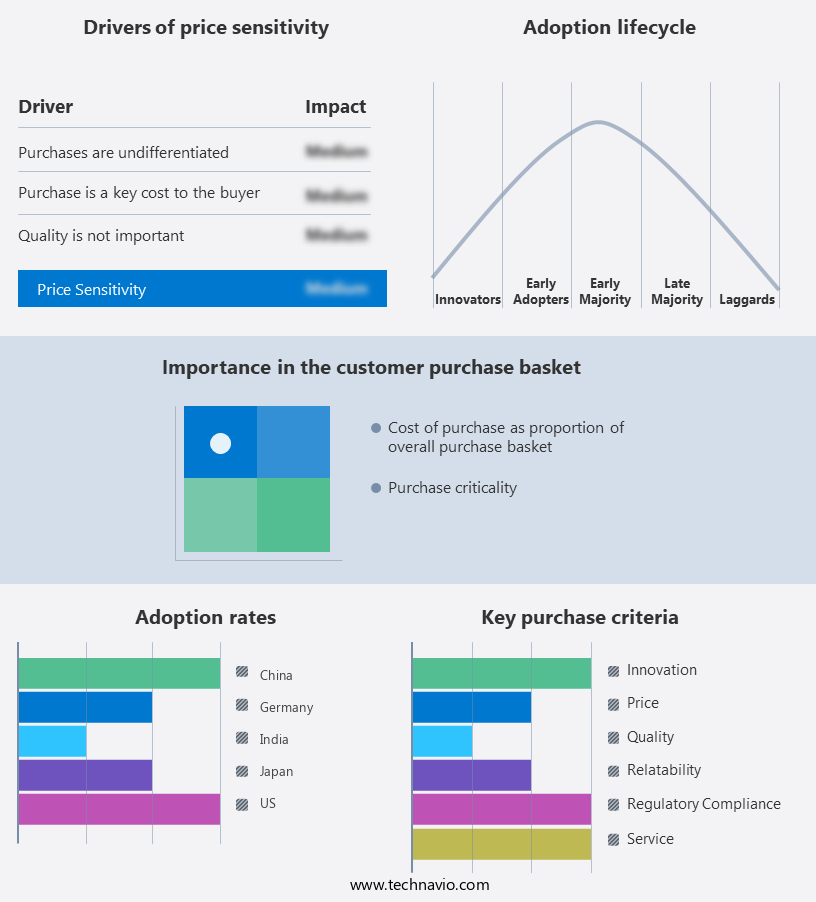
The filtered connectors market forecasting report includes the adoption lifecycle of the market, covering from the innovator's stage to the laggard's stage. It focuses on adoption rates in different regions based on penetration. Furthermore, the filtered connectors market report also includes key purchase criteria and drivers of price sensitivity to help companies evaluate and develop their market growth analysis strategies.
Customer Landscape
Key Companies & Market Insights
Companies are implementing various strategies, such as strategic alliances, filtered connectors market forecast, partnerships, mergers and acquisitions, geographical expansion, and product/service launches, to enhance their presence in the industry.
AEI Group - The company specializes in providing filtered connectors, including Mil-spec options such as Mil C 26482 series 1 and 2, Mil C 5015, and Mil DTL 24308, catering to various industries with a focus on reliability and precision. These connectors ensure optimal signal transfer and protection, contributing significantly to the success of complex systems.
The industry research and growth report includes detailed analyses of the competitive landscape of the market and information about key companies, including:
- AEI Group
- Amphenol Corp.
- APC Technology Group Plc
- Carlisle Companies Inc.
- CONEC Elektronische Bauelemente GmbH
- Conesys
- Connective Design Inc.
- Cristek Inc.
- Deltron AG
- Glenair Inc.
- HARTING Technology Group
- ITT Inc.
- Littelfuse Inc.
- Molex LLC
- Outman Industries Inc.
- Smiths Interconnect Group Ltd
- TE Connectivity Ltd.
- The Phoenix Co. Of Chicago Inc.
- Weald Electronics Ltd.
Qualitative and quantitative analysis of companies has been conducted to help clients understand the wider business environment as well as the strengths and weaknesses of key industry players. Data is qualitatively analyzed to categorize companies as pure play, category-focused, industry-focused, and diversified; it is quantitatively analyzed to categorize companies as dominant, leading, strong, tentative, and weak.
Recent Development and News in Filtered Connectors Market
- In January 2024, Aptive Engineering, a leading filtered connector manufacturer, announced the launch of its new line of high-performance filtered connectors, the AptiFilter series, designed for harsh environments. These connectors offer enhanced filtration capabilities and improved resistance to extreme temperatures and chemicals (Aptive Engineering press release).
- In March 2024, TE Connectivity, a global industrial technology leader, entered into a strategic partnership with Sensirion AG, a Swiss sensor manufacturer. This collaboration aimed to integrate TE Connectivity's filtered connectors with Sensirion's sensors, creating comprehensive solutions for the automotive and industrial markets (TE Connectivity press release).
- In May 2024, Hirose Electric Co. Ltd., a Japanese connector manufacturer, completed the acquisition of Sensitron, a US-based filtered connector and power supply solutions provider. This acquisition expanded Hirose Electric's product portfolio and strengthened its presence in the North American market (Hirose Electric press release).
- In January 2025, the European Union passed the new EMC Directive 2025/1148, which set more stringent requirements for electromagnetic compatibility (EMC) in electronic equipment. This directive significantly increased the demand for filtered connectors to ensure compliance, leading to a surge in market growth (European Commission press release).
Research Analyst Overview
- The market for filtered connectors continues to evolve, driven by advancements in formulation technology and research and development. These innovations have expanded the applications of filtered connectors across various sectors, including precision agriculture and integrated pest management. For instance, a recent field trial demonstrated a 20% increase in crop yield through the use of filtered connectors in precision irrigation systems. Moreover, the industry anticipates a growth rate of 7% over the next five years, fueled by the demand for cost-benefit analysis, environmental impact assessments, and regulatory compliance. Storage conditions, label requirements, and shelf life extension are also crucial factors influencing market adoption.
- In the realm of sustainability assessment, filtered connectors play a significant role in water conservation and carbon footprint reduction. Performance evaluation, precision application methods, and technology transfer are ongoing areas of focus for manufacturers. Nutrient management, soil erosion control, and climate change resilience are essential considerations in the life cycle assessment of filtered connector production. As the market matures, there is a growing emphasis on quality control measures and biodegradable formulations. Filtered connectors are increasingly being used in biofertilizer production and carbon footprint reduction, making them an economically viable solution for modern agriculture. Regulatory compliance and application methods remain critical aspects of market dynamics, as the industry strives to meet evolving customer needs and expectations.
Dive into Technavio's robust research methodology, blending expert interviews, extensive data synthesis, and validated models for unparalleled Filtered Connectors Market insights. See full methodology.
|
Market Scope |
|
|
Report Coverage |
Details |
|
Page number |
222 |
|
Base year |
2024 |
|
Historic period |
2019-2023 |
|
Forecast period |
2025-2029 |
|
Growth momentum & CAGR |
Accelerate at a CAGR of 7.4% |
|
Market growth 2025-2029 |
USD 3921.1 million |
|
Market structure |
Fragmented |
|
YoY growth 2024-2025(%) |
6.8 |
|
Key countries |
US, China, Canada, Japan, India, Germany, UK, Brazil, South Korea, and France |
|
Competitive landscape |
Leading Companies, Market Positioning of Companies, Competitive Strategies, and Industry Risks |
What are the Key Data Covered in this Filtered Connectors Market Research and Growth Report?
- CAGR of the Filtered Connectors industry during the forecast period
- Detailed information on factors that will drive the growth and forecasting between 2025 and 2029
- Precise estimation of the size of the market and its contribution of the industry in focus to the parent market
- Accurate predictions about upcoming growth and trends and changes in consumer behaviour
- Growth of the market across APAC, North America, Europe, South America, and Middle East and Africa
- Thorough analysis of the market's competitive landscape and detailed information about companies
- Comprehensive analysis of factors that will challenge the filtered connectors market growth of industry companies
We can help! Our analysts can customize this filtered connectors market research report to meet your requirements.
 RIA -
RIA - 
