
Gas Cutting Machine Market Analysis, Size, and Forecast 2026-2030: APAC (China, Japan, and India), Europe (Germany, UK, and France), North America (US, Canada, and Mexico), Middle East and Africa (Saudi Arabia, UAE, and South Africa), South America (Brazil, Argentina, and Chile), and Rest of World (ROW)

Gas Cutting Machine Market Analysis, Size, and Forecast 2026-2030:
APAC (China, Japan, and India), Europe (Germany, UK, and France), North America (US, Canada, and Mexico), Middle East and Africa (Saudi Arabia, UAE, and South Africa), South America (Brazil, Argentina, and Chile), and Rest of World (ROW)

Published: Oct 2026 298 Pages SKU: IRTNTR46475

Market Overview at a Glance

$173.9 Mn
Market Opportunity
3.5%
CAGR 2025 - 2030
57.9%
APAC Growth
$672.1 Mn
Stationary gas cutting machine segment 2024

Gas Cutting Machine Market Size 2026-2030

The gas cutting machine market size is valued to increase by USD 173.9 million, at a CAGR of 3.5% from 2025 to 2030. Rising infrastructure fabrication demand will drive the gas cutting machine market.

Major Market Trends & Insights

  • APAC dominated the market and accounted for a 57.9% growth during the forecast period.
  • By Product - Stationary gas cutting machine segment was valued at USD 672.1 million in 2024
  • By Application - Automotive segment accounted for the largest market revenue share in 2024

Market Size & Forecast

  • Market Opportunities: USD 306.3 million
  • Market Future Opportunities: USD 173.9 million
  • CAGR from 2025 to 2030 : 3.5%

Market Summary

  • The Gas Cutting Machine Market demonstrates resilient expansion driven by the critical necessity for thick steel processing across major industrial sectors. As manufacturing operations scale, the demand for precise metal separation technologies fundamentally shapes facility output and structural engineering capabilities.
  • In a practical supply chain scenario, heavy equipment manufacturers optimizing their fabrication pipelines utilize automated cutting systems to synchronize component preparation with downstream welding, reducing idle assembly time by 22% compared to manual processing methods. Rising infrastructure fabrication demand operates as the primary market driver, compelling contractors to acquire mechanized cutting platforms to process massive steel volumes efficiently.
  • Conversely, high capital expenditure and replacement cost pressures pose a substantial challenge, often forcing mid-sized fabrication shops to delay critical equipment upgrades and extend legacy asset lifecycles. Consequently, balancing upfront technological investment against long-term operational efficiency remains paramount. Facilities adopting intelligent cutting controls achieve superior material utilization, establishing a competitive advantage in demanding heavy engineering environments.

What will be the Size of the Gas Cutting Machine Market during the forecast period?
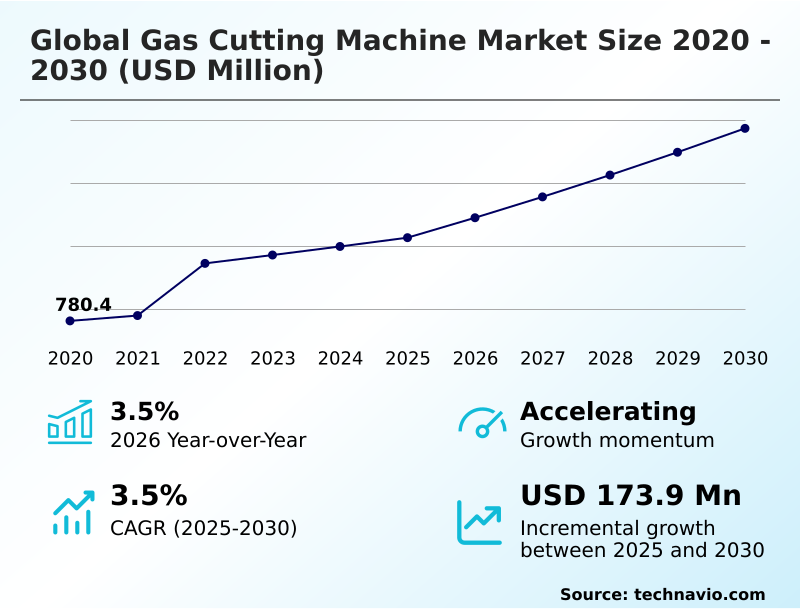
Get Key Insights on Market Forecast (PDF) Get Free Sample

How is the Gas Cutting Machine Market Segmented?

The gas cutting machine industry research report provides comprehensive data (region-wise segment analysis), with forecasts and estimates in "USD million" for the period 2026-2030, as well as historical data from 2020-2024 for the following segments.

  • Product
    • Stationary gas cutting machine
    • Portable gas cutting machine
  • Application
    • Automotive
    • Aerospace and defense
    • Industrial machinery and equipment
    • Shipbuilding
  • Technology
    • Semi-automatic
    • Manual
    • Automatic
  • Geography
    • APAC
      • China
      • Japan
      • India
      • South Korea
      • Australia
      • Indonesia
    • Europe
      • Germany
      • UK
      • France
      • Italy
      • Spain
      • The Netherlands
    • North America
      • US
      • Canada
      • Mexico
    • Middle East and Africa
      • Saudi Arabia
      • UAE
      • South Africa
      • Israel
      • Turkey
    • South America
      • Brazil
      • Argentina
      • Chile

By Product Insights

The stationary gas cutting machine segment is estimated to witness significant growth during the forecast period.

The stationary gas cutting machine segment handles demanding structural applications by executing a precise thermal cutting process on large-scale materials. Operating alongside a portable gas cutting system, these platforms drive efficiency in industrial machinery manufacturing and construction equipment fabrication.

Advanced oxy-fuel cutting technology paired with CNC automated cutting delivers high precision for aerospace tooling structures and rigorous shipbuilding plate preparation tasks. By eliminating manual inconsistencies, these systems support aggressive energy infrastructure development timelines.

Facilities implementing these synchronized cutting solutions typically observe material waste reductions of up to 14%. This specific capability significantly minimizes human intervention and accelerates output rates across heavy industrial sectors.

Consequently, leveraging optimal machinery configurations enhances operational margins, allowing fabrication businesses to maximize their capital assets while meeting stringent engineering tolerances.
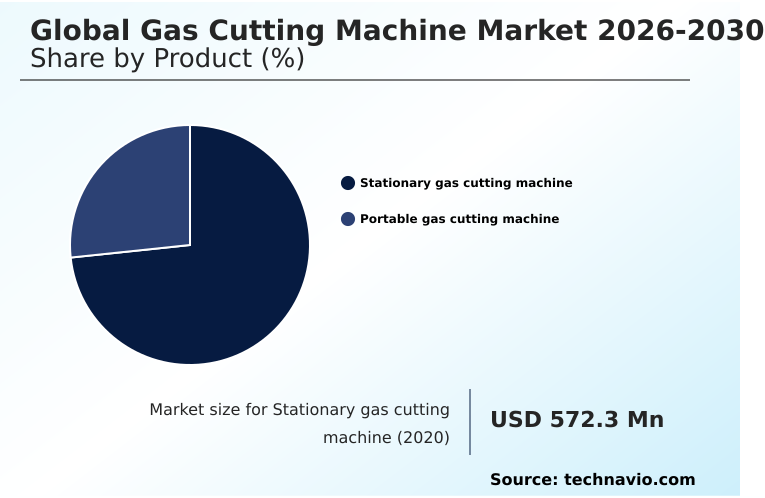
Get Free Sample

The Stationary gas cutting machine segment was valued at USD 672.1 million in 2024 and showed a gradual increase during the forecast period.
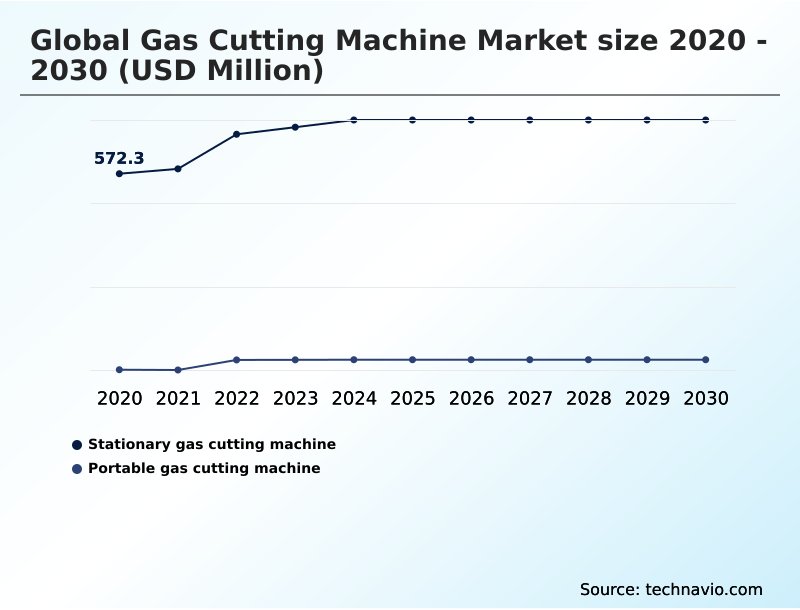
Get Free Sample

Regional Analysis

APAC is estimated to contribute 57.9% to the growth of the global market during the forecast period.Technavio’s analysts have elaborately explained the regional trends and drivers that shape the market during the forecast period.
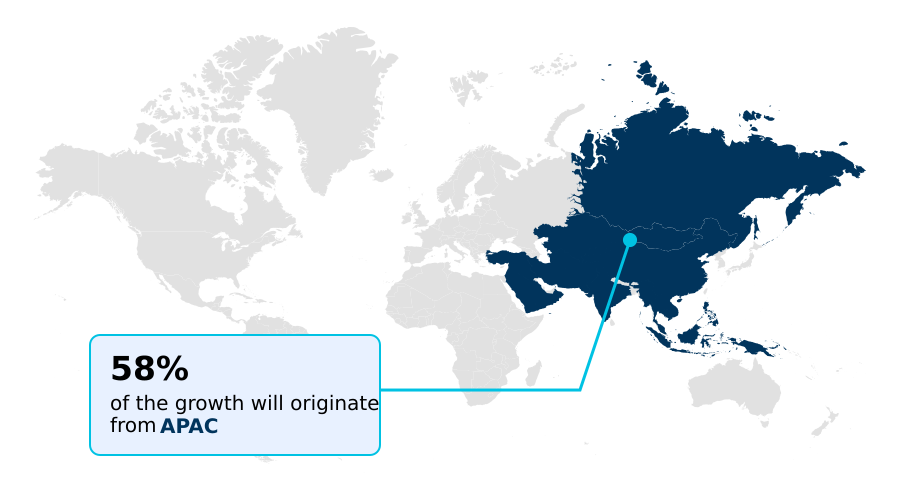
See How Gas Cutting Machine Market Demand is Rising in APAC Get Free Sample

APAC demonstrates rapid industrial scaling compared to Europe, largely driven by differing fabrication priorities and resource allocation.

Manufacturing hubs in APAC leverage extensive multi-part nesting application techniques within heavy engineering fabrication to achieve massive production scale, resulting in a 28% higher equipment penetration rate.

Conversely, Europe emphasizes data transparency, utilizing material traceability software and cutting speed enhancement to reduce operational waste by 15%.

In dynamic APAC markets, robust production workflow optimization drives the rapid adoption of digital job storage, which enhances coordination efficiency by 20% during critical infrastructure projects.

European operators, however, focus heavily on strict contour cutting precision to meet exacting aerospace and automotive standards. These regional disparities dictate distinct supply chain strategies, as APAC prioritizes volume throughput while Europe invests in highly controlled processing capabilities.

Market Dynamics

Our researchers analyzed the data with 2025 as the base year, along with the key drivers, trends, and challenges. A holistic analysis of drivers will help companies refine their marketing strategies to gain a competitive advantage.

  • Advanced metal processing facilities continuously optimize their operational frameworks to handle increasingly demanding structural requirements. At the core of these heavy industrial workflows is heavy carbon steel plate cutting, an essential capability that dictates the pace of downstream assembly.
  • By prioritizing CNC oxy-fuel cutting integration, fabrication managers bridge the gap between digital design schematics and physical execution on the factory floor. This connectivity allows manufacturers to achieve a 25% improvement in material utilization compared to traditional manual profiling, directly benefiting supply chain procurement by reducing raw material order volumes.
  • Furthermore, operations that execute thick metal removal thermal processing rely on specialized torch configurations to maintain edge integrity, eliminating subsequent machining stages. When maintaining massive infrastructure assets, maintenance crews depend heavily on portable gas cutting field repair to resolve localized structural failures without dismantling entire assemblies. This on-site flexibility minimizes costly operational halts and enhances asset longevity.
  • In centralized manufacturing environments, the shift toward automated multi-torch steel fabrication enables businesses to process multiple components simultaneously. This synchronized approach dramatically improves production scheduling reliability and ensures that critical project deadlines are met with consistent quality. Consequently, deploying these targeted cutting methodologies empowers industrial contractors to balance rigorous engineering specifications with efficient, cost-effective resource management.
  • As global supply chains face mounting pressures to deliver faster turnaround times, the capability to execute precise cuts on massive steel structures determines a manufacturer's competitive standing. By systematically upgrading their cutting infrastructure, businesses ensure sustained operational resilience and superior project execution across diverse heavy engineering disciplines.
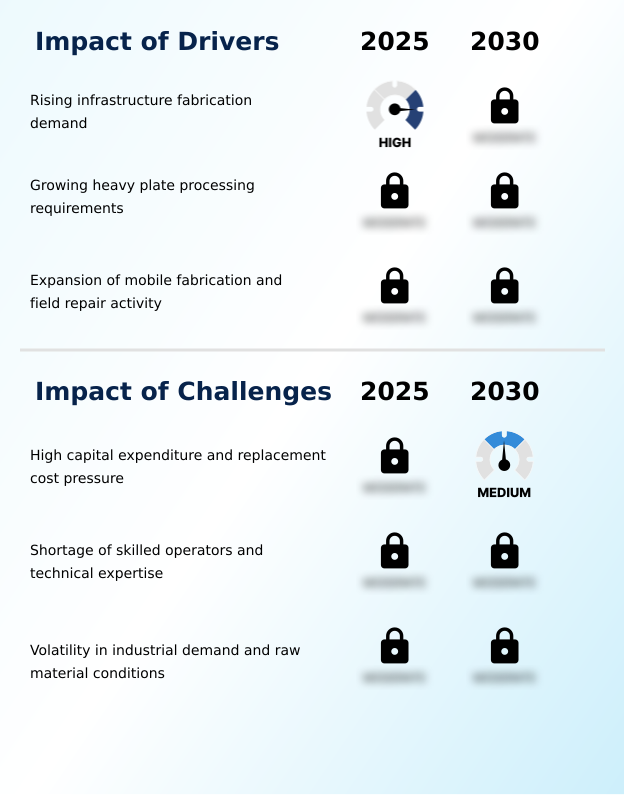
What are the key market drivers leading to the rise in the adoption of Gas Cutting Machine Industry?

  • Rising infrastructure fabrication demand serves as the primary driver propelling market expansion by increasing the need for robust steel processing capabilities.

  • Expanding requirements in thick carbon steel processing are actively accelerating the demand for advanced intelligent cutting solutions. As projects scale, businesses heavily rely on digital workflow connectivity and cloud-based cutting analytics to maintain absolute dimensional cutting consistency.
  • Facilities engaging in complex metalwork utilize a programmable cutting path to ensure rigorous operator safety compliance, resulting in a 20% reduction in workplace incidents.
  • This operational precision is further supported by robust flashback arrestor protection and seamless plasma cutting integration, which are paramount for ensuring structural integrity.
  • By deploying these modernized platforms for intensive industrial asset maintenance, operators report a 25% improvement in alternative fuel utilization efficiency. Such process enhancements directly alleviate bottlenecks, enabling contractors to execute complex projects with improved scheduling reliability.

What are the market trends shaping the Gas Cutting Machine Industry?

  • The increasing integration of digital workflows and connected cutting controls represents a significant upcoming trend within the market. This technological advancement enhances operational coordination and optimizes fabrication efficiency.

  • Transformative shifts in structural steel fabrication are fundamentally reshaping how metal processors manage their factory floors. Forward-looking facilities are rapidly adopting an equipment modernization program to elevate heavy plate processing efficiency across all operations. By integrating automated torch height control and a sophisticated multi-torch configuration, manufacturers have improved cycle time efficiency by 22% during any repetitive processing task.
  • Furthermore, the rising interest in oxy-hydrogen cutting contributes directly to high-volume production throughput while lowering operational emissions by 15% in early-adopter facilities. This equipment evolution also dramatically enhances mobile fabrication deployment capabilities, ensuring superior quality control during critical field repair operations.
  • Ultimately, targeted hardware upgrades combined with intelligent oversight enable businesses to align production scheduling with dynamic supply chain demands, creating a highly resilient manufacturing environment.

What challenges does the Gas Cutting Machine Industry face during its growth?

  • High capital expenditure and associated replacement cost pressures present significant challenges that currently constrain overall industry growth.

  • Escalating capital requirements and strict operational protocols create substantial constraints within the thermal metal separation sector. Integrating a mechanized cutting carriage into a centralized fabrication workshop demands significant upfront expenditure, often delaying deployment by 18% among mid-sized processors.
  • Furthermore, ensuring consistent bevel edge preparation while maintaining an advanced automatic ignition system requires rigorous operator training, indirectly increasing labor onboarding costs by 12%. During an intensive pipeline maintenance project or heavy equipment refurbishment, businesses frequently struggle to synchronize decentralized cutting requirement directives with reliable integrated gas regulation.
  • These friction points heavily disrupt automated sheet metal processing throughput, forcing facility management to carefully balance safety protocol enforcement against the urgent need for rapid component turnaround and optimal metal profile cutting workflow continuity.

Exclusive Technavio Analysis on Customer Landscape

The gas cutting machine market forecasting report includes the adoption lifecycle of the market, covering from the innovator’s stage to the laggard’s stage. It focuses on adoption rates in different regions based on penetration. Furthermore, the gas cutting machine market report also includes key purchase criteria and drivers of price sensitivity to help companies evaluate and develop their market growth analysis strategies.
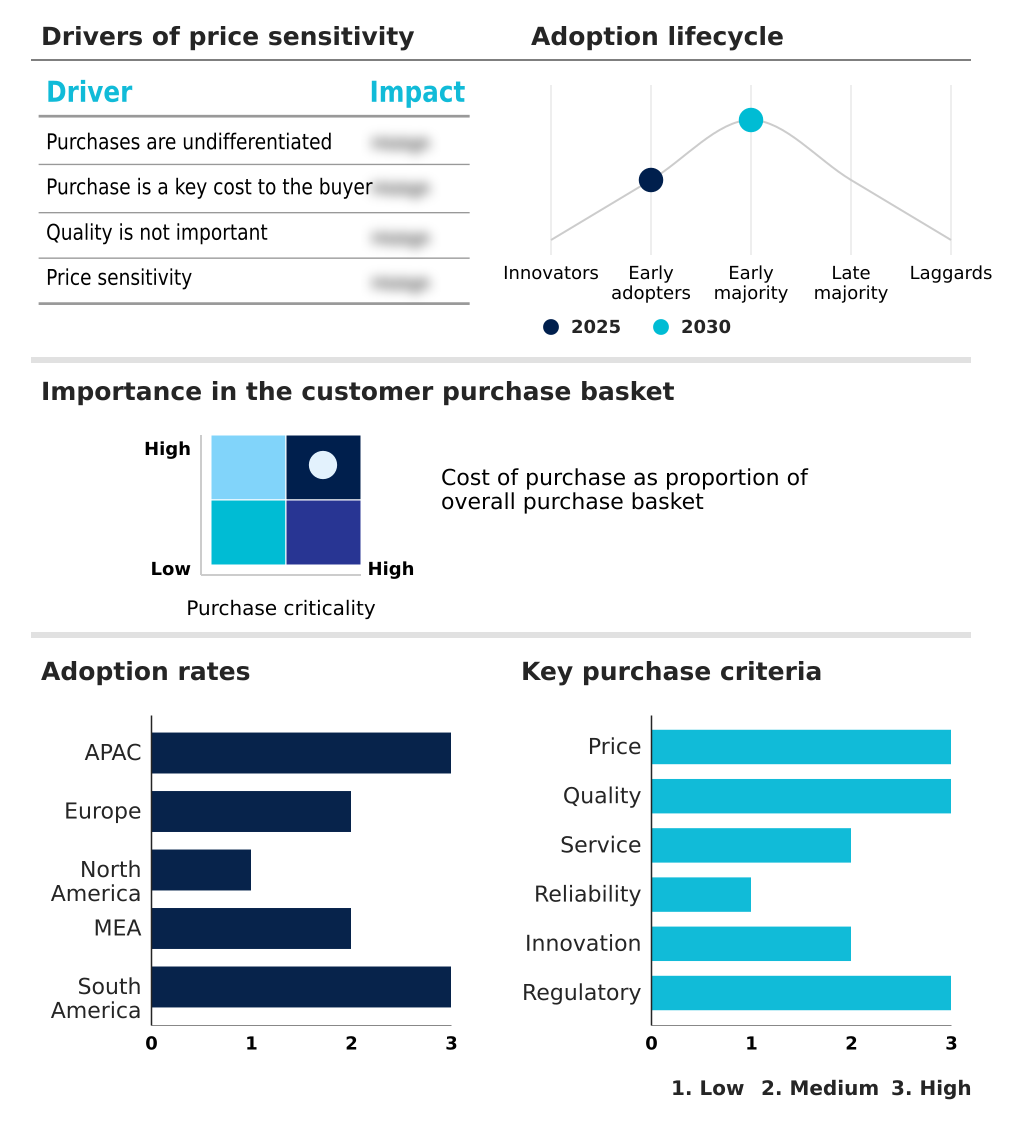
Customer Landscape of Gas Cutting Machine Industry

Competitive Landscape

Companies are implementing various strategies, such as strategic alliances, gas cutting machine market forecast, partnerships, mergers and acquisitions, geographical expansion, and product/service launches, to enhance their presence in the industry.

Ador Welding Ltd. - The vendor delivers advanced thermal cutting equipment, including precision oxy-fuel machines and automated flame cutting systems, designed to optimize heavy fabrication and industrial plate processing.

The industry research and growth report includes detailed analyses of the competitive landscape of the market and information about key companies, including:

  • Ador Welding Ltd.
  • AJAN ELEKTRONIK
  • ArcBro Inc.
  • China Weldcut Equipment Co. Ltd.
  • ESAB India Ltd.
  • Esprit Automation Ltd.
  • Ficep SpA
  • Hornet Cutting Systems
  • Kerf Developments
  • Koike Aronson Inc.
  • Messer Cutting Systems Inc.
  • MicroStep
  • Nissan Tanaka Corp.
  • Peddinghaus Corp.
  • Shanghai Hugong Electric Group
  • Soitaab Impianti S.p.A.
  • SteelTailor
  • Tayor
  • The Lincoln Electric Co.
  • Voortman Steel Machinery BV
  • ZINSER GmbH

Qualitative and quantitative analysis of companies has been conducted to help clients understand the wider business environment as well as the strengths and weaknesses of key industry players. Data is qualitatively analyzed to categorize companies as pure play, category-focused, industry-focused, and diversified; it is quantitatively analyzed to categorize companies as dominant, leading, strong, tentative, and weak.

Recent Development and News in Gas cutting machine market

  • In the Industrial Machinery and Supplies and Components industry, stringent workplace emission directives across the European Union have mandated the adoption of sophisticated ventilation controls, directly impacting Gas Cutting Machine demand by accelerating the replacement of legacy equipment with systems supporting alternative fuel utilization and integrated exhaust management by up to 25%.
  • The rapid expansion of offshore wind turbine manufacturing has created unprecedented requirements for massive structural steel fabrication, increasing the utilization of heavy plate processing technologies and driving a 30% surge in CNC automated cutting platform adoption to handle repetitive processing tasks.
  • Advancements in cloud-based cutting analytics and digital workflow connectivity have enabled a seamless integration between upstream engineering designs and downstream fabrication, reducing material waste by 15% and boosting the procurement of advanced oxy-fuel cutting technology equipped with programmable cutting paths.
  • Persistent labor shortages among skilled welders and machinists have forced fabrication facilities to prioritize production workflow optimization, resulting in an 18% increase in the deployment of automated torch height control and mechanized cutting carriage systems to ensure dimensional cutting consistency without constant manual oversight.

Dive into Technavio’s robust research methodology, blending expert interviews, extensive data synthesis, and validated models for unparalleled Gas Cutting Machine Market insights. See full methodology.

Market Scope
Page number 298
Base year 2025
Historic period 2020-2024
Forecast period 2026-2030
Growth momentum & CAGR Accelerate at a CAGR of 3.5%
Market growth 2026-2030 USD 173.9 million
Market structure Fragmented
YoY growth 2025-2026(%) 3.5%
Key countries China, Japan, India, South Korea, Australia, Indonesia, Germany, UK, France, Italy, Spain, The Netherlands, US, Canada, Mexico, Saudi Arabia, UAE, South Africa, Israel, Turkey, Brazil, Argentina and Chile
Competitive landscape Leading Companies, Market Positioning of Companies, Competitive Strategies, and Industry Risks

Request Free Sample

Research Analyst Overview

  • The Gas Cutting Machine ecosystem continues to evolve as manufacturers demand higher precision and efficiency in heavy metal processing. A defining trend is the rapid adoption of digital workflow connectivity, which fundamentally influences boardroom-level budgeting strategies by shifting capital allocation toward smart manufacturing assets rather than traditional manual tools.
  • Facilities implementing this connectivity alongside advanced material traceability software report a 30% reduction in processing time during complex structural steel fabrication projects. This technological shift relies heavily on integrated gas regulation and automatic ignition system configurations to minimize operator intervention and ensure consistent thermal output.
  • Furthermore, utilizing a sophisticated multi-torch configuration allows fabrication centers to process expansive plates simultaneously, directly improving project turnaround reliability. Ensuring robust flashback arrestor protection remains a critical compliance factor, mitigating operational risks during intensive cutting cycles.
  • By embedding these capabilities into their production lines, industrial processors optimize their supply chain resilience and achieve superior bevel edge preparation, establishing a decisive operational advantage in highly competitive heavy engineering environments.

What are the Key Data Covered in this Gas Cutting Machine Market Research and Growth Report?

  • What is the expected growth of the Gas Cutting Machine Market between 2026 and 2030?

    • USD 173.9 million, at a CAGR of 3.5%

  • What segmentation does the market report cover?

    • The report is segmented by Product (Stationary gas cutting machine, and Portable gas cutting machine), Application (Automotive, Aerospace and defense, Industrial machinery and equipment, and Shipbuilding), Technology (Semi-automatic, Manual, and Automatic) and Geography (APAC, Europe, North America, Middle East and Africa, South America)

  • Which regions are analyzed in the report?

    • APAC, Europe, North America, Middle East and Africa and South America

  • What are the key growth drivers and market challenges?

    • Rising infrastructure fabrication demand, High capital expenditure and replacement cost pressure

  • Who are the major players in the Gas Cutting Machine Market?

    • Ador Welding Ltd., AJAN ELEKTRONIK, ArcBro Inc., China Weldcut Equipment Co. Ltd., ESAB India Ltd., Esprit Automation Ltd., Ficep SpA, Hornet Cutting Systems, Kerf Developments, Koike Aronson Inc., Messer Cutting Systems Inc., MicroStep, Nissan Tanaka Corp., Peddinghaus Corp., Shanghai Hugong Electric Group, Soitaab Impianti S.p.A., SteelTailor, Tayor, The Lincoln Electric Co., Voortman Steel Machinery BV and ZINSER GmbH

Market Research Insights

  • The Gas Cutting Machine Market operates at the intersection of heavy manufacturing and advanced production workflow optimization. Facilities engaged in shipbuilding plate preparation are rapidly adopting sophisticated systems to ensure absolute dimensional cutting consistency across massive structural components. Implementing these precise technologies has reduced post-cut grinding times by 18%, significantly lowering labor expenditures.
  • Furthermore, the integration of cloud-based cutting analytics enables managers to monitor equipment health in real-time, decreasing unplanned machine downtime by 24%. By enforcing strict operator safety compliance through modernized torch controls, fabrication businesses minimize incident rates while simultaneously achieving a 15% increase in production throughput. These strategic deployments directly elevate overall manufacturing efficiency and asset ROI.

We can help! Our analysts can customize this gas cutting machine market research report to meet your requirements.

Get in touch

1. Executive Summary

1.1 Market overview

Executive Summary - Chart on Market Overview
Executive Summary - Data Table on Market Overview
Executive Summary - Chart on Global Market Characteristics
Executive Summary - Chart on Market by Geography
Executive Summary - Chart on Market Segmentation by Product
Executive Summary - Chart on Market Segmentation by Application
Executive Summary - Chart on Market Segmentation by Technology
Executive Summary - Chart on Incremental Growth
Executive Summary - Data Table on Incremental Growth
Executive Summary - Chart on Company Market Positioning

2. Technavio Analysis

2.1 Analysis of price sensitivity, lifecycle, customer purchase basket, adoption rates, and purchase criteria

2.2 Criticality of inputs and Factors of differentiation

Chart on Overview on criticality of inputs and factors of differentiation

2.3 Factors of disruption

Chart on Overview on factors of disruption

2.4 Impact of drivers and challenges

Chart on Impact of drivers and challenges in 2025 and 2030

3. Market Landscape

3.1 Market ecosystem

Chart on Parent Market
Data Table on - Parent Market

3.2 Market characteristics

Chart on Market characteristics analysis

3.3 Value chain analysis

Chart on Value chain analysis

4. Market Sizing

4.1 Market definition

Data Table on Offerings of companies included in the market definition

4.2 Market segment analysis

Market segments

4.3 Market size 2025

4.4 Market outlook: Forecast for 2025-2030

Chart on Global - Market size and forecast 2025-2030 ($ million)
Data Table on Global - Market size and forecast 2025-2030 ($ million)
Chart on Global Market: Year-over-year growth 2025-2030 (%)
Data Table on Global Market: Year-over-year growth 2025-2030 (%)

5. Historic Market Size

5.1 Global Gas Cutting Machine Market 2020 - 2024

Historic Market Size - Data Table on Global Gas Cutting Machine Market 2020 - 2024 ($ million)

5.2 Product segment analysis 2020 - 2024

Historic Market Size - Product Segment 2020 - 2024 ($ million)

5.3 Application segment analysis 2020 - 2024

Historic Market Size - Application Segment 2020 - 2024 ($ million)

5.4 Technology segment analysis 2020 - 2024

Historic Market Size - Technology Segment 2020 - 2024 ($ million)

5.5 Geography segment analysis 2020 - 2024

Historic Market Size - Geography Segment 2020 - 2024 ($ million)

5.6 Country segment analysis 2020 - 2024

Historic Market Size - Country Segment 2020 - 2024 ($ million)

6. Qualitative Analysis

6.1 Impact of AI on global gas cutting machine market

6.2 Impact of geopolitical conflicts on global gas cutting machine market

7. Five Forces Analysis

7.1 Five forces summary

Five forces analysis - Comparison between 2025 and 2030

7.2 Bargaining power of buyers

Bargaining power of buyers - Impact of key factors 2025 and 2030

7.3 Bargaining power of suppliers

Bargaining power of suppliers - Impact of key factors in 2025 and 2030

7.4 Threat of new entrants

Threat of new entrants - Impact of key factors in 2025 and 2030

7.5 Threat of substitutes

Threat of substitutes - Impact of key factors in 2025 and 2030

7.6 Threat of rivalry

Threat of rivalry - Impact of key factors in 2025 and 2030

7.7 Market condition

Chart on Market condition - Five forces 2025 and 2030

8. Market Segmentation by Product

8.1 Market segments

Chart on Product - Market share 2025-2030 (%)
Data Table on Product - Market share 2025-2030 (%)

8.2 Comparison by Product

Chart on Comparison by Product
Data Table on Comparison by Product

8.3 Stationary gas cutting machine - Market size and forecast 2025-2030

Chart on Stationary gas cutting machine - Market size and forecast 2025-2030 ($ million)
Data Table on Stationary gas cutting machine - Market size and forecast 2025-2030 ($ million)
Chart on Stationary gas cutting machine - Year-over-year growth 2025-2030 (%)
Data Table on Stationary gas cutting machine - Year-over-year growth 2025-2030 (%)

8.4 Portable gas cutting machine - Market size and forecast 2025-2030

Chart on Portable gas cutting machine - Market size and forecast 2025-2030 ($ million)
Data Table on Portable gas cutting machine - Market size and forecast 2025-2030 ($ million)
Chart on Portable gas cutting machine - Year-over-year growth 2025-2030 (%)
Data Table on Portable gas cutting machine - Year-over-year growth 2025-2030 (%)

8.5 Market opportunity by Product

Market opportunity by Product ($ million)
Data Table on Market opportunity by Product ($ million)

9. Market Segmentation by Application

9.1 Market segments

Chart on Application - Market share 2025-2030 (%)
Data Table on Application - Market share 2025-2030 (%)

9.2 Comparison by Application

Chart on Comparison by Application
Data Table on Comparison by Application

9.3 Automotive - Market size and forecast 2025-2030

Chart on Automotive - Market size and forecast 2025-2030 ($ million)
Data Table on Automotive - Market size and forecast 2025-2030 ($ million)
Chart on Automotive - Year-over-year growth 2025-2030 (%)
Data Table on Automotive - Year-over-year growth 2025-2030 (%)

9.4 Aerospace and defense - Market size and forecast 2025-2030

Chart on Aerospace and defense - Market size and forecast 2025-2030 ($ million)
Data Table on Aerospace and defense - Market size and forecast 2025-2030 ($ million)
Chart on Aerospace and defense - Year-over-year growth 2025-2030 (%)
Data Table on Aerospace and defense - Year-over-year growth 2025-2030 (%)

9.5 Industrial machinery and equipment - Market size and forecast 2025-2030

Chart on Industrial machinery and equipment - Market size and forecast 2025-2030 ($ million)
Data Table on Industrial machinery and equipment - Market size and forecast 2025-2030 ($ million)
Chart on Industrial machinery and equipment - Year-over-year growth 2025-2030 (%)
Data Table on Industrial machinery and equipment - Year-over-year growth 2025-2030 (%)

9.6 Shipbuilding - Market size and forecast 2025-2030

Chart on Shipbuilding - Market size and forecast 2025-2030 ($ million)
Data Table on Shipbuilding - Market size and forecast 2025-2030 ($ million)
Chart on Shipbuilding - Year-over-year growth 2025-2030 (%)
Data Table on Shipbuilding - Year-over-year growth 2025-2030 (%)

9.7 Market opportunity by Application

Market opportunity by Application ($ million)
Data Table on Market opportunity by Application ($ million)

10. Market Segmentation by Technology

10.1 Market segments

Chart on Technology - Market share 2025-2030 (%)
Data Table on Technology - Market share 2025-2030 (%)

10.2 Comparison by Technology

Chart on Comparison by Technology
Data Table on Comparison by Technology

10.3 Semi-automatic - Market size and forecast 2025-2030

Chart on Semi-automatic - Market size and forecast 2025-2030 ($ million)
Data Table on Semi-automatic - Market size and forecast 2025-2030 ($ million)
Chart on Semi-automatic - Year-over-year growth 2025-2030 (%)
Data Table on Semi-automatic - Year-over-year growth 2025-2030 (%)

10.4 Manual - Market size and forecast 2025-2030

Chart on Manual - Market size and forecast 2025-2030 ($ million)
Data Table on Manual - Market size and forecast 2025-2030 ($ million)
Chart on Manual - Year-over-year growth 2025-2030 (%)
Data Table on Manual - Year-over-year growth 2025-2030 (%)

10.5 Automatic - Market size and forecast 2025-2030

Chart on Automatic - Market size and forecast 2025-2030 ($ million)
Data Table on Automatic - Market size and forecast 2025-2030 ($ million)
Chart on Automatic - Year-over-year growth 2025-2030 (%)
Data Table on Automatic - Year-over-year growth 2025-2030 (%)

10.6 Market opportunity by Technology

Market opportunity by Technology ($ million)
Data Table on Market opportunity by Technology ($ million)

11. Customer Landscape

11.1 Customer landscape overview

Analysis of price sensitivity, lifecycle, customer purchase basket, adoption rates, and purchase criteria

12. Geographic Landscape

12.1 Geographic segmentation

Chart on Market share by geography 2025-2030 (%)
Data Table on Market share by geography 2025-2030 (%)

12.2 Geographic comparison

Chart on Geographic comparison
Data Table on Geographic comparison

12.3 APAC - Market size and forecast 2025-2030

Chart on APAC - Market size and forecast 2025-2030 ($ million)
Data Table on APAC - Market size and forecast 2025-2030 ($ million)
Chart on APAC - Year-over-year growth 2025-2030 (%)
Data Table on APAC - Year-over-year growth 2025-2030 (%)
Chart on Regional Comparison - APAC
Data Table on Regional Comparison - APAC

12.3.1 China - Market size and forecast 2025-2030

Chart on China - Market size and forecast 2025-2030 ($ million)
Data Table on China - Market size and forecast 2025-2030 ($ million)
Chart on China - Year-over-year growth 2025-2030 (%)
Data Table on China - Year-over-year growth 2025-2030 (%)

12.3.2 Japan - Market size and forecast 2025-2030

Chart on Japan - Market size and forecast 2025-2030 ($ million)
Data Table on Japan - Market size and forecast 2025-2030 ($ million)
Chart on Japan - Year-over-year growth 2025-2030 (%)
Data Table on Japan - Year-over-year growth 2025-2030 (%)

12.3.3 India - Market size and forecast 2025-2030

Chart on India - Market size and forecast 2025-2030 ($ million)
Data Table on India - Market size and forecast 2025-2030 ($ million)
Chart on India - Year-over-year growth 2025-2030 (%)
Data Table on India - Year-over-year growth 2025-2030 (%)

12.3.4 South Korea - Market size and forecast 2025-2030

Chart on South Korea - Market size and forecast 2025-2030 ($ million)
Data Table on South Korea - Market size and forecast 2025-2030 ($ million)
Chart on South Korea - Year-over-year growth 2025-2030 (%)
Data Table on South Korea - Year-over-year growth 2025-2030 (%)

12.3.5 Australia - Market size and forecast 2025-2030

Chart on Australia - Market size and forecast 2025-2030 ($ million)
Data Table on Australia - Market size and forecast 2025-2030 ($ million)
Chart on Australia - Year-over-year growth 2025-2030 (%)
Data Table on Australia - Year-over-year growth 2025-2030 (%)

12.3.6 Indonesia - Market size and forecast 2025-2030

Chart on Indonesia - Market size and forecast 2025-2030 ($ million)
Data Table on Indonesia - Market size and forecast 2025-2030 ($ million)
Chart on Indonesia - Year-over-year growth 2025-2030 (%)
Data Table on Indonesia - Year-over-year growth 2025-2030 (%)

12.4 Europe - Market size and forecast 2025-2030

Chart on Europe - Market size and forecast 2025-2030 ($ million)
Data Table on Europe - Market size and forecast 2025-2030 ($ million)
Chart on Europe - Year-over-year growth 2025-2030 (%)
Data Table on Europe - Year-over-year growth 2025-2030 (%)
Chart on Regional Comparison - Europe
Data Table on Regional Comparison - Europe

12.4.1 Germany - Market size and forecast 2025-2030

Chart on Germany - Market size and forecast 2025-2030 ($ million)
Data Table on Germany - Market size and forecast 2025-2030 ($ million)
Chart on Germany - Year-over-year growth 2025-2030 (%)
Data Table on Germany - Year-over-year growth 2025-2030 (%)

12.4.2 UK - Market size and forecast 2025-2030

Chart on UK - Market size and forecast 2025-2030 ($ million)
Data Table on UK - Market size and forecast 2025-2030 ($ million)
Chart on UK - Year-over-year growth 2025-2030 (%)
Data Table on UK - Year-over-year growth 2025-2030 (%)

12.4.3 France - Market size and forecast 2025-2030

Chart on France - Market size and forecast 2025-2030 ($ million)
Data Table on France - Market size and forecast 2025-2030 ($ million)
Chart on France - Year-over-year growth 2025-2030 (%)
Data Table on France - Year-over-year growth 2025-2030 (%)

12.4.4 Italy - Market size and forecast 2025-2030

Chart on Italy - Market size and forecast 2025-2030 ($ million)
Data Table on Italy - Market size and forecast 2025-2030 ($ million)
Chart on Italy - Year-over-year growth 2025-2030 (%)
Data Table on Italy - Year-over-year growth 2025-2030 (%)

12.4.5 Spain - Market size and forecast 2025-2030

Chart on Spain - Market size and forecast 2025-2030 ($ million)
Data Table on Spain - Market size and forecast 2025-2030 ($ million)
Chart on Spain - Year-over-year growth 2025-2030 (%)
Data Table on Spain - Year-over-year growth 2025-2030 (%)

12.4.6 The Netherlands - Market size and forecast 2025-2030

Chart on The Netherlands - Market size and forecast 2025-2030 ($ million)
Data Table on The Netherlands - Market size and forecast 2025-2030 ($ million)
Chart on The Netherlands - Year-over-year growth 2025-2030 (%)
Data Table on The Netherlands - Year-over-year growth 2025-2030 (%)

12.5 North America - Market size and forecast 2025-2030

Chart on North America - Market size and forecast 2025-2030 ($ million)
Data Table on North America - Market size and forecast 2025-2030 ($ million)
Chart on North America - Year-over-year growth 2025-2030 (%)
Data Table on North America - Year-over-year growth 2025-2030 (%)
Chart on Regional Comparison - North America
Data Table on Regional Comparison - North America

12.5.1 US - Market size and forecast 2025-2030

Chart on US - Market size and forecast 2025-2030 ($ million)
Data Table on US - Market size and forecast 2025-2030 ($ million)
Chart on US - Year-over-year growth 2025-2030 (%)
Data Table on US - Year-over-year growth 2025-2030 (%)

12.5.2 Canada - Market size and forecast 2025-2030

Chart on Canada - Market size and forecast 2025-2030 ($ million)
Data Table on Canada - Market size and forecast 2025-2030 ($ million)
Chart on Canada - Year-over-year growth 2025-2030 (%)
Data Table on Canada - Year-over-year growth 2025-2030 (%)

12.5.3 Mexico - Market size and forecast 2025-2030

Chart on Mexico - Market size and forecast 2025-2030 ($ million)
Data Table on Mexico - Market size and forecast 2025-2030 ($ million)
Chart on Mexico - Year-over-year growth 2025-2030 (%)
Data Table on Mexico - Year-over-year growth 2025-2030 (%)

12.6 Middle East and Africa - Market size and forecast 2025-2030

Chart on Middle East and Africa - Market size and forecast 2025-2030 ($ million)
Data Table on Middle East and Africa - Market size and forecast 2025-2030 ($ million)
Chart on Middle East and Africa - Year-over-year growth 2025-2030 (%)
Data Table on Middle East and Africa - Year-over-year growth 2025-2030 (%)
Chart on Regional Comparison - Middle East and Africa
Data Table on Regional Comparison - Middle East and Africa

12.6.1 Saudi Arabia - Market size and forecast 2025-2030

Chart on Saudi Arabia - Market size and forecast 2025-2030 ($ million)
Data Table on Saudi Arabia - Market size and forecast 2025-2030 ($ million)
Chart on Saudi Arabia - Year-over-year growth 2025-2030 (%)
Data Table on Saudi Arabia - Year-over-year growth 2025-2030 (%)

12.6.2 UAE - Market size and forecast 2025-2030

Chart on UAE - Market size and forecast 2025-2030 ($ million)
Data Table on UAE - Market size and forecast 2025-2030 ($ million)
Chart on UAE - Year-over-year growth 2025-2030 (%)
Data Table on UAE - Year-over-year growth 2025-2030 (%)

12.6.3 South Africa - Market size and forecast 2025-2030

Chart on South Africa - Market size and forecast 2025-2030 ($ million)
Data Table on South Africa - Market size and forecast 2025-2030 ($ million)
Chart on South Africa - Year-over-year growth 2025-2030 (%)
Data Table on South Africa - Year-over-year growth 2025-2030 (%)

12.6.4 Israel - Market size and forecast 2025-2030

Chart on Israel - Market size and forecast 2025-2030 ($ million)
Data Table on Israel - Market size and forecast 2025-2030 ($ million)
Chart on Israel - Year-over-year growth 2025-2030 (%)
Data Table on Israel - Year-over-year growth 2025-2030 (%)

12.6.5 Turkey - Market size and forecast 2025-2030

Chart on Turkey - Market size and forecast 2025-2030 ($ million)
Data Table on Turkey - Market size and forecast 2025-2030 ($ million)
Chart on Turkey - Year-over-year growth 2025-2030 (%)
Data Table on Turkey - Year-over-year growth 2025-2030 (%)

12.7 South America - Market size and forecast 2025-2030

Chart on South America - Market size and forecast 2025-2030 ($ million)
Data Table on South America - Market size and forecast 2025-2030 ($ million)
Chart on South America - Year-over-year growth 2025-2030 (%)
Data Table on South America - Year-over-year growth 2025-2030 (%)
Chart on Regional Comparison - South America
Data Table on Regional Comparison - South America

12.7.1 Brazil - Market size and forecast 2025-2030

Chart on Brazil - Market size and forecast 2025-2030 ($ million)
Data Table on Brazil - Market size and forecast 2025-2030 ($ million)
Chart on Brazil - Year-over-year growth 2025-2030 (%)
Data Table on Brazil - Year-over-year growth 2025-2030 (%)

12.7.2 Argentina - Market size and forecast 2025-2030

Chart on Argentina - Market size and forecast 2025-2030 ($ million)
Data Table on Argentina - Market size and forecast 2025-2030 ($ million)
Chart on Argentina - Year-over-year growth 2025-2030 (%)
Data Table on Argentina - Year-over-year growth 2025-2030 (%)

12.7.3 Chile - Market size and forecast 2025-2030

Chart on Chile - Market size and forecast 2025-2030 ($ million)
Data Table on Chile - Market size and forecast 2025-2030 ($ million)
Chart on Chile - Year-over-year growth 2025-2030 (%)
Data Table on Chile - Year-over-year growth 2025-2030 (%)

12.8 Market opportunity by geography

Market opportunity by geography ($ million)
Data Tables on Market opportunity by geography ($ million)

13. Drivers, Challenges, and Opportunity

13.1 Market drivers

Rising infrastructure fabrication demand
Growing heavy plate processing requirements
Expansion of mobile fabrication and field repair activity

13.2 Market challenges

High capital expenditure and replacement cost pressure
Shortage of skilled operators and technical expertise
Volatility in industrial demand and raw material conditions

13.3 Impact of drivers and challenges

Impact of drivers and challenges in 2025 and 2030

13.4 Market opportunities

Increasing integration of digital workflow and connected cutting controls
Growing emphasis on integrated operator safety and equipment protection
Increasing adoption of environment-friendly gas cutting technology

14. Competitive Landscape

14.1 Overview

14.2

Overview on criticality of inputs and factors of differentiation

14.3 Landscape disruption

Overview on factors of disruption

14.4 Industry risks

Impact of key risks on business

15. Competitive Analysis

15.1 Companies profiled

Companies covered

15.2 Company ranking index

15.3 Market positioning of companies

Matrix on companies position and classification

15.4 Ador Welding Ltd.

Ador Welding Ltd. - Overview
Ador Welding Ltd. - Business segments
Ador Welding Ltd. - Key offerings
Ador Welding Ltd. - Segment focus
SWOT

15.5 ESAB India Ltd.

ESAB India Ltd. - Overview
ESAB India Ltd. - Product / Service
ESAB India Ltd. - Key offerings
SWOT

15.6 Ficep SpA

Ficep SpA - Overview
Ficep SpA - Product / Service
Ficep SpA - Key offerings
SWOT

15.7 Kerf Developments

Kerf Developments - Overview
Kerf Developments - Product / Service
Kerf Developments - Key offerings
SWOT

15.8 Messer Cutting Systems Inc.

Messer Cutting Systems Inc. - Overview
Messer Cutting Systems Inc. - Product / Service
Messer Cutting Systems Inc. - Key offerings
SWOT

15.9 MicroStep

MicroStep - Overview
MicroStep - Product / Service
MicroStep - Key offerings
SWOT

15.10 Nissan Tanaka Corp.

Nissan Tanaka Corp. - Overview
Nissan Tanaka Corp. - Product / Service
Nissan Tanaka Corp. - Key offerings
SWOT

15.11 Peddinghaus Corp.

Peddinghaus Corp. - Overview
Peddinghaus Corp. - Product / Service
Peddinghaus Corp. - Key offerings
SWOT

15.12 Shanghai Hugong Electric Group

Shanghai Hugong Electric Group - Overview
Shanghai Hugong Electric Group - Product / Service
Shanghai Hugong Electric Group - Key offerings
SWOT

15.13 Soitaab Impianti S.p.A.

Soitaab Impianti S.p.A. - Overview
Soitaab Impianti S.p.A. - Product / Service
Soitaab Impianti S.p.A. - Key offerings
SWOT

15.14 SteelTailor

SteelTailor - Overview
SteelTailor - Product / Service
SteelTailor - Key offerings
SWOT

15.15 Tayor

Tayor - Overview
Tayor - Product / Service
Tayor - Key offerings
SWOT

15.16 The Lincoln Electric Co.

The Lincoln Electric Co. - Overview
The Lincoln Electric Co. - Business segments
The Lincoln Electric Co. - Key offerings
The Lincoln Electric Co. - Segment focus
SWOT

15.17 Voortman Steel Machinery BV

Voortman Steel Machinery BV - Overview
Voortman Steel Machinery BV - Product / Service
Voortman Steel Machinery BV - Key offerings
SWOT

15.18 ZINSER GmbH

ZINSER GmbH - Overview
ZINSER GmbH - Product / Service
ZINSER GmbH - Key offerings
SWOT

16. Appendix

16.1 Scope of the report

Market definition
Objectives
Notes and caveats

16.2 Inclusions and exclusions checklist

Inclusions checklist
Exclusions checklist

16.3 Currency conversion rates for US$

16.4 Research methodology

16.5 Data procurement

Information sources

16.6 Data validation

16.7 Validation techniques employed for market sizing

16.8 Data synthesis

16.9 360 degree market analysis

16.10 List of abbreviations

Research Methodology

Technavio presents a detailed picture of the market by way of study, synthesis, and summation of data from multiple sources. The analysts have presented the various facets of the market with a particular focus on identifying the key industry influencers. The data thus presented is comprehensive, reliable, and the result of extensive research, both primary and secondary.

INFORMATION SOURCES

Primary sources

  • Manufacturers and suppliers
  • Channel partners
  • Industry experts
  • Strategic decision makers

Secondary sources

  • Industry journals and periodicals
  • Government data
  • Financial reports of key industry players
  • Historical data
  • Press releases

DATA ANALYSIS

Data Synthesis

  • Collation of data
  • Estimation of key figures
  • Analysis of derived insights

Data Validation

  • Triangulation with data models
  • Reference against proprietary databases
  • Corroboration with industry experts

REPORT WRITING

Qualitative

  • Market drivers
  • Market challenges
  • Market trends
  • Five forces analysis

Quantitative

  • Market size and forecast
  • Market segmentation
  • Geographical insights
  • Competitive landscape

Interested in this report?

Get your sample now to see our research methodology and insights!

Download Now

Frequently Asked Questions

Gas Cutting Machine market growth will increase by USD 173.9 million during 2026-2030.

The Gas Cutting Machine market is expected to grow at a CAGR of 3.5% during 2026-2030.

Gas Cutting Machine market is segmented by Product (Stationary gas cutting machine, Portable gas cutting machine) Application (Automotive, Aerospace and defense, Industrial machinery and equipment, Shipbuilding) Technology (Semi-automatic, Manual, Automatic)

Ador Welding Ltd., AJAN ELEKTRONIK, ArcBro Inc., China Weldcut Equipment Co. Ltd., ESAB India Ltd., Esprit Automation Ltd., Ficep SpA, Hornet Cutting Systems, Kerf Developments, Koike Aronson Inc., Messer Cutting Systems Inc., MicroStep, Nissan Tanaka Corp., Peddinghaus Corp., Shanghai Hugong Electric Group, Soitaab Impianti S.p.A., SteelTailor, Tayor, The Lincoln Electric Co., Voortman Steel Machinery BV, ZINSER GmbH are a few of the key vendors in the Gas Cutting Machine market.

APAC will register the highest growth rate of 57.9% among the other regions. Therefore, the Gas Cutting Machine market in APAC is expected to garner significant business opportunities for the vendors during the forecast period.

China, Japan, India, South Korea, Australia, Indonesia, Germany, UK, France, Italy, Spain, The Netherlands, US, Canada, Mexico, Saudi Arabia, UAE, South Africa, Israel, Turkey, Brazil, Argentina, Chile

  • Rising infrastructure fabrication demand is the driving factor this market.

The Gas Cutting Machine market vendors should focus on grabbing business opportunities from the Product segment as it accounted for the largest market share in the base year.
RIA - Research AI Assistant
Ask RIA
