Generative AI In Agriculture Market Analysis, Size, and Forecast 2025-2029: North America (US and Canada), Europe (France, Germany, and UK), APAC (China, India, Japan, and South Korea), South America (Brazil), and Rest of World (ROW)

Generative AI In Agriculture Market Analysis, Size, and Forecast 2025-2029:
North America (US and Canada), Europe (France, Germany, and UK), APAC (China, India, Japan, and South Korea), South America (Brazil), and Rest of World (ROW)

Published: Aug 2025 240 Pages SKU: IRTNTR80850

Market Overview at a Glance

$1.18 B
Market Opportunity
29.3%
CAGR
25.0
YoY growth 2024-2025(%)

Generative AI In Agriculture Market Size 2025-2029

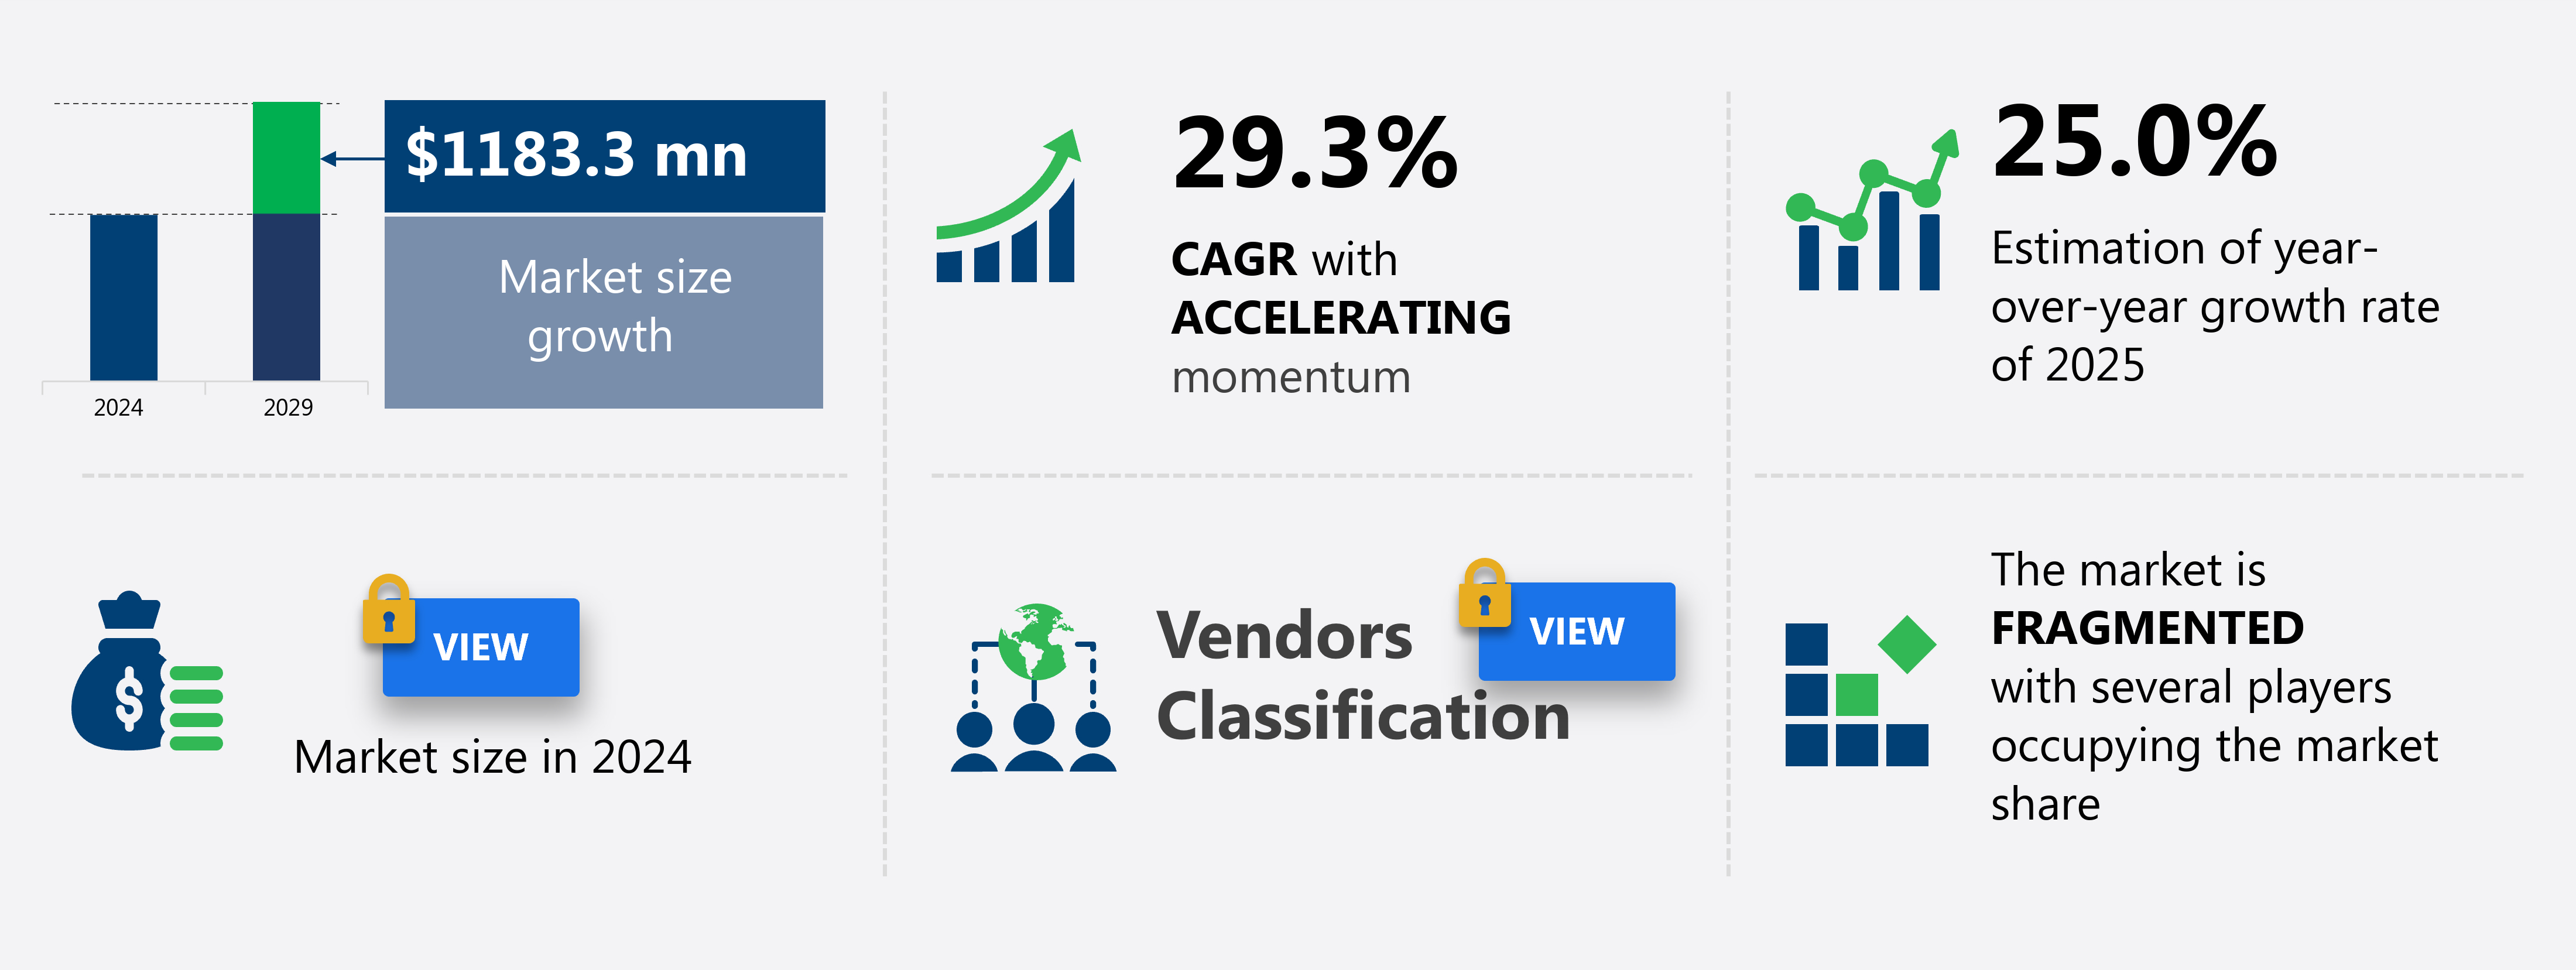
The generative AI in agriculture market size is forecast to increase by USD 1.18 billion, at a CAGR of 29.3% between 2024 and 2029.

  • The market is driven by the global imperative for enhanced agricultural productivity and sustainability. Farmers and agribusinesses seek advanced technologies to optimize crop yields, reduce waste, and improve resource management. One promising solution is generative AI, which uses machine learning algorithms to analyze vast amounts of data and generate insights for farmers. However, the implementation of generative AI in agriculture faces challenges. Farmers often lack access to sufficient and high-quality data to train AI models effectively. These are integrated with iot sensors agriculture, iot sensor network for farm monitoring, and sensor data integration for actionable insights.
  • Moreover, data must be contextualized to be useful, requiring advanced data processing and analysis capabilities. These challenges necessitate collaboration between farmers, technology providers, and data aggregators to build comprehensive and accurate datasets. Precision livestock farming and livestock disease prediction leverage AI for improved animal health and welfare, while pest control strategies and geospatial data analysis help minimize environmental impact. Data scarcity, quality, and contextualization are critical obstacles.

What will be the Size of the Generative AI In Agriculture Market during the forecast period?

Generative AI In Agriculture Market Size

Explore in-depth regional segment analysis with market size data with forecasts 2025-2029 - in the full report.   
Request Free Sample

  • The market for generative AI in agriculture continues to evolve, with various sectors adopting innovative technologies to enhance productivity and sustainability. Climate change adaptation and climate-smart agriculture are key areas of focus, with soil moisture monitoring and image processing techniques enabling farmers to optimize irrigation and crop growth. Companies that address these challenges by providing hyper-personalized generative agronomist solutions will capitalize on the growing demand for AI in agriculture, enabling farmers to make data-driven decisions and improve overall operational efficiency.
  • According to recent reports, the global agricultural AI market is projected to grow by over 20% annually, driven by the integration of sensor data, deep learning applications, and natural resource management solutions. For instance, a leading farm implemented AI-powered irrigation systems, resulting in a 15% increase in crop yield. Agricultural robotics and data fusion algorithms facilitate farm automation systems, optimizing fertilizer application and water resource management. Real-time data processing and big data management enable food safety traceability and smart livestock management.

How is this Generative AI In Agriculture Market segmented?

The generative AI in agriculture market research report provides comprehensive data (region-wise segment analysis), with forecasts and estimates in "USD million" for the period 2025-2029,for the following segments.
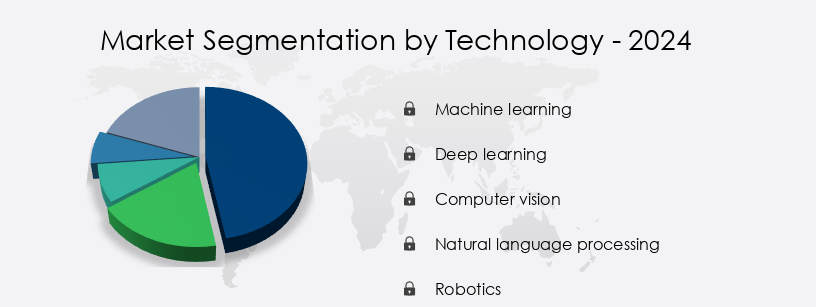
  • Technology
    • Machine learning
    • Deep learning
    • Computer vision
    • Natural language processing
    • Robotics
  • Application
    • Precision farming
    • Agricultural robotics and automation
    • Crop management
    • Livestock management
    • Soil analysis
  • Deployment
    • Cloud based
    • On premises
    • Hybrid
  • Geography
    • North America
      • US
      • Canada
    • Europe
      • France
      • Germany
      • UK
    • APAC
      • China
      • India
      • Japan
      • South Korea
    • South America
      • Brazil
    • Rest of World (ROW)

By Technology Insights

The Machine learning segment is estimated to witness significant growth during the forecast period. Machine learning, a core discipline of artificial intelligence, significantly contributes to the market. Traditional machine learning models have been utilized in agriculture for predictive analytics, such as forecasting crop yields based on historical weather and soil data, identifying nutrient deficiencies, and predicting market trends. However, generative machine learning takes this a step further by creating optimized farm management plans. By synthesizing vast and disparate datasets, including soil composition, hyperlocal weather forecasts, genomic data of crop varieties, and market demand signals, generative ML models generate comprehensive farm management plans from scratch.

The Generative AI in agriculture market is transforming modern farming by enabling intelligent, data-driven practices for efficiency and sustainability. Technologies like crop yield prediction, predictive modeling for crop yield, and crop modeling techniques allow farmers to anticipate production with precision. Tools such as drone-based monitoring and drone based remote sensing applications enhance crop growth monitoring and provide real-time field insights. Advanced farm management software and agricultural data analytics utilize data analytics for farm optimization and data driven decision making to optimize every stage of production. Remote sensing technology, combined with geospatial data analysis for precision, supports pest and disease management, nutrient deficiency detection, and crop water stress detection.

For instance, a study by the University of California, Davis, found that implementing precision irrigation based on real-time weather and soil data increased water savings by 30%. Furthermore, the market is expected to grow by 25% as agricultural organizations increasingly adopt these advanced technologies to optimize resources, enhance sustainability, and improve overall farm productivity.

Generative AI In Agriculture Market Share by Technology

Get Key Insights on Market Forecast (PDF)- Request Free Sample

Regional Analysis

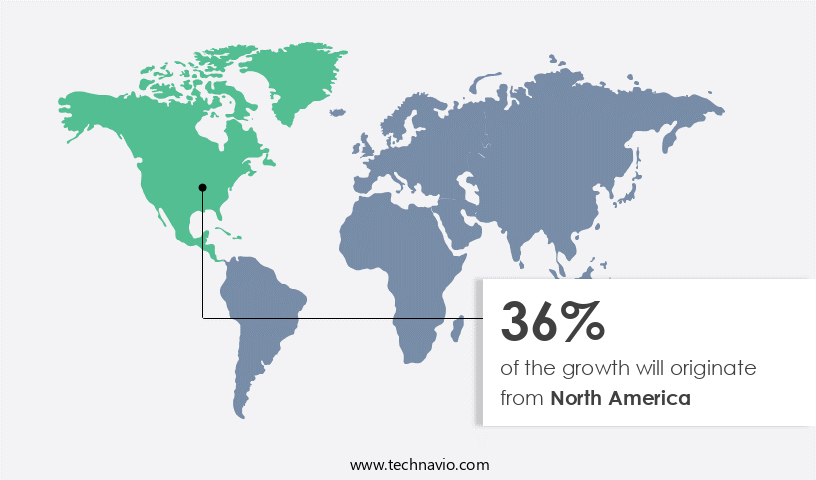
North America is estimated to contribute 36% to the growth of the global market during the forecast period. Technavio's analysts have elaborately explained the regional trends and drivers that shape the market during the forecast period.

Generative AI In Agriculture Market Share by Geography

 See How generative AI in agriculture market Demand is Rising in North America Request Free Sample

In North America, the agriculture sector, predominantly in the United States and Canada, leads the market for generative artificial intelligence (AI). This position is driven by the region's large-scale, capital-intensive farming operations, which are technologically advanced and open to innovation. The emphasis on operational efficiency, productivity, and data-driven decision-making creates an ideal environment for AI adoption. Key factors include persistent labor shortages, necessitating automation, and the long-standing use of precision agriculture technologies, such as GPS-guided machinery, IoT sensors, and drone monitoring. For instance, a leading agricultural cooperative in the US reported a 20% increase in crop yields after implementing AI-powered precision irrigation and nutrient management systems.

Generative AI enables AI-driven irrigation scheduling systems, real time crop stress monitoring, and computer vision weed detection system to support field-level automation. Innovations in robotic harvesting, smart greenhouse control, and vertical farming optimization, including vertical farming environmental control,l are optimizing indoor production systems. AI also enhances farm resource optimization, yield optimization strategies, and optimized fertilizer application via optimized fertilizer application strategies. Broader applications include agricultural supply chain efficiency and blockchain technology for food safety through agricultural blockchain technology. 

In livestock, livestock health monitoring, AI-powered livestock health monitoring, and feed efficiency improvement drive productivity. Generative AI supports environmental monitoring systems, sustainable agriculture practices using ai, and promotes agricultural sustainability and regenerative agriculture. Moreover, the global agricultural AI market is expected to grow by over 25% annually, fueled by advancements in areas like plant disease detection using computer vision systems, weed detection algorithms, and variable rate fertilization using predictive analytics. These technologies optimize resource usage, improve sustainability, and enhance overall farm productivity.

Market Dynamics

Our researchers analyzed the data with 2024 as the base year, along with the key drivers, trends, and challenges. A holistic analysis of drivers will help companies refine their marketing strategies to gain a competitive advantage. The market is experiencing rapid growth as farmers seek to optimize their operations and increase productivity using advanced technology. One of the most significant applications of AI in agriculture is in irrigation scheduling systems, which use predictive modeling based on weather data and soil moisture levels to ensure efficient water usage. Computer vision systems are also being used for weed detection, allowing farmers to apply herbicides precisely and reduce the use of chemicals. In addition, AI is being employed for predictive modeling of crop yield, utilizing drone-based remote sensing applications and IoT sensor networks for farm monitoring.

Machine learning algorithms are being used for disease detection, enabling farmers to take preventative measures before losses occur. Precision spraying using robotics and autonomous tractors for tillage operations are other areas where AI is making a significant impact. Geospatial data analysis is a crucial aspect of precision agriculture, and AI is being used to analyze this data for optimal fertilizer application strategies and soil health assessment using sensors. Crop growth modeling for yield prediction and remote sensing for drought detection are other applications of AI in agriculture. AI is also being used in livestock farming for health monitoring, ensuring the wellbeing of animals and improving food safety.

Blockchain technology is being integrated with AI to provide transparency and traceability in the food supply chain. Sustainable agriculture practices are being enhanced through the use of AI, with smart greenhouse climate control systems ensuring optimal growing conditions and reducing water and energy usage. Overall, the market is transforming the way farmers operate, increasing efficiency, productivity, and sustainability.

What are the key market drivers leading to the rise in the adoption of Generative AI In Agriculture Industry?

  • The global imperative for augmenting agricultural productivity and ensuring sustainability serves as the primary market catalyst. The global agriculture industry faces mounting pressure to enhance food production, with the Food and Agriculture Organization of the United Nations projecting a need to feed a projected nine billion population by 2050, despite challenges such as diminishing arable land, water scarcity, and climate change impacts on crop viability and yield stability. Traditional farming methods and even initial precision agriculture tools are no longer sufficient to address these complex and interconnected pressures.
  • According to a recent study, the implementation of AI in agriculture is projected to increase global crop yields by up to 20%, contributing significantly to industry growth. The market for generative AI in agriculture is expected to expand substantially, with industry analysts projecting a growth rate of over 25% annually. Generative artificial intelligence (AI) is emerging as a promising solution, offering more efficient and sustainable agricultural practices. For instance, generative AI can optimize irrigation and nutrient management, predict crop diseases, and even generate new crop varieties.

What are the market trends shaping the Generative AI In Agriculture Industry?

  • The rise of hyper-personalized generative agronomics is an emerging market trend. This approach to agriculture leverages advanced technology to tailor farming practices to individual farm conditions and crop needs. The agricultural sector is witnessing a significant shift towards generative AI systems, transforming traditional farm management. These advanced AI solutions go beyond generic analytical dashboards, acting as personalized, conversational agronomists for farmers.
  • This dynamic, interactive partnership fosters informed decision-making, resulting in a 15% average increase in crop yields for early adopters. The generative AI market in agriculture is expected to expand substantially, with industry experts projecting a 20% penetration rate within the next five years. By harnessing the power of state-of-the-art foundational models, these systems can synthesize diverse farm data, such as historical yield maps, soil reports, real-time IoT sensor data, drone multispectral imagery, and external factors like weather forecasts and commodity prices.

What challenges does the Generative AI In Agriculture Industry face during its growth?

  • The scarcity, quality, and contextualization of data represent significant challenges that hinder industry growth. These issues must be addressed to ensure the effective utilization and maximization of data's potential impact. Generative artificial intelligence (AI) holds immense potential for revolutionizing agriculture, yet its implementation faces significant challenges due to the complexities of acquiring large, high-quality, and contextually relevant datasets. Unlike consumer internet applications, agriculture data is fragmented, proprietary, unstructured, and intensely localized. The success of generative AI models hinges on the data they are trained on, with the dependency amplified for this advanced technology.
  • For instance, a recent study revealed that incorporating generative AI into precision agriculture increased crop yields by 10% through optimized irrigation and nutrient management. The agricultural AI market is projected to grow by over 20% annually, driven by the increasing demand for improved farm productivity and sustainability. Agricultural data encompasses various types, including numerical data from soil sensors and yield monitors, unstructured data like handwritten scouting notes and spoken observations, and complex geospatial data such as multispectral satellite imagery and high-resolution drone videos.

Exclusive Customer Landscape

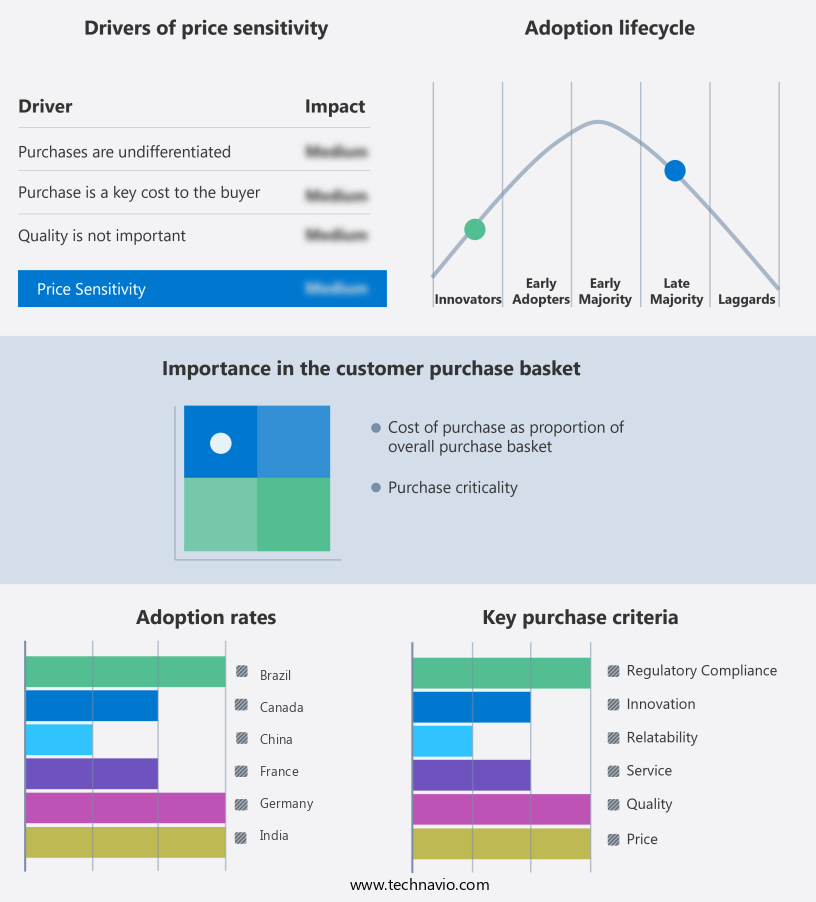
The generative AI in agriculture market forecasting report includes the adoption lifecycle of the market, covering from the innovator's stage to the laggard's stage. It focuses on adoption rates in different regions based on penetration. Furthermore, the generative AI in agriculture market report also includes key purchase criteria and drivers of price sensitivity to help companies evaluate and develop their market growth analysis strategies.

Generative AI In Agriculture Market Share by Geography

 Customer Landscape

Key Companies & Market Insights

Companies are implementing various strategies, such as strategic alliances, generative AI in agriculture market forecast, partnerships, mergers and acquisitions, geographical expansion, and product/service launches, to enhance their presence in the industry.

AAA Taranis Visual Ltd. - The company's Ag Assistant leverages advanced generative AI technology to revolutionize agriculture.

The industry research and growth report includes detailed analyses of the competitive landscape of the market and information about key companies, including:

  • AAA Taranis Visual Ltd.
  • Agribotix
  • ANYbotics AG
  • BASF Digital Farming GmbH
  • Bayer AG
  • Blue River Technology
  • Coverfields
  • Cropin Technology Solutions Pvt. Ltd.
  • Deere and Co.
  • Gamaya
  • Granular Inc.
  • International Business Machines Corp.
  • Microsoft Corp.
  • Plantix
  • PrecisionHawk Inc.
  • Raven Industries Inc.
  • Syngenta Crop Protection AG
  • The Climate Corp.
  • Valmont Industries Inc.

Qualitative and quantitative analysis of companies has been conducted to help clients understand the wider business environment as well as the strengths and weaknesses of key industry players. Data is qualitatively analyzed to categorize companies as pure play, category-focused, industry-focused, and diversified; it is quantitatively analyzed to categorize companies as dominant, leading, strong, tentative, and weak.

Recent Development and News in Generative AI In Agriculture Market

  • In January 2024, Trimble, a leading agriculture technology provider, announced the launch of its new AI-powered crop modeling solution, FarmLogs Crop Intelligence, which uses generative AI to analyze satellite imagery and weather data to optimize crop yields (Trimble Press Release).
  • In March 2024, Microsoft and John Deere, two tech giants, formed a strategic partnership to integrate Microsoft's Azure AI and IoT technologies into John Deere's precision farming equipment, enhancing the farm management capabilities with real-time data analysis (Microsoft News Center).
  • In May 2024, Blue River Technology, an autonomous farming technology company, raised USD 100 million in a Series D funding round, led by CD&R Capital, to expand its product offerings and accelerate the adoption of its AI-powered farming solutions (Business Wire).
  • In February 2025, the European Union approved the use of generative AI in precision farming, marking a significant regulatory milestone for the industry, enabling European farmers to adopt advanced AI technologies to optimize crop yields and reduce environmental impact (EU Commission Press Release).

Research Analyst Overview

  • The market for generative AI in agriculture continues to evolve, with various sectors adopting innovative technologies to enhance productivity and sustainability. Climate change adaptation and climate-smart agriculture are key areas of focus, with soil moisture monitoring and image processing techniques enabling farmers to optimize irrigation and crop growth. Precision livestock farming and livestock disease prediction leverage AI for improved animal health and welfare, while pest control strategies and geospatial data analysis help minimize environmental impact. Agricultural robotics and data fusion algorithms facilitate farm automation systems, optimizing fertilizer application and water resource management. Real-time data processing and big data management enable food safety traceability and smart livestock management.
  • According to recent reports, the global agricultural AI market is projected to grow by over 20% annually, driven by the integration of sensor data, deep learning applications, and natural resource management solutions. For instance, a leading farm implemented AI-powered irrigation systems, resulting in a 15% increase in crop yield.

Dive into Technavio's robust research methodology, blending expert interviews, extensive data synthesis, and validated models for unparalleled Generative AI In Agriculture Market insights. See full methodology.


Market Scope

Report Coverage

Details

Page number

240

Base year

2024

Forecast period

2025-2029

Growth momentum & CAGR

Accelerate at a CAGR of 29.3%

Market growth 2025-2029

USD 1.18 billion

Market structure

Fragmented

YoY growth 2024-2025(%)

25.0

Key countries

China, India, Japan, South Korea, Germany, UK, France, US, Canada, and Brazil

Competitive landscape

Leading Companies, Market Positioning of Companies, Competitive Strategies, and Industry Risks

Request Free Sample

What are the Key Data Covered in this Generative AI In Agriculture Market Research and Growth Report?

  • CAGR of the Generative AI In Agriculture industry during the forecast period
  • Detailed information on factors that will drive the growth and forecasting between 2025 and 2029
  • Precise estimation of the size of the market and its contribution of the industry in focus to the parent market
  • Accurate predictions about upcoming growth and trends and changes in consumer behaviour
  • Growth of the market across North America, APAC, Europe, South America, and Middle East and Africa
  • Thorough analysis of the market's competitive landscape and detailed information about companies
  • Comprehensive analysis of factors that will challenge the generative AI in agriculture market growth of industry companies

We can help! Our analysts can customize this generative AI in agriculture market research report to meet your requirements.

Get in touch

1 Executive Summary

  • 1.1 Market overview
    • Executive Summary - Chart on Market Overview
    • Executive Summary - Data Table on Market Overview
    • Executive Summary - Chart on Global Market Characteristics
    • Executive Summary - Chart on Market by Geography
    • Executive Summary - Chart on Market Segmentation by Technology
    • Executive Summary - Chart on Market Segmentation by Application
    • Executive Summary - Chart on Market Segmentation by Deployment
    • Executive Summary - Chart on Incremental Growth
    • Executive Summary - Data Table on Incremental Growth
    • Executive Summary - Chart on Company Market Positioning

2 Technavio Analysis

  • 2.1 Analysis of price sensitivity, lifecycle, customer purchase basket, adoption rates, and purchase criteria
    • Analysis of price sensitivity, lifecycle, customer purchase basket, adoption rates, and purchase criteria
  • 2.2 Criticality of inputs and Factors of differentiation
    • Overview on criticality of inputs and factors of differentiation
  • 2.3 Factors of disruption
    • Overview on factors of disruption
  • 2.4 Impact of drivers and challenges
    • Impact of drivers and challenges in 2024 and 2029

3 Market Landscape

  • 3.1 Market ecosystem
    • Parent Market
    • Data Table on - Parent Market
  • 3.2 Market characteristics
    • Market characteristics analysis
  • 3.3 Value chain analysis
    • Value chain analysis

4 Market Sizing

  • 4.1 Market definition
    • Offerings of companies included in the market definition
  • 4.2 Market segment analysis
    • Market segments
  • 4.3 Market size 2024
    • 4.4 Market outlook: Forecast for 2024-2029
      • Chart on Global - Market size and forecast 2024-2029 ($ million)
      • Data Table on Global - Market size and forecast 2024-2029 ($ million)
      • Chart on Global Market: Year-over-year growth 2024-2029 (%)
      • Data Table on Global Market: Year-over-year growth 2024-2029 (%)

    5 Five Forces Analysis

    • 5.1 Five forces summary
      • Five forces analysis - Comparison between 2024 and 2029
    • 5.2 Bargaining power of buyers
      • Bargaining power of buyers - Impact of key factors 2024 and 2029
    • 5.3 Bargaining power of suppliers
      • Bargaining power of suppliers - Impact of key factors in 2024 and 2029
    • 5.4 Threat of new entrants
      • Threat of new entrants - Impact of key factors in 2024 and 2029
    • 5.5 Threat of substitutes
      • Threat of substitutes - Impact of key factors in 2024 and 2029
    • 5.6 Threat of rivalry
      • Threat of rivalry - Impact of key factors in 2024 and 2029
    • 5.7 Market condition
      • Chart on Market condition - Five forces 2024 and 2029

    6 Market Segmentation by Technology

    • 6.1 Market segments
      • Chart on Technology - Market share 2024-2029 (%)
      • Data Table on Technology - Market share 2024-2029 (%)
    • 6.2 Comparison by Technology
      • Chart on Comparison by Technology
      • Data Table on Comparison by Technology
    • 6.3 Machine learning - Market size and forecast 2024-2029
      • Chart on Machine learning - Market size and forecast 2024-2029 ($ million)
      • Data Table on Machine learning - Market size and forecast 2024-2029 ($ million)
      • Chart on Machine learning - Year-over-year growth 2024-2029 (%)
      • Data Table on Machine learning - Year-over-year growth 2024-2029 (%)
    • 6.4 Deep learning - Market size and forecast 2024-2029
      • Chart on Deep learning - Market size and forecast 2024-2029 ($ million)
      • Data Table on Deep learning - Market size and forecast 2024-2029 ($ million)
      • Chart on Deep learning - Year-over-year growth 2024-2029 (%)
      • Data Table on Deep learning - Year-over-year growth 2024-2029 (%)
    • 6.5 Computer vision - Market size and forecast 2024-2029
      • Chart on Computer vision - Market size and forecast 2024-2029 ($ million)
      • Data Table on Computer vision - Market size and forecast 2024-2029 ($ million)
      • Chart on Computer vision - Year-over-year growth 2024-2029 (%)
      • Data Table on Computer vision - Year-over-year growth 2024-2029 (%)
    • 6.6 Natural language processing - Market size and forecast 2024-2029
      • Chart on Natural language processing - Market size and forecast 2024-2029 ($ million)
      • Data Table on Natural language processing - Market size and forecast 2024-2029 ($ million)
      • Chart on Natural language processing - Year-over-year growth 2024-2029 (%)
      • Data Table on Natural language processing - Year-over-year growth 2024-2029 (%)
    • 6.7 Robotics - Market size and forecast 2024-2029
      • Chart on Robotics - Market size and forecast 2024-2029 ($ million)
      • Data Table on Robotics - Market size and forecast 2024-2029 ($ million)
      • Chart on Robotics - Year-over-year growth 2024-2029 (%)
      • Data Table on Robotics - Year-over-year growth 2024-2029 (%)
    • 6.8 Market opportunity by Technology
      • Market opportunity by Technology ($ million)
      • Data Table on Market opportunity by Technology ($ million)

    7 Market Segmentation by Application

    • 7.1 Market segments
      • Chart on Application - Market share 2024-2029 (%)
      • Data Table on Application - Market share 2024-2029 (%)
    • 7.2 Comparison by Application
      • Chart on Comparison by Application
      • Data Table on Comparison by Application
    • 7.3 Precision farming - Market size and forecast 2024-2029
      • Chart on Precision farming - Market size and forecast 2024-2029 ($ million)
      • Data Table on Precision farming - Market size and forecast 2024-2029 ($ million)
      • Chart on Precision farming - Year-over-year growth 2024-2029 (%)
      • Data Table on Precision farming - Year-over-year growth 2024-2029 (%)
    • 7.4 Agricultural robotics and automation - Market size and forecast 2024-2029
      • Chart on Agricultural robotics and automation - Market size and forecast 2024-2029 ($ million)
      • Data Table on Agricultural robotics and automation - Market size and forecast 2024-2029 ($ million)
      • Chart on Agricultural robotics and automation - Year-over-year growth 2024-2029 (%)
      • Data Table on Agricultural robotics and automation - Year-over-year growth 2024-2029 (%)
    • 7.5 Crop management - Market size and forecast 2024-2029
      • Chart on Crop management - Market size and forecast 2024-2029 ($ million)
      • Data Table on Crop management - Market size and forecast 2024-2029 ($ million)
      • Chart on Crop management - Year-over-year growth 2024-2029 (%)
      • Data Table on Crop management - Year-over-year growth 2024-2029 (%)
    • 7.6 Livestock management - Market size and forecast 2024-2029
      • Chart on Livestock management - Market size and forecast 2024-2029 ($ million)
      • Data Table on Livestock management - Market size and forecast 2024-2029 ($ million)
      • Chart on Livestock management - Year-over-year growth 2024-2029 (%)
      • Data Table on Livestock management - Year-over-year growth 2024-2029 (%)
    • 7.7 Soil analysis - Market size and forecast 2024-2029
      • Chart on Soil analysis - Market size and forecast 2024-2029 ($ million)
      • Data Table on Soil analysis - Market size and forecast 2024-2029 ($ million)
      • Chart on Soil analysis - Year-over-year growth 2024-2029 (%)
      • Data Table on Soil analysis - Year-over-year growth 2024-2029 (%)
    • 7.8 Market opportunity by Application
      • Market opportunity by Application ($ million)
      • Data Table on Market opportunity by Application ($ million)

    8 Market Segmentation by Deployment

    • 8.1 Market segments
      • Chart on Deployment - Market share 2024-2029 (%)
      • Data Table on Deployment - Market share 2024-2029 (%)
    • 8.2 Comparison by Deployment
      • Chart on Comparison by Deployment
      • Data Table on Comparison by Deployment
    • 8.3 Cloud based - Market size and forecast 2024-2029
      • Chart on Cloud based - Market size and forecast 2024-2029 ($ million)
      • Data Table on Cloud based - Market size and forecast 2024-2029 ($ million)
      • Chart on Cloud based - Year-over-year growth 2024-2029 (%)
      • Data Table on Cloud based - Year-over-year growth 2024-2029 (%)
    • 8.4 On premises - Market size and forecast 2024-2029
      • Chart on On premises - Market size and forecast 2024-2029 ($ million)
      • Data Table on On premises - Market size and forecast 2024-2029 ($ million)
      • Chart on On premises - Year-over-year growth 2024-2029 (%)
      • Data Table on On premises - Year-over-year growth 2024-2029 (%)
    • 8.5 Hybrid - Market size and forecast 2024-2029
      • Chart on Hybrid - Market size and forecast 2024-2029 ($ million)
      • Data Table on Hybrid - Market size and forecast 2024-2029 ($ million)
      • Chart on Hybrid - Year-over-year growth 2024-2029 (%)
      • Data Table on Hybrid - Year-over-year growth 2024-2029 (%)
    • 8.6 Market opportunity by Deployment
      • Market opportunity by Deployment ($ million)
      • Data Table on Market opportunity by Deployment ($ million)

    9 Customer Landscape

    • 9.1 Customer landscape overview
      • Analysis of price sensitivity, lifecycle, customer purchase basket, adoption rates, and purchase criteria

    10 Geographic Landscape

    • 10.1 Geographic segmentation
      • Chart on Market share by geography 2024-2029 (%)
      • Data Table on Market share by geography 2024-2029 (%)
    • 10.2 Geographic comparison
      • Chart on Geographic comparison
      • Data Table on Geographic comparison
    • 10.3 North America - Market size and forecast 2024-2029
      • Chart on North America - Market size and forecast 2024-2029 ($ million)
      • Data Table on North America - Market size and forecast 2024-2029 ($ million)
      • Chart on North America - Year-over-year growth 2024-2029 (%)
      • Data Table on North America - Year-over-year growth 2024-2029 (%)
    • 10.4 APAC - Market size and forecast 2024-2029
      • Chart on APAC - Market size and forecast 2024-2029 ($ million)
      • Data Table on APAC - Market size and forecast 2024-2029 ($ million)
      • Chart on APAC - Year-over-year growth 2024-2029 (%)
      • Data Table on APAC - Year-over-year growth 2024-2029 (%)
    • 10.5 Europe - Market size and forecast 2024-2029
      • Chart on Europe - Market size and forecast 2024-2029 ($ million)
      • Data Table on Europe - Market size and forecast 2024-2029 ($ million)
      • Chart on Europe - Year-over-year growth 2024-2029 (%)
      • Data Table on Europe - Year-over-year growth 2024-2029 (%)
    • 10.6 South America - Market size and forecast 2024-2029
      • Chart on South America - Market size and forecast 2024-2029 ($ million)
      • Data Table on South America - Market size and forecast 2024-2029 ($ million)
      • Chart on South America - Year-over-year growth 2024-2029 (%)
      • Data Table on South America - Year-over-year growth 2024-2029 (%)
    • 10.7 Middle East and Africa - Market size and forecast 2024-2029
      • Chart on Middle East and Africa - Market size and forecast 2024-2029 ($ million)
      • Data Table on Middle East and Africa - Market size and forecast 2024-2029 ($ million)
      • Chart on Middle East and Africa - Year-over-year growth 2024-2029 (%)
      • Data Table on Middle East and Africa - Year-over-year growth 2024-2029 (%)
    • 10.8 US - Market size and forecast 2024-2029
      • Chart on US - Market size and forecast 2024-2029 ($ million)
      • Data Table on US - Market size and forecast 2024-2029 ($ million)
      • Chart on US - Year-over-year growth 2024-2029 (%)
      • Data Table on US - Year-over-year growth 2024-2029 (%)
    • 10.9 China - Market size and forecast 2024-2029
      • Chart on China - Market size and forecast 2024-2029 ($ million)
      • Data Table on China - Market size and forecast 2024-2029 ($ million)
      • Chart on China - Year-over-year growth 2024-2029 (%)
      • Data Table on China - Year-over-year growth 2024-2029 (%)
    • 10.10 Canada - Market size and forecast 2024-2029
      • Chart on Canada - Market size and forecast 2024-2029 ($ million)
      • Data Table on Canada - Market size and forecast 2024-2029 ($ million)
      • Chart on Canada - Year-over-year growth 2024-2029 (%)
      • Data Table on Canada - Year-over-year growth 2024-2029 (%)
    • 10.11 India - Market size and forecast 2024-2029
      • Chart on India - Market size and forecast 2024-2029 ($ million)
      • Data Table on India - Market size and forecast 2024-2029 ($ million)
      • Chart on India - Year-over-year growth 2024-2029 (%)
      • Data Table on India - Year-over-year growth 2024-2029 (%)
    • 10.12 Japan - Market size and forecast 2024-2029
      • Chart on Japan - Market size and forecast 2024-2029 ($ million)
      • Data Table on Japan - Market size and forecast 2024-2029 ($ million)
      • Chart on Japan - Year-over-year growth 2024-2029 (%)
      • Data Table on Japan - Year-over-year growth 2024-2029 (%)
    • 10.13 Germany - Market size and forecast 2024-2029
      • Chart on Germany - Market size and forecast 2024-2029 ($ million)
      • Data Table on Germany - Market size and forecast 2024-2029 ($ million)
      • Chart on Germany - Year-over-year growth 2024-2029 (%)
      • Data Table on Germany - Year-over-year growth 2024-2029 (%)
    • 10.14 Brazil - Market size and forecast 2024-2029
      • Chart on Brazil - Market size and forecast 2024-2029 ($ million)
      • Data Table on Brazil - Market size and forecast 2024-2029 ($ million)
      • Chart on Brazil - Year-over-year growth 2024-2029 (%)
      • Data Table on Brazil - Year-over-year growth 2024-2029 (%)
    • 10.15 South Korea - Market size and forecast 2024-2029
      • Chart on South Korea - Market size and forecast 2024-2029 ($ million)
      • Data Table on South Korea - Market size and forecast 2024-2029 ($ million)
      • Chart on South Korea - Year-over-year growth 2024-2029 (%)
      • Data Table on South Korea - Year-over-year growth 2024-2029 (%)
    • 10.16 UK - Market size and forecast 2024-2029
      • Chart on UK - Market size and forecast 2024-2029 ($ million)
      • Data Table on UK - Market size and forecast 2024-2029 ($ million)
      • Chart on UK - Year-over-year growth 2024-2029 (%)
      • Data Table on UK - Year-over-year growth 2024-2029 (%)
    • 10.17 France - Market size and forecast 2024-2029
      • Chart on France - Market size and forecast 2024-2029 ($ million)
      • Data Table on France - Market size and forecast 2024-2029 ($ million)
      • Chart on France - Year-over-year growth 2024-2029 (%)
      • Data Table on France - Year-over-year growth 2024-2029 (%)
    • 10.18 Market opportunity by geography
      • Market opportunity by geography ($ million)
      • Data Tables on Market opportunity by geography ($ million)

    11 Drivers, Challenges, and Opportunity/Restraints

    • 11.1 Market drivers
      • 11.2 Market challenges
        • 11.3 Impact of drivers and challenges
          • Impact of drivers and challenges in 2024 and 2029
        • 11.4 Market opportunities/restraints

          12 Competitive Landscape

          • 12.1 Overview
            • 12.2 Competitive Landscape
              • Overview on criticality of inputs and factors of differentiation
            • 12.3 Landscape disruption
              • Overview on factors of disruption
            • 12.4 Industry risks
              • Impact of key risks on business

            13 Competitive Analysis

            • 13.1 Companies profiled
              • Companies covered
            • 13.2 Company ranking index
              • Company ranking index
            • 13.3 Market positioning of companies
              • Matrix on companies position and classification
            • 13.4 AAA Taranis Visual Ltd.
              • AAA Taranis Visual Ltd. - Overview
              • AAA Taranis Visual Ltd. - Product / Service
              • AAA Taranis Visual Ltd. - Key offerings
              • SWOT
            • 13.5 BASF Digital Farming GmbH
              • BASF Digital Farming GmbH - Overview
              • BASF Digital Farming GmbH - Product / Service
              • BASF Digital Farming GmbH - Key offerings
              • SWOT
            • 13.6 Bayer AG
              • Bayer AG - Overview
              • Bayer AG - Business segments
              • Bayer AG - Key news
              • Bayer AG - Key offerings
              • Bayer AG - Segment focus
              • SWOT
            • 13.7 Blue River Technology
              • Blue River Technology - Overview
              • Blue River Technology - Product / Service
              • Blue River Technology - Key offerings
              • SWOT
            • 13.8 Cropin Technology Solutions Pvt. Ltd.
              • Cropin Technology Solutions Pvt. Ltd. - Overview
              • Cropin Technology Solutions Pvt. Ltd. - Product / Service
              • Cropin Technology Solutions Pvt. Ltd. - Key offerings
              • SWOT
            • 13.9 Deere and Co.
              • Deere and Co. - Overview
              • Deere and Co. - Business segments
              • Deere and Co. - Key news
              • Deere and Co. - Key offerings
              • Deere and Co. - Segment focus
              • SWOT
            • 13.10 Gamaya
              • Gamaya - Overview
              • Gamaya - Product / Service
              • Gamaya - Key offerings
              • SWOT
            • 13.11 Granular Inc.
              • Granular Inc. - Overview
              • Granular Inc. - Product / Service
              • Granular Inc. - Key offerings
              • SWOT
            • 13.12 International Business Machines Corp.
              • International Business Machines Corp. - Overview
              • International Business Machines Corp. - Business segments
              • International Business Machines Corp. - Key news
              • International Business Machines Corp. - Key offerings
              • International Business Machines Corp. - Segment focus
              • SWOT
            • 13.13 Microsoft Corp.
              • Microsoft Corp. - Overview
              • Microsoft Corp. - Business segments
              • Microsoft Corp. - Key news
              • Microsoft Corp. - Key offerings
              • Microsoft Corp. - Segment focus
              • SWOT
            • 13.14 Plantix
              • Plantix - Overview
              • Plantix - Product / Service
              • Plantix - Key offerings
              • SWOT
            • 13.15 PrecisionHawk Inc.
              • PrecisionHawk Inc. - Overview
              • PrecisionHawk Inc. - Product / Service
              • PrecisionHawk Inc. - Key offerings
              • SWOT
            • 13.16 Syngenta Crop Protection AG
              • Syngenta Crop Protection AG - Overview
              • Syngenta Crop Protection AG - Product / Service
              • Syngenta Crop Protection AG - Key offerings
              • SWOT
            • 13.17 The Climate Corp.
              • The Climate Corp. - Overview
              • The Climate Corp. - Product / Service
              • The Climate Corp. - Key offerings
              • SWOT
            • 13.18 Valmont Industries Inc.
              • Valmont Industries Inc. - Overview
              • Valmont Industries Inc. - Business segments
              • Valmont Industries Inc. - Key offerings
              • Valmont Industries Inc. - Segment focus
              • SWOT

            14 Appendix

            • 14.1 Scope of the report
              • 14.2 Inclusions and exclusions checklist
                • Inclusions checklist
                • Exclusions checklist
              • 14.3 Currency conversion rates for US$
                • Currency conversion rates for US$
              • 14.4 Research methodology
                • Research methodology
              • 14.5 Data procurement
                • Information sources
              • 14.6 Data validation
                • Data validation
              • 14.7 Validation techniques employed for market sizing
                • Validation techniques employed for market sizing
              • 14.8 Data synthesis
                • Data synthesis
              • 14.9 360 degree market analysis
                • 360 degree market analysis
              • 14.10 List of abbreviations
                • List of abbreviations

              Research Methodology

              Technavio presents a detailed picture of the market by way of study, synthesis, and summation of data from multiple sources. The analysts have presented the various facets of the market with a particular focus on identifying the key industry influencers. The data thus presented is comprehensive, reliable, and the result of extensive research, both primary and secondary.

              INFORMATION SOURCES

              Primary sources

              • Manufacturers and suppliers
              • Channel partners
              • Industry experts
              • Strategic decision makers

              Secondary sources

              • Industry journals and periodicals
              • Government data
              • Financial reports of key industry players
              • Historical data
              • Press releases

              DATA ANALYSIS

              Data Synthesis

              • Collation of data
              • Estimation of key figures
              • Analysis of derived insights

              Data Validation

              • Triangulation with data models
              • Reference against proprietary databases
              • Corroboration with industry experts

              REPORT WRITING

              Qualitative

              • Market drivers
              • Market challenges
              • Market trends
              • Five forces analysis

              Quantitative

              • Market size and forecast
              • Market segmentation
              • Geographical insights
              • Competitive landscape

              Interested in this report?

              Get your sample now to see our research methodology and insights!

              Download Now

              Frequently Asked Questions

              Generative Ai In Agriculture market growth will increase by $ 1183.3 mn during 2025-2029.

              The Generative Ai In Agriculture market is expected to grow at a CAGR of 29.3% during 2025-2029.

              Generative Ai In Agriculture market is segmented by Technology( Machine learning, Deep learning, Computer vision, Natural language processing, Robotics) Application( Precision farming, Agricultural robotics and automation, Crop management, Livestock management, Soil analysis) Deployment( Cloud based, On premises, Hybrid)

              AAA Taranis Visual Ltd., Agribotix, ANYbotics AG, BASF Digital Farming GmbH, Bayer AG, Blue River Technology, Coverfields, Cropin Technology Solutions Pvt. Ltd., Deere and Co., Gamaya, Granular Inc., International Business Machines Corp., Microsoft Corp., Plantix, PrecisionHawk Inc., Raven Industries Inc., Syngenta Crop Protection AG, The Climate Corp., Valmont Industries Inc. are a few of the key vendors in the Generative Ai In Agriculture market.

              North America will register the highest growth rate of 36% among the other regions. Therefore, the Generative Ai In Agriculture market in North America is expected to garner significant business opportunities for the vendors during the forecast period.

              China, India, Japan, South Korea, Germany, UK, France, US, Canada, Brazil

              • Global imperative for enhanced agricultural productivity and sustainabilityA primary and overarching driver for the adoption of generative artificial intelligence in agriculture is the unrelenting global pressure to increase food production in a more efficient and sustainable manner. The Food and Agriculture Organization of the United Nations projects the need to produce significantly more food to feed a global population expected to exceed nine billion by 2050 is the driving factor this market.
              • all while confronting the compounding challenges of diminishing arable land is the driving factor this market.
              • increasing water scarcity is the driving factor this market.
              • and the profound impacts of climate change on crop viability and yield stability. Traditional agricultural practices and even first-generation precision agriculture tools is the driving factor this market.
              • while valuable is the driving factor this market.
              • are reaching the limits of their efficacy in the face of such complex and interconnected pressures. Generative AI represents a paradigm shift is the driving factor this market.
              • moving beyond simple predictive analytics to offer holistic is the driving factor this market.
              • synthesized solutions. It is uniquely capable of processing and integrating vast is the driving factor this market.
              • multimodal datasets encompassing everything from genomic data of crop varieties and real-time sensor readings from fields to long-range climate models and volatile commodity market signals. By doing so is the driving factor this market.
              • it can generate novel is the driving factor this market.
              • highly optimized strategies that a human analyst or a conventional algorithm could not conceive. For instance is the driving factor this market.
              • a generative model can create a dynamic is the driving factor this market.
              • farm-wide management plan that not only maximizes yield but also minimizes environmental impact by generating precise fertilizer application schedules to prevent nutrient runoff and optimizing irrigation to conserve water. It can simulate the long-term effects of different crop rotation strategies on soil health and carbon sequestration is the driving factor this market.
              • enabling farmers to make decisions that are both profitable and ecologically responsible. The power of AI to solve such complex is the driving factor this market.
              • constrained optimization problems is a direct analogue to the challenges faced in modern agriculture. A powerful recent instance demonstrating this capability is the driving factor this market.
              • while not from the agriculture sector is the driving factor this market.
              • is the work by Google DeepMind on AlphaGeometry is the driving factor this market.
              • which was detailed in January 2024. This AI system demonstrated the ability to solve complex geometry problems at a near-human-olympiad level is the driving factor this market.
              • showcasing a profound capacity for logical reasoning and deduction within a system of complex rules and variables. This same capacity for sophisticated reasoning is what allows generative AI to navigate the intricate biological is the driving factor this market.
              • environmental is the driving factor this market.
              • and economic variables of a farm is the driving factor this market.
              • generating strategies that holistically address the urgent global imperative for more productive and sustainable food systems. is the driving factor this market.

              The Generative Ai In Agriculture market vendors should focus on grabbing business opportunities from the Machine learning segment as it accounted for the largest market share in the base year.
              RIA - Research AI Assistant
              Ask RIA