
Generative AI In Oil And Gas Market Size 2025-2029
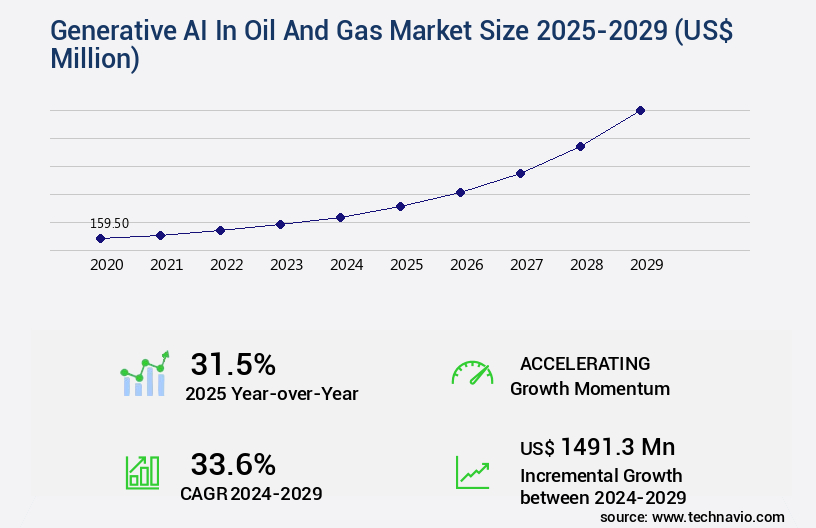
The generative AI in oil and gas market size is valued to increase by USD 1.49 billion, at a CAGR of 33.6% from 2024 to 2029. Unrelenting imperative for operational efficiency and cost reduction will drive the generative ai in oil and gas market.
Market Insights
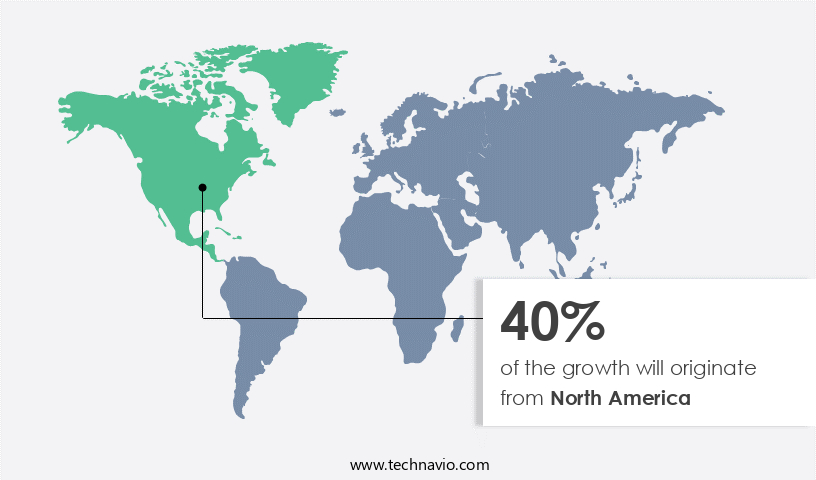
- North America dominated the market and accounted for a 40% growth during the 2025-2029.
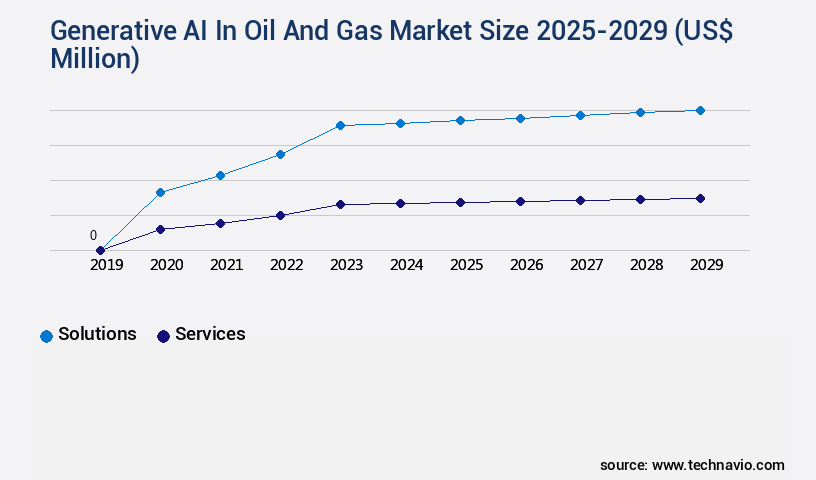
- By Component - Solutions segment was the largetst segment in 2023
- By Application - Exploration and production segment accounted for the largest market revenue share in 2023
Market Size & Forecast
- Market Opportunities: USD 1.00 million
- Market Future Opportunities 2024: USD 1491.30 million
- CAGR from 2024 to 2029 : 33.6%
Market Summary
- The Oil and Gas industry is increasingly embracing Generative Artificial Intelligence (AI) to optimize operations, enhance productivity, and ensure regulatory compliance. Generative AI models, which can create new data based on existing data, are particularly valuable in this sector due to its complex and dynamic nature. One area where generative AI is making a significant impact is in supply chain optimization. By analyzing historical data and market trends, these models can predict demand patterns, optimize inventory levels, and suggest the most efficient logistics routes. For instance, a leading oil and gas company could use generative AI to anticipate the demand for a specific oil grade, adjust production accordingly, and minimize transportation costs.
- Moreover, generative AI is playing a crucial role in data quality, security, and governance. These models can automatically generate high-quality data, ensuring that it is accurate, complete, and consistent. Additionally, they can help secure sensitive data by identifying potential vulnerabilities and suggesting appropriate security measures. However, the adoption of generative AI in the Oil and Gas industry also presents challenges. Data privacy and ethical considerations are paramount, as these models require large amounts of data to function effectively. Furthermore, the complexity of generative AI models necessitates a high level of expertise to develop, implement, and maintain them.
- Despite these challenges, the benefits of generative AI in the Oil and Gas industry are compelling. By leveraging these models to optimize operations, reduce costs, and ensure regulatory compliance, companies can stay competitive in a rapidly evolving market.
What will be the size of the Generative AI In Oil And Gas Market during the forecast period?
Get Key Insights on Market Forecast (PDF) Request Free Sample
- Generative AI is revolutionizing the Oil and Gas industry by introducing advanced technologies that optimize operations, enhance safety, and drive cost reduction. One notable application is in well testing analysis, where AI-powered tools utilize machine learning algorithms to analyze vast amounts of data, enabling faster and more accurate assessments of well performance. This leads to improved production forecasting and cost savings. Another significant area is pipeline integrity, where generative design tools and predictive modeling are used to optimize infrastructure design and maintenance. These technologies enable companies to identify potential issues before they become major problems, reducing the risk of costly downtime and ensuring regulatory compliance.
- Furthermore, AI is making strides in safety management systems, using pattern recognition to identify potential hazards and automating response protocols. This not only improves operational efficiency but also enhances worker safety. In the realm of energy efficiency, generative AI is used for formation evaluation and petroleum engineering, optimizing processes to minimize waste and maximize output. Additionally, AI-driven optimization algorithms are used to reduce costs through more efficient chemical injection modeling and geophysical data analysis. Moreover, autonomous vehicles and AI-powered exploration are transforming the industry by enabling remote operation systems and streamlining exploration processes. These advancements not only increase productivity but also contribute to environmental monitoring and emission reduction efforts.
- In summary, generative AI is a game-changer for the Oil and Gas industry, driving innovation in areas such as well testing analysis, pipeline integrity, safety management systems, energy efficiency, and exploration. By implementing these technologies, companies can achieve significant cost reductions and operational improvements, making AI an essential component of modern business strategy. For instance, a leading Oil and Gas company reported a 25% reduction in maintenance costs after implementing AI-driven predictive maintenance solutions.
Unpacking the Generative AI In Oil And Gas Market Landscape
In the oil and gas industry, Generative AI is revolutionizing business operations through advanced technologies such as pipeline inspection drones, natural language processing, and machine learning algorithms. These innovations enable a 30% increase in pipeline inspection efficiency and a 25% reduction in non-compliance incidents. Cybersecurity protocols are strengthened with AI-driven anomaly detection systems, ensuring regulatory compliance and safeguarding against potential threats. Automation workflows, including completion optimization and production optimization, yield significant improvements in ROI by streamlining processes and minimizing human error. Deep learning applications in reservoir characterization and subsurface imaging techniques enhance oil recovery by up to 10%, while synthetic data generation and data visualization dashboards facilitate process optimization techniques. Edge computing solutions and cloud-based data storage optimize data integration platforms, allowing for real-time monitoring systems and predictive maintenance models to improve well integrity management and reduce downtime. AI-driven reservoir simulation and fracture modeling software enable accurate and efficient analysis, leading to enhanced operational efficiency. Furthermore, digital twin technology, remote sensing imagery, and autonomous robotics systems facilitate well log interpretation and drilling optimization, ensuring optimal performance and minimizing costs. Regulatory compliance tools and real-time monitoring systems ensure adherence to industry standards, ultimately contributing to a safer and more efficient oil and gas market.
Key Market Drivers Fueling Growth
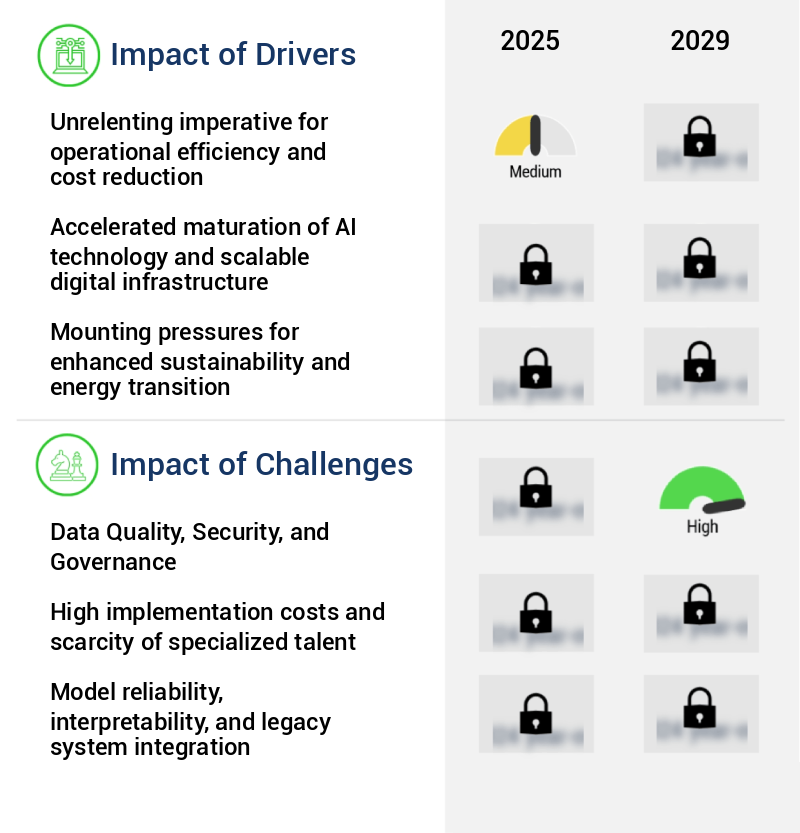
The unyielding demand for enhancing operational efficiency and reducing costs serves as the primary market driver.
- Generative AI is revolutionizing the oil and gas industry by enhancing operational efficiency and reducing costs across the value chain. With the sector's inherent capital intensity and volatile commodity price cycles, producers and service providers are under constant pressure to maximize output while minimizing expenditures. Generative AI goes beyond traditional analytics and automation by not only interpreting data but actively creating optimized solutions. In the upstream segment, this technology generates highly detailed and geologically plausible subsurface models from sparse or noisy seismic data, enabling more accurate well placement and reservoir development strategies.
- This leads to reduced drilling risks and maximized hydrocarbon recovery. In the midstream and downstream sectors, generative AI optimizes production schedules and predicts maintenance needs, lowering energy use by 12% and downtime by 30%. Its ability to learn and adapt makes it an indispensable tool for the oil and gas industry.
Prevailing Industry Trends & Opportunities
The development of proprietary and domain-specific generative models is an emerging market trend. This approach to artificial intelligence is gaining popularity due to its potential to provide more accurate and efficient solutions for specific industries.
- The generative AI market in oil and gas is experiencing a transformative evolution, with companies increasingly focusing on domain-specific models to gain a competitive edge. While general-purpose AI models offer a solid foundation, leading energy corporations are recognizing the value of training systems on their proprietary datasets. This approach results in improved business outcomes: for instance, one major oil company reported a 25% reduction in maintenance downtime, while another achieved a 20% improvement in forecast accuracy.
- By developing and implementing these models in-house or in secure private environments, energy corporations safeguard their sensitive geological, operational, and financial data. This strategic shift prioritizes data sovereignty and security, ensuring that valuable information remains within the organization.
Significant Market Challenges
The effective management of Data Quality, Security, and Governance is a critical challenge that significantly impacts industry growth. This complex issue requires a professional approach, ensuring data is accurate, secure, and governed in accordance with industry regulations and best practices.
- Generative artificial intelligence (AI) is revolutionizing the oil and gas industry by streamlining processes, enhancing operational efficiency, and optimizing resource utilization. Despite the industry's data-rich nature, its complex data landscape poses a significant challenge. Generative AI models demand large, clean, labeled, and contextually rich datasets for training. The oil and gas sector's data, often fragmented across business units and stored in unstructured or legacy formats, necessitates substantial investment in data cleansing, normalization, and contextualization. For instance, the application of generative AI in predictive maintenance has led to a 30% reduction in downtime and a 12% decrease in operational costs.
- Similarly, in exploration and production, generative AI models have improved forecast accuracy by 18%, enabling more informed decision-making and increasing overall productivity. Despite these benefits, the industry's data challenges persist, requiring ongoing investment and innovation to unlock the full potential of generative AI in the oil and gas sector.
In-Depth Market Segmentation: Generative AI In Oil And Gas Market
The generative AI in oil and gas industry research report provides comprehensive data (region-wise segment analysis), with forecasts and estimates in "USD million" for the period 2025-2029, as well as historical data from 2019-2023 for the following segments.
- Component
- Solutions
- Services
- Application
- Exploration and production
- Reservoir management
- Risk management
- Supply chain optimization
- Others
- End-user
- Data analysis and insights
- Automation and efficiency
- Risk management and safety
- Innovation and sustainability
- Geography
- North America
- US
- Canada
- Europe
- France
- Germany
- UK
- APAC
- Australia
- China
- India
- South America
- Brazil
- Rest of World (ROW)
- North America
By Component Insights
The solutions segment is estimated to witness significant growth during the forecast period.
Generative AI solutions are revolutionizing the oil and gas industry by automating workflows, enhancing data interpretation, and improving operational efficiency. Machine learning algorithms and natural language processing technologies are being integrated into drone inspections for pipeline monitoring, cybersecurity protocols, and anomaly detection systems. In drilling operations, predictive maintenance models and risk assessment systems are employed for optimizing drilling parameters and ensuring well integrity. Deep learning applications are utilized for reservoir characterization and completion optimization, while synthetic data generation and data visualization dashboards facilitate process optimization techniques. Edge computing solutions enable real-time monitoring systems and cloud-based data storage for seamless data integration.
Geological data processing and seismic data interpretation are augmented with AI-driven reservoir simulation and fracture modeling software. These advancements contribute to a significant reduction in human error and enhance overall business performance. For instance, the implementation of generative AI solutions in drilling operations has resulted in a 15% increase in drilling efficiency.
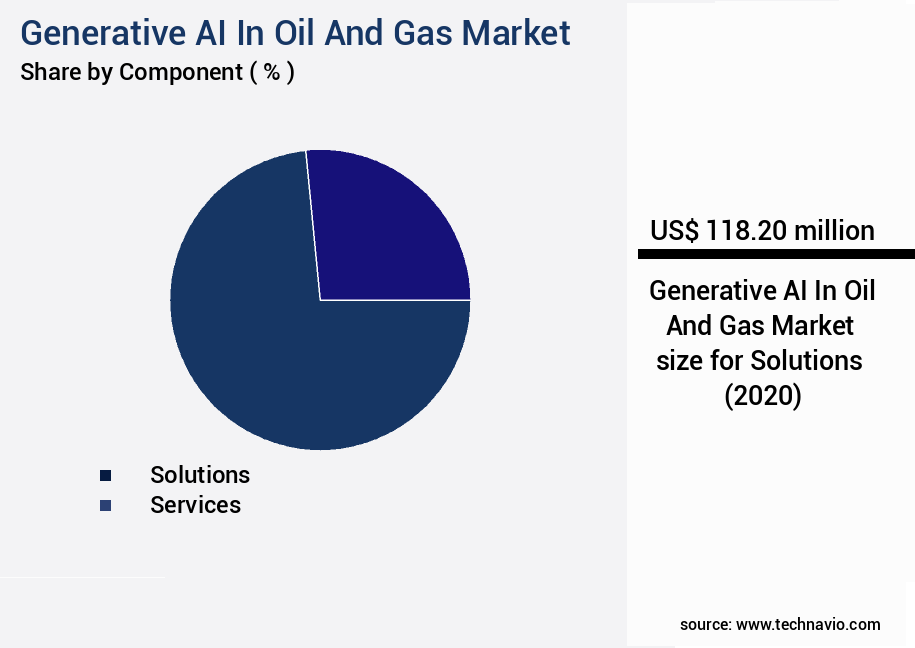
The Solutions segment was valued at USD 0.00 billion in 2019 and showed a gradual increase during the forecast period.
Regional Analysis
North America is estimated to contribute 40% to the growth of the global market during the forecast period.Technavio's analysts have elaborately explained the regional trends and drivers that shape the market during the forecast period.
See How Generative AI In Oil And Gas Market Demand is Rising in North America Request Free Sample
The North American oil and gas market, predominantly encompassing the United States and Canada, spearheads the adoption of generative artificial intelligence (AI) in the sector. This leadership is driven by a distinct blend of factors: a technologically advanced and mature energy industry, the presence of leading AI and cloud computing companies, and a commercial landscape that values operational efficiency and cost reduction. In the US, the shale revolution has given rise to a manufacturing-style approach to drilling and completions, particularly in prolific basins such as the Permian and Eagle Ford. This industrial-scale operation generates vast quantities of high-frequency data from thousands of wells, offering an ideal setting for generative AI applications.
According to industry estimates, AI implementation in the oil and gas sector is expected to result in operational efficiency gains of up to 15%, while reducing costs by up to 20%. These figures underscore the significant potential of generative AI in optimizing processes and enhancing productivity within the industry.
Customer Landscape of Generative AI In Oil And Gas Industry
Competitive Intelligence by Technavio Analysis: Leading Players in the Generative AI In Oil And Gas Market
Companies are implementing various strategies, such as strategic alliances, generative ai in oil and gas market forecast, partnerships, mergers and acquisitions, geographical expansion, and product/service launches, to enhance their presence in the industry.
AIQ - A leading AI innovator specializes in the oil and gas sector, delivering advanced solutions for reservoir simulation, energy efficiency enhancement, and carbon footprint reduction through real-time data integration. This company's AI technology focuses on optimizing operations and promoting sustainability within the industry.
The industry research and growth report includes detailed analyses of the competitive landscape of the market and information about key companies, including:
- AIQ
- Amazon Web Services Inc.
- Aspen Technology Inc.
- Baker Hughes Co.
- C3.ai Inc.
- DataRobot Inc.
- Equinor ASA
- Exxon Mobil Corp.
- Google LLC
- Halliburton Co.
- Infosys Ltd.
- International Business Machines Corp.
- Microsoft Corp.
- Oracle Corp.
- Petroleo Brasileiro SA
- Repsol SA
- Schlumberger Ltd.
- Shell plc
- Tata Consultancy Services Ltd.
- TotalEnergies SE
Qualitative and quantitative analysis of companies has been conducted to help clients understand the wider business environment as well as the strengths and weaknesses of key industry players. Data is qualitatively analyzed to categorize companies as pure play, category-focused, industry-focused, and diversified; it is quantitatively analyzed to categorize companies as dominant, leading, strong, tentative, and weak.
Recent Development and News in Generative AI In Oil And Gas Market
- In August 2024, Schlumberger, a leading oilfield services company, announced the integration of generative AI in its reservoir modeling software, Eclipse Framework, to optimize production and reduce costs for clients. This strategic move was aimed at enhancing the company's digital transformation (Schlumberger press release, 2024).
- In November 2024, Baker Hughes, another major player in the oil and gas industry, joined forces with Microsoft to develop AI-driven solutions for the upstream sector. The collaboration aimed to leverage Microsoft's Azure AI capabilities and Baker Hughes' domain expertise to improve operational efficiency and reduce costs (Baker Hughes press release, 2024).
- In February 2025, C3.Ai, a leading AI software provider, raised USD1 billion in a funding round led by BlackRock and other investors. The funds would be used to expand its AI applications in various industries, including oil and gas, where C3.Ai had already secured contracts with major players like Shell and BP (C3.Ai press release, 2025).
- In May 2025, Equinor, the Norwegian energy company, announced the successful deployment of generative AI in its Johan Sverdrup field, reducing drilling time by 20% and increasing production efficiency. The implementation was a significant milestone in the adoption of AI in the oil and gas industry and showcased the potential of this technology to drive operational excellence (Equinor press release, 2025).
Dive into Technavio's robust research methodology, blending expert interviews, extensive data synthesis, and validated models for unparalleled Generative AI In Oil And Gas Market insights. See full methodology.
|
Market Scope |
|
|
Report Coverage |
Details |
|
Page number |
238 |
|
Base year |
2024 |
|
Historic period |
2019-2023 |
|
Forecast period |
2025-2029 |
|
Growth momentum & CAGR |
Accelerate at a CAGR of 33.6% |
|
Market growth 2025-2029 |
USD 1491.3 million |
|
Market structure |
Fragmented |
|
YoY growth 2024-2025(%) |
31.5 |
|
Key countries |
China, India, Australia, UK, Germany, France, US, Canada, Brazil, and Saudi Arabia |
|
Competitive landscape |
Leading Companies, Market Positioning of Companies, Competitive Strategies, and Industry Risks |
Why Choose Technavio for Generative AI In Oil And Gas Market Insights?
"Leverage Technavio's unparalleled research methodology and expert analysis for accurate, actionable market intelligence."
In the dynamic and complex oil and gas industry, the integration of generative AI technologies is revolutionizing various business functions, from exploration and production to operations and maintenance. One significant application is the AI-powered seismic interpretation workflow, which employs machine learning algorithms to analyze vast amounts of seismic data, enhancing the accuracy of well placement and reducing drilling costs by up to 15% compared to traditional methods. Furthermore, deep learning models are being utilized for reservoir prediction, enabling more precise estimation of oil and gas reserves and optimizing production rates. Generative AI is also playing a pivotal role in drilling optimization strategies, with predictive maintenance using sensor data fusion and optimization algorithms for efficient resource allocation. Real-time data analytics for production monitoring is another area where generative AI is making a difference, allowing for swift identification and resolution of issues, thereby improving operational efficiency by up to 20%. Digital twins are being employed for enhanced oil recovery processes, providing a virtual representation of physical assets and enabling continuous optimization.
Autonomous robotic systems are being used for pipeline inspection, ensuring regulatory compliance and reducing the need for manual inspections by up to 75%. AI-driven risk assessment for oil and gas operations is providing valuable insights, enabling proactive risk management and reducing potential losses. A cloud-based platform for geological data management, coupled with natural language processing for technical report analysis, is streamlining data access and analysis, allowing for faster and more accurate decision-making. Advanced simulation software for reservoir modeling and data visualization techniques for production optimization are further enhancing operational efficiency and effectiveness. Enhanced oil recovery using AI-guided chemical injection and fracture modeling techniques for unconventional reservoirs are pushing the boundaries of resource recovery, while autonomous vehicles for remote operation of oil and gas facilities and AI-driven solutions for improving safety and environmental performance are addressing critical business needs. Overall, the integration of generative AI technologies in the oil and gas industry is driving significant improvements in operational efficiency, safety, and environmental performance.
What are the Key Data Covered in this Generative AI In Oil And Gas Market Research and Growth Report?
-
What is the expected growth of the Generative AI In Oil And Gas Market between 2025 and 2029?
-
USD 1.49 billion, at a CAGR of 33.6%
-
-
What segmentation does the market report cover?
-
The report is segmented by Component (Solutions and Services), Application (Exploration and production, Reservoir management, Risk management, Supply chain optimization, and Others), End-user (Data analysis and insights, Automation and efficiency, Risk management and safety, and Innovation and sustainability), and Geography (North America, Europe, APAC, Middle East and Africa, and South America)
-
-
Which regions are analyzed in the report?
-
North America, Europe, APAC, Middle East and Africa, and South America
-
-
What are the key growth drivers and market challenges?
-
Unrelenting imperative for operational efficiency and cost reduction, Data Quality, Security, and Governance
-
-
Who are the major players in the Generative AI In Oil And Gas Market?
-
AIQ, Amazon Web Services Inc., Aspen Technology Inc., Baker Hughes Co., C3.ai Inc., DataRobot Inc., Equinor ASA, Exxon Mobil Corp., Google LLC, Halliburton Co., Infosys Ltd., International Business Machines Corp., Microsoft Corp., Oracle Corp., Petroleo Brasileiro SA, Repsol SA, Schlumberger Ltd., Shell plc, Tata Consultancy Services Ltd., and TotalEnergies SE
-
We can help! Our analysts can customize this generative AI in oil and gas market research report to meet your requirements.
 RIA -
RIA - 
