Generative AI In Trading Market Size 2025-2029
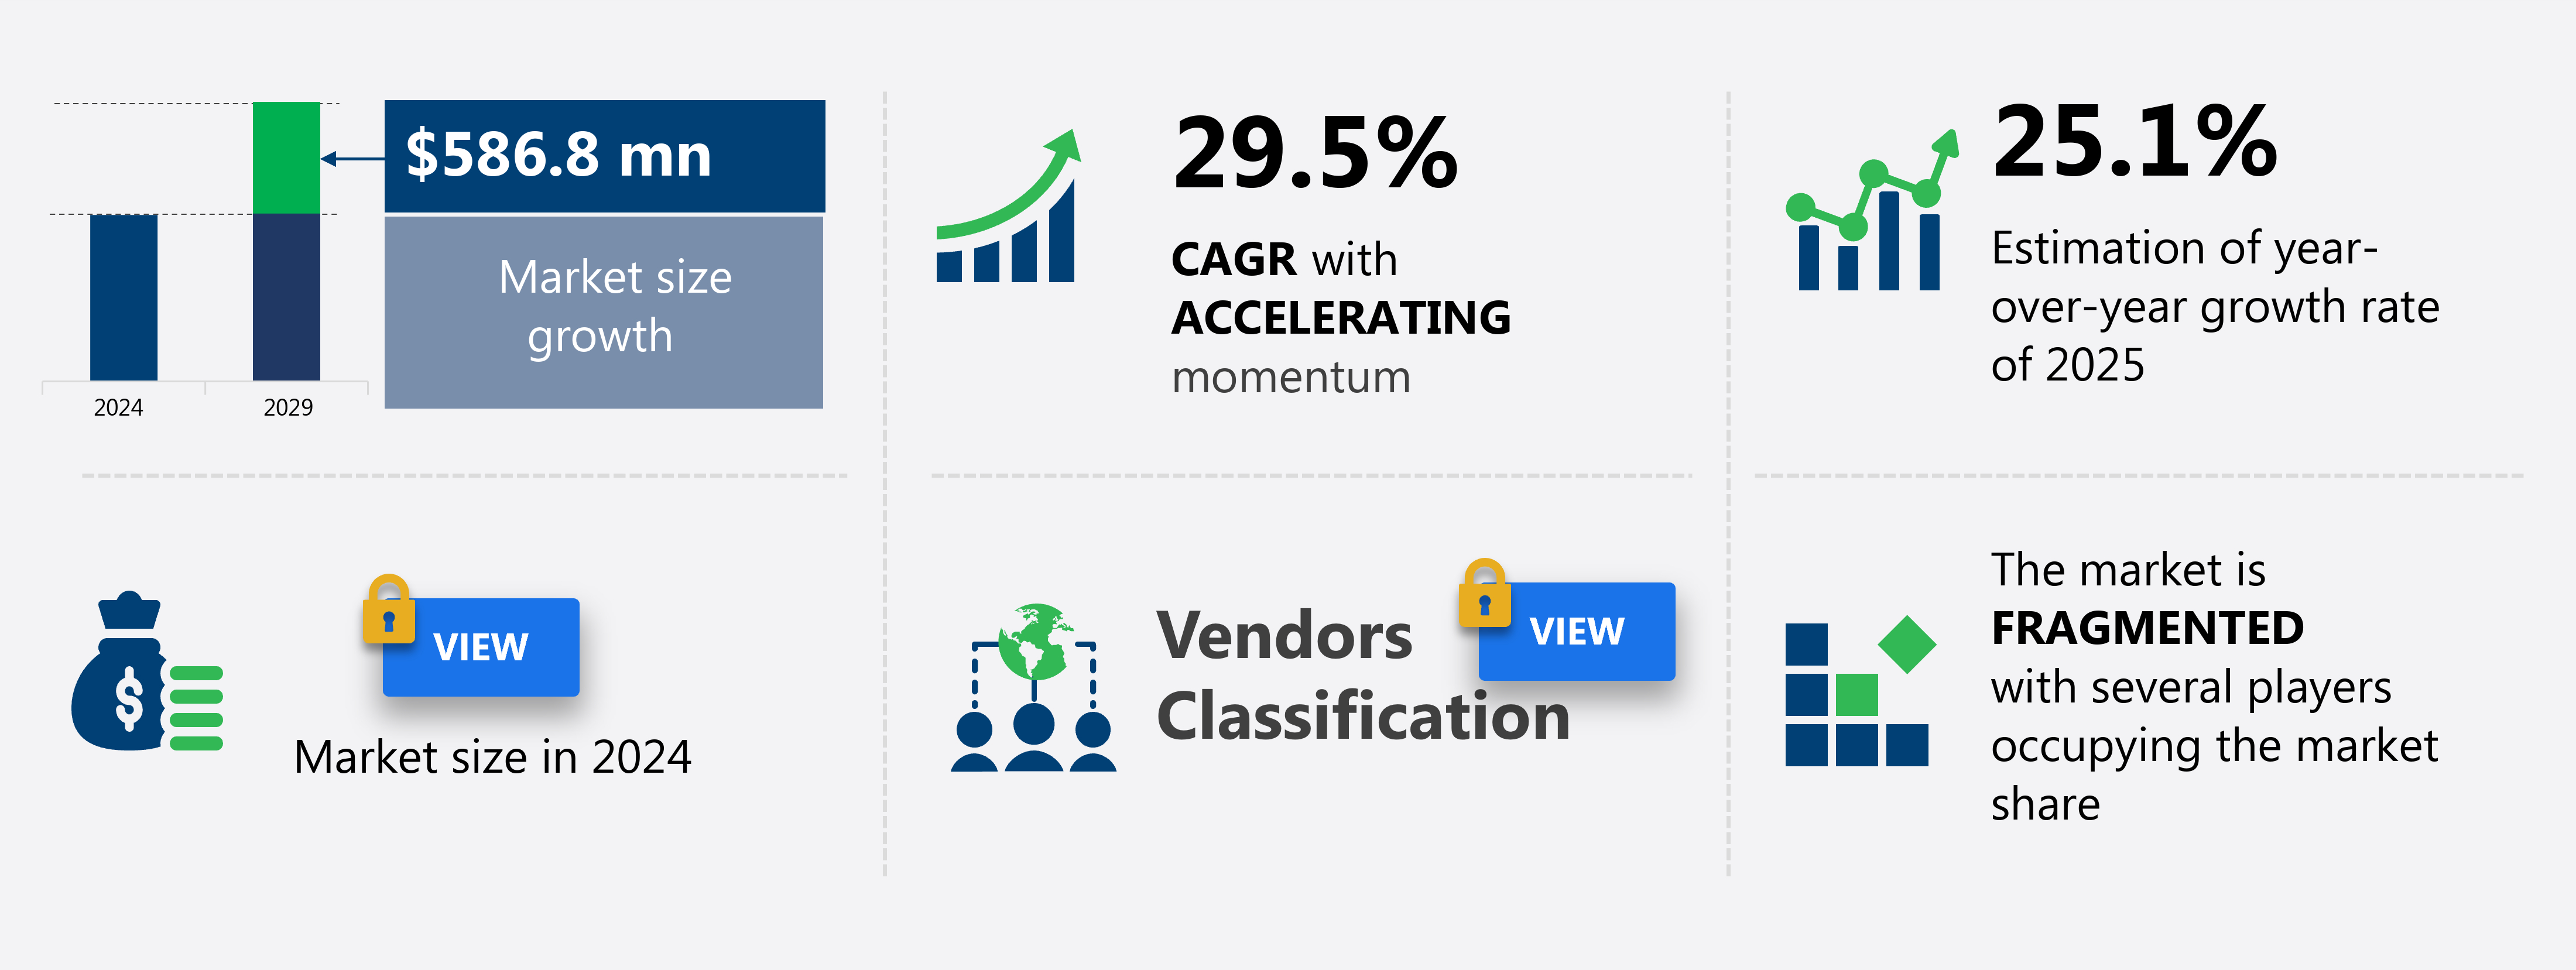
The generative ai in trading market size is valued to increase by USD 586.8 million, at a CAGR of 29.5% from 2024 to 2029. Imperative for alpha generation through advanced unstructured data analysis will drive the generative AI in trading market.
Major Market Trends & Insights
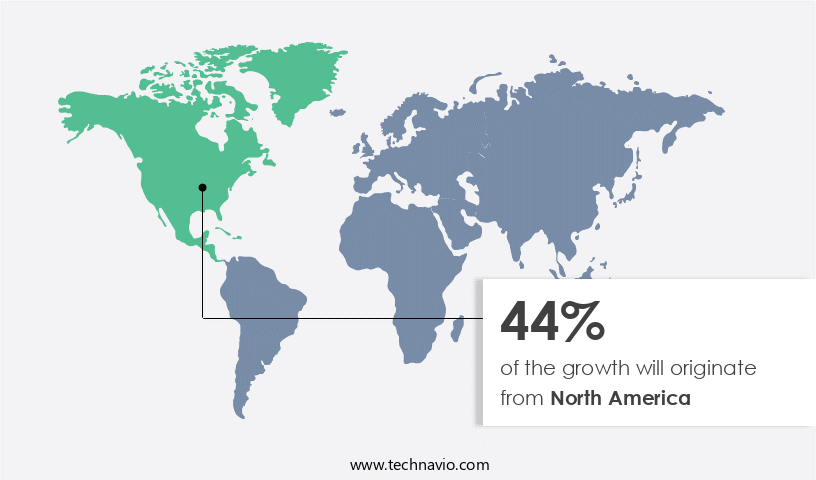
- North America dominated the market and accounted for a 44% growth during the forecast period.
- By Type - Financial data generation segment accounted for the largest market revenue share in 2023
- CAGR from 2024 to 2029: 29.5%
Market Summary
- In the dynamic realm of financial markets, Generative AI (Artificial Intelligence) has emerged as a game-changer, revolutionizing trading strategies and advisory services. This advanced technology, which can generate human-like text based on data inputs, is increasingly being adopted for its ability to process vast amounts of unstructured data and derive actionable insights. According to a recent study, the market is projected to reach a value of USD 3.6 billion by 2026, growing at a steady pace. The primary drivers of this market's growth are the imperatives for alpha generation and hyper-personalization. Traders and investors are constantly seeking an edge in the market, and Generative AI's ability to analyze unstructured data and generate customized trading strategies is proving invaluable.
- Moreover, the technology's capacity for real-time analysis and adaptability to changing market conditions is crucial in today's fast-paced financial environment. However, the adoption of Generative AI in trading is not without challenges. Navigating data security, privacy, and high fidelity data is imperative, as the technology relies on vast amounts of sensitive financial information. Ensuring the security and privacy of this data while maintaining its accuracy is a significant concern for market participants. Despite these challenges, the future of Generative AI in trading looks promising, with continued innovation and advancements expected to address these concerns and unlock new opportunities.
What will be the Size of the Generative AI In Trading Market during the forecast period?
Get Key Insights on Market Forecast (PDF) Request Free Sample
How is the Generative AI In Trading Market Segmented and what are the key trends of market segmentation?
The generative AI in trading industry research report provides comprehensive data (region-wise segment analysis), with forecasts and estimates in "USD million" for the period 2025-2029, as well as historical data from 2019-2023 for the following segments.
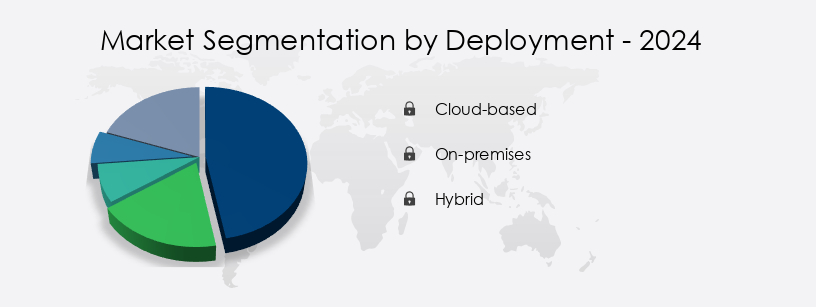
- Deployment
- Cloud-based
- On-premises
- Hybrid
- Type
- Financial data generation
- Market simulation
- Application
- Portfolio optimization
- Risk assessment and management
- Trading strategy development
- Client servicing and personalization
- Others
- Geography
- North America
- US
- Canada
- Europe
- France
- Germany
- UK
- APAC
- Australia
- China
- India
- Japan
- South Korea
- Rest of World (ROW)
- North America
By Deployment Insights
The cloud-based segment is estimated to witness significant growth during the forecast period.
The cloud-based segment of the market is experiencing exponential growth, driven by its ability to offer unmatched scalability, cost savings, and accelerated development cycles. Financial institutions, from agile fintech startups to established asset management firms, are increasingly adopting public cloud infrastructure to train, backtest, and deploy advanced generative AI models. These models, which include predictive models, sentiment analysis tools, and anomaly detection systems, perform intricate tasks such as generating synthetic market data, creating nuanced market commentary, and uncovering subtle alpha-generating patterns from extensive unstructured datasets, like news, social media, and regulatory filings.
Technological advancements, including GPU acceleration, parallel computing, and distributed computing, further fuel the market's expansion. Additionally, the integration of explainable AI and reinforcement learning strategies enhances model interpretability and improves overall trading performance.
Regional Analysis
North America is estimated to contribute 44% to the growth of the global market during the forecast period. Technavio's analysts have elaborately explained the regional trends and drivers that shape the market during the forecast period.
See How Generative AI In Trading Market Demand is Rising in North America Request Free Sample
The generative artificial intelligence (AI) in trading market is witnessing significant growth and transformation, with North America leading the global landscape. This region's dominance is driven by the presence of leading technology corporations, sophisticated capital markets, a vibrant venture capital ecosystem, and a regulatory environment that encourages innovation. The United States, specifically, is home to pioneering model developers like OpenAI, Google, and Anthropic, as well as essential hardware providers such as NVIDIA, whose graphics processing units underpin modern AI infrastructure.
According to recent studies, the North American market is expected to account for over 45% of the market share by 2027, up from approximately 40% in 2022. Europe is projected to follow closely behind, with a market share of around 30% over the same period. These figures underscore the dynamic and evolving nature of this market, which continues to redefine the trading industry.
Market Dynamics
Our researchers analyzed the data with 2024 as the base year, along with the key drivers, trends, and challenges. A holistic analysis of drivers will help companies refine their marketing strategies to gain a competitive advantage.
The market is witnessing significant growth as financial institutions increasingly adopt advanced AI technologies to enhance their trading capabilities. Generative models for option pricing and reinforcement learning for algorithmic trading are revolutionizing the finance industry, enabling more accurate pricing and efficient trading strategies. Deep learning for high-frequency trading and natural language processing for financial news are also transforming the landscape, providing real-time insights and predictions based on vast amounts of data. AI-driven portfolio optimization strategies are becoming increasingly popular, with machine learning algorithms capable of analyzing vast datasets to identify trends, correlations, and anomalies. In addition, AI is being used for fraud detection in finance, with explainable AI models ensuring transparency and accountability in decision-making.
Model interpretability in financial risk management is also crucial, as AI models must be understandable to both technical and non-technical stakeholders. Synthetic data generation for financial modeling and transfer learning applications in quantitative finance are further expanding the scope of AI in trading. Federated learning for privacy-preserving trading and cloud-based AI infrastructure for trading platforms are addressing concerns around data security and scalability. GPU-accelerated deep learning for financial markets and parallel computing for high-throughput trading are enhancing computational power, while big data analytics and data mining techniques for algorithmic trading provide valuable insights for informed decision-making. Database management for financial time series data is essential for effective AI implementation, with AI-powered order execution algorithms and sentiment analysis for market timing decisions further streamlining the trading process.
The integration of AI in trading is not only transforming the way financial institutions operate but also leading to increased efficiency, accuracy, and competitiveness. According to recent studies, more than 70% of financial institutions plan to increase their investment in AI technologies in the next five years. This underscores the growing importance of AI in trading and the significant opportunities it presents for innovation and growth.
What are the key market drivers leading to the rise in the adoption of Generative AI In Trading Industry?
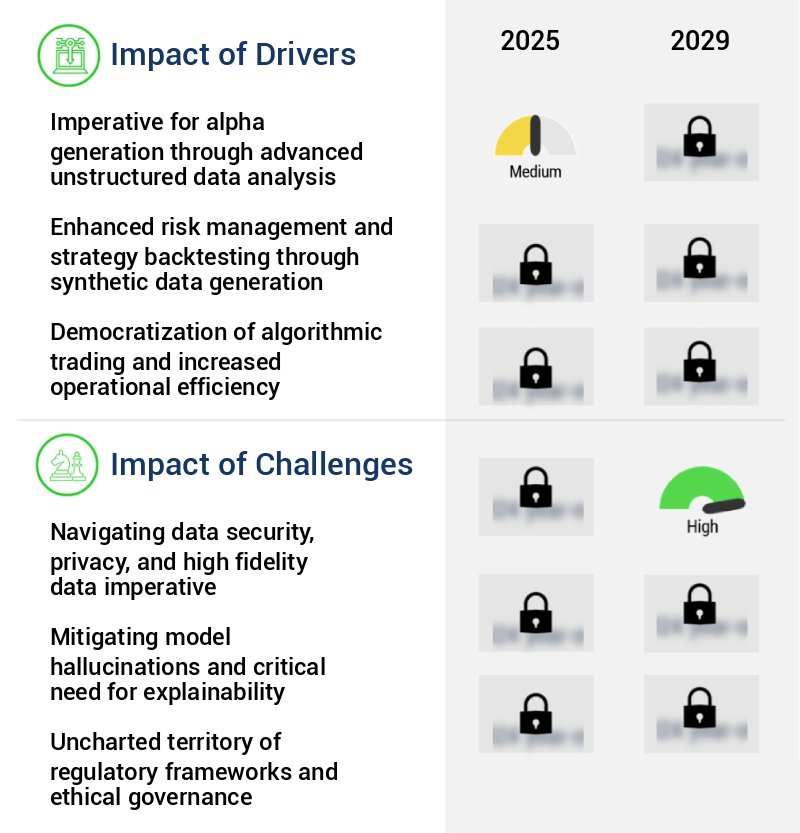
- The imperative need for alpha generation through advanced unstructured data analysis serves as the primary market driver. By harnessing the power of unstructured data using sophisticated techniques, investors and financial institutions can uncover valuable insights and make informed decisions, ultimately fueling market growth.
- The market is witnessing a surge due to the escalating demand for alpha in the financial sector. Traditional quantitative models, which primarily rely on structured market data, are experiencing diminishing returns in the increasingly efficient and competitive financial landscape. The competitive edge, or alpha, is now frequently discovered within vast and complex unstructured datasets, including news articles, regulatory filings, social media sentiment, satellite imagery, and earnings call transcripts. Generative AI, specifically large language models (LLMs), presents a paradigm shift in the ability of trading firms to ingest, comprehend, and derive actionable intelligence from this previously untapped reservoir of information.
- According to recent studies, the unstructured data market in the financial sector is projected to grow at a robust rate, reaching over 1.2 exabytes per day by 2025. LLMs have shown remarkable capabilities in processing and generating insights from this data, enabling firms to make informed decisions and gain a competitive edge.
What are the market trends shaping the Generative AI In Trading Industry?
- The trend in financial markets is shifting towards hyper-personalized trading strategies and advisory services. Hyper-personalization refers to the customization of investment approaches based on individual client needs and preferences.
- The market represents a paradigm shift in the financial sector, moving beyond conventional algorithmic models and robo-advisors. This evolution is characterized by the adoption of sophisticated generative AI systems capable of personalizing trading strategies and financial advisory services. These advanced language models and content generation capabilities enable financial institutions to tailor solutions based on an individual's financial profile, risk tolerance, behavioral biases, and long-term objectives.
- The core strength lies in the ability to process and synthesize extensive datasets, including transaction history, stated preferences, real-time market data, and macroeconomic indicators, to create dynamic and adaptive trading strategies. This trend signifies a robust and growing market, offering significant potential for enhancing the trading experience and optimizing investment outcomes.
What challenges does the Generative AI In Trading Industry face during its growth?
- Ensuring data security, privacy, and maintaining high-fidelity data are essential requirements that pose a significant challenge to the industry's growth. Navigating these complexities is a critical responsibility for professionals in this field.
- The integration of generative artificial intelligence (AI) into the global trading market signifies a significant shift in data-driven decision-making processes. Large language models and diffusion models, specifically those adapted for market prediction, rely on extensive, high-quality datasets for training and refinement. In the financial trading sector, the application of generative AI presents a complex challenge, as it involves managing data security, privacy, and integrity. Financial data is a valuable and confidential asset, comprising not only public market information but also proprietary order flow data, trading strategies, client positions, and risk management parameters. The importance of data in generative AI trading systems is underscored by recent studies, which suggest that up to 80% of trading firms are actively investing in AI and machine learning technologies.
- Furthermore, the market is projected to reach a value of USD 1.5 billion by 2027, growing at a robust pace.
Exclusive Technavio Analysis on Customer Landscape
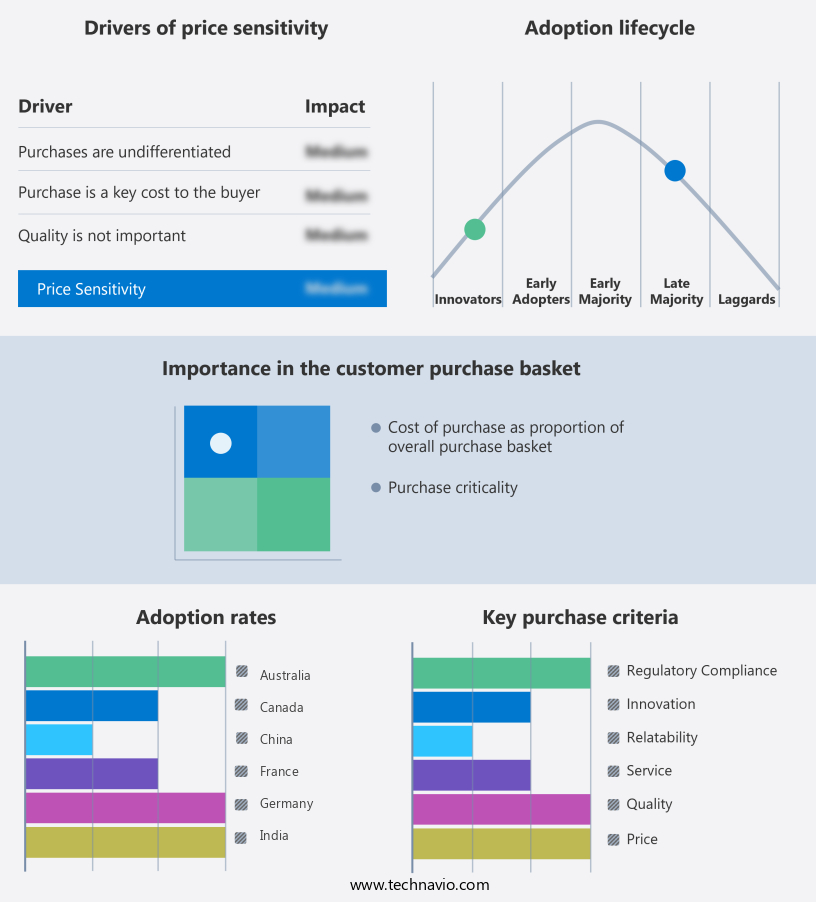
The generative AI in trading market forecasting report includes the adoption lifecycle of the market, covering from the innovator's stage to the laggard's stage. It focuses on adoption rates in different regions based on penetration. Furthermore, the generative AI in trading market report also includes key purchase criteria and drivers of price sensitivity to help companies evaluate and develop their market growth analysis strategies.
Customer Landscape of Generative AI In Trading Industry
Competitive Landscape
Companies are implementing various strategies, such as strategic alliances, generative ai in trading market forecast, partnerships, mergers and acquisitions, geographical expansion, and product/service launches, to enhance their presence in the industry.
Accenture PLC - The GenAI Center of Excellence and Sovereign AI Cloud by this company revolutionize trading through generative AI. Co-pilot agents enhance risk modeling, compliance, and investment strategy optimization, offering advanced solutions for businesses in the financial sector.
The industry research and growth report includes detailed analyses of the competitive landscape of the market and information about key companies, including:
- Accenture PLC
- AlphaSense Inc.
- Amazon Web Services Inc.
- Anthropic
- Auquan
- Bloomberg LP
- Capitalise.ai Ltd.
- Google LLC
- Hebbia Inc
- Infosys Ltd.
- International Business Machines Corp.
- Microsoft Corp.
- NVIDIA Corp.
- Rockalpha Ltd.
- Serendib Labs Technologies Pvt Ltd.
- Symphony Innovation LLC
Qualitative and quantitative analysis of companies has been conducted to help clients understand the wider business environment as well as the strengths and weaknesses of key industry players. Data is qualitatively analyzed to categorize companies as pure play, category-focused, industry-focused, and diversified; it is quantitatively analyzed to categorize companies as dominant, leading, strong, tentative, and weak.
Recent Development and News in Generative AI In Trading Market
- In January 2024, Goldman Sachs, a leading global investment bank, announced the launch of its new Quantitative Strategies & Analytics (QSA) team, which focuses on implementing generative AI models to enhance trading strategies (Goldman Sachs Press Release).
- In March 2024, JPMorgan Chase & Co. revealed a collaboration with Descartes Labs, a leading geospatial analytics firm, to integrate generative AI into their commodity trading operations, aiming to optimize logistics and improve market insights (JPMorgan Chase & Co. Press Release).
- In April 2024, NVIDIA, a leading technology company, raised USD 500 million in a funding round to accelerate the development and deployment of AI and data center technologies, including generative AI models for trading applications (NVIDIA Press Release).
- In May 2025, the Securities and Exchange Commission (SEC) approved the use of generative AI models in high-frequency trading, marking a significant regulatory milestone for the industry (SEC Press Release). These developments underscore the growing importance of generative AI in trading, with major financial institutions investing in technology, forming strategic partnerships, and securing regulatory approval to enhance their trading capabilities.
Dive into Technavio's robust research methodology, blending expert interviews, extensive data synthesis, and validated models for unparalleled Generative AI In Trading Market insights. See full methodology.
|
Market Scope |
|
|
Report Coverage |
Details |
|
Page number |
234 |
|
Base year |
2024 |
|
Historic period |
2019-2023 |
|
Forecast period |
2025-2029 |
|
Growth momentum & CAGR |
Accelerate at a CAGR of 29.5% |
|
Market growth 2025-2029 |
USD 586.8 million |
|
Market structure |
Fragmented |
|
YoY growth 2024-2025(%) |
25.1 |
|
Key countries |
US, Canada, China, Japan, India, Australia, South Korea, UK, Germany, and France |
|
Competitive landscape |
Leading Companies, Market Positioning of Companies, Competitive Strategies, and Industry Risks |
Research Analyst Overview
- In the dynamic and complex world of finance, Generative AI is revolutionizing trading markets by enhancing data analysis and prediction capabilities. This cutting-edge technology employs data augmentation techniques to expand the scope of financial datasets, enabling more nuanced insights. For instance, GPU acceleration significantly increases the speed of model training, allowing for real-time predictive modeling and model deployment. Cloud computing and distributed computing further facilitate the integration and implementation of these advanced financial models. Model interpretability is crucial in this context, ensuring that trading decisions are based on clear, explainable insights. Sentiment analysis, a critical application of AI in trading, provides valuable context to market trends and investor sentiment.
- Generative models have also made strides in AI-powered order execution, ensuring optimal trade execution based on real-time market conditions. Database management and anomaly detection are other areas where AI is making a significant impact, enhancing risk management and fraud prevention. High-frequency trading and algorithmic trading signals are increasingly relying on AI for real-time analysis and decision-making. Parallel computing and edge computing further optimize the performance of these systems, while transfer learning enables the application of existing knowledge to new financial models. The integration of reinforcement learning and federated learning into finance is driving the development of AI-driven trading strategies, allowing for more effective portfolio optimization.
- Big data and data mining are also key applications of AI in finance, providing valuable insights from vast datasets. In the realm of finance, Generative AI is continuously evolving and pushing the boundaries of what's possible. According to a recent study, AI-driven trading strategies accounted for approximately 20% of total trading volume in the US equity market. This data underscores the growing importance of AI in finance and its potential to transform the industry.
What are the Key Data Covered in this Generative AI In Trading Market Research and Growth Report?
-
What is the expected growth of the Generative AI In Trading Market between 2025 and 2029?
-
USD 586.8 million, at a CAGR of 29.5%
-
-
What segmentation does the market report cover?
-
The report segmented by Deployment (Cloud-based, On-premises, and Hybrid), Type (Financial data generation and Market simulation), Application (Portfolio optimization, Risk assessment and management, Trading strategy development, Client servicing and personalization, and Others), and Geography (North America, APAC, Europe, South America, and Middle East and Africa)
-
-
Which regions are analyzed in the report?
-
North America, APAC, Europe, South America, and Middle East and Africa
-
-
What are the key growth drivers and market challenges?
-
Imperative for alpha generation through advanced unstructured data analysis, Navigating data security, privacy, and high fidelity data imperative
-
-
Who are the major players in the Generative AI In Trading Market?
-
Key Companies Accenture PLC, AlphaSense Inc., Amazon Web Services Inc., Anthropic, Auquan, Bloomberg LP, Capitalise.ai Ltd., Google LLC, Hebbia Inc, Infosys Ltd., International Business Machines Corp., Microsoft Corp., NVIDIA Corp., Rockalpha Ltd., Serendib Labs Technologies Pvt Ltd., and Symphony Innovation LLC
-
Market Research Insights
- In the dynamic world of financial markets, generative AI is revolutionizing trading strategies by enhancing execution quality and optimizing performance. Algorithmic trading platforms leverage AI to analyze order books, predict financial market trends, and generate trading signals. Two key performance metrics, the Sortino Ratio and the Sharpe Ratio, illustrate the impact. For instance, a trading strategy employing AI-based risk assessment achieved a Sortino Ratio of 1.5, signifying that for every unit of downside risk, the strategy generated 1.5 units of reward. Meanwhile, a traditional strategy yielded a Sortino Ratio of 0.8. The Sharpe Ratio, which measures risk-adjusted return, demonstrated an improvement as well, with the AI-driven strategy boasting a Sharpe Ratio of 1.2 compared to the traditional strategy's 0.8.
- These enhancements are not limited to equities; they extend to futures, cryptocurrencies, and other asset classes. AI-driven trading systems employ machine learning models like statistical arbitrage, mean reversion, and momentum trading strategies, optimizing portfolio performance and minimizing transaction costs. Through model selection, validation, and backtesting, these systems continually refine their strategies, adapting to ever-changing market conditions.
We can help! Our analysts can customize this generative AI in trading market research report to meet your requirements.
 RIA -
RIA - 
