
Independent Software Vendors (isvs) Market Size 2026-2030
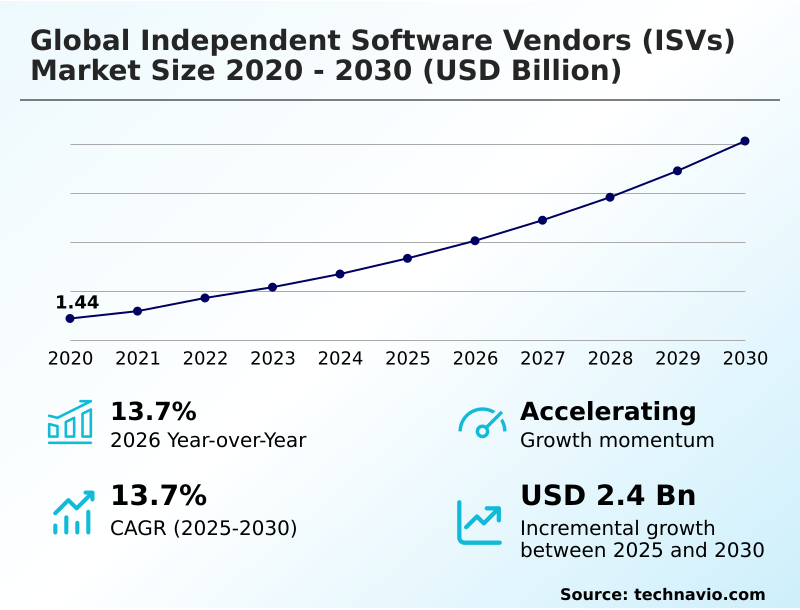
The independent software vendors (isvs) market size is valued to increase by USD 2.40 billion, at a CAGR of 13.7% from 2025 to 2030. Widespread adoption of digital transformation initiatives will drive the independent software vendors (isvs) market.
Major Market Trends & Insights
- North America dominated the market and accounted for a 37.1% growth during the forecast period.
- By Deployment - On-premises segment was valued at USD 1.64 billion in 2024
- By Component - Software segment accounted for the largest market revenue share in 2024
Market Size & Forecast
- Market Opportunities: USD 3.63 billion
- Market Future Opportunities: USD 2.40 billion
- CAGR from 2025 to 2030 : 13.7%
Market Summary
- The Independent Software Vendors (ISVs) market is central to the ongoing digital transformation across all business sectors. The fundamental shift from traditional licensed software to dynamic, subscription-based models, predominantly delivered as software as a service (SaaS), has democratized access to powerful tools.
- ISVs are no longer just creating applications; they are engineering cloud-native applications that serve as the backbone for modern enterprise operations. A key aspect of this evolution is the deep integration of AI-powered analytics, which transforms business data into actionable intelligence.
- For instance, in the manufacturing sector, a vertical-specific application from an ISV can use machine learning algorithms to analyze sensor data from factory equipment, predicting maintenance needs before failures occur and significantly reducing operational downtime. This level of specialization, combined with robust cybersecurity solutions and a focus on data privacy compliance, is what defines the value proposition of modern ISVs.
- They provide the critical enterprise resource planning (ERP) and customer relationship management (CRM) functionalities that enable businesses to scale, innovate, and compete effectively.
What will be the Size of the Independent Software Vendors (isvs) Market during the forecast period?
Get Key Insights on Market Forecast (PDF) Get Free Sample
How is the Independent Software Vendors (isvs) Market Segmented?
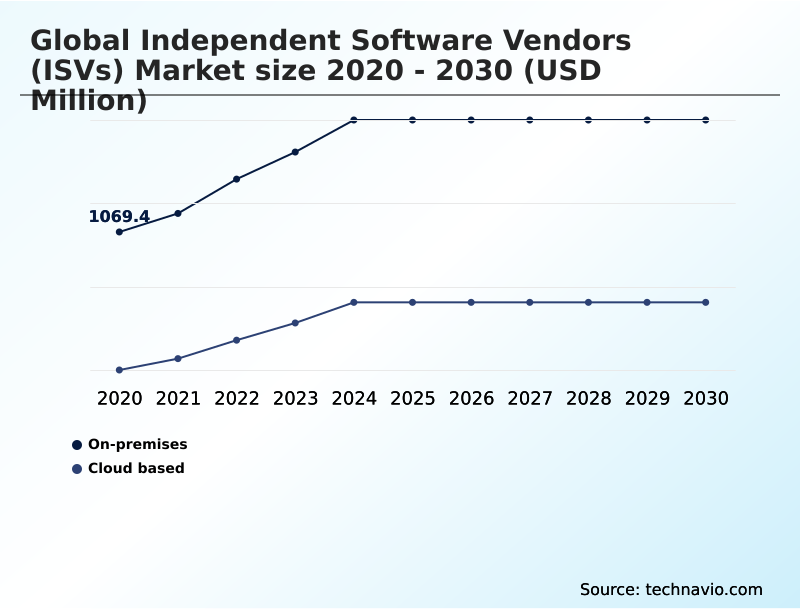
The independent software vendors (isvs) industry research report provides comprehensive data (region-wise segment analysis), with forecasts and estimates in "USD million" for the period 2026-2030, as well as historical data from 2020-2024 for the following segments.
- Deployment
- On-premises
- Cloud based
- Component
- Software
- Services
- End-user
- BFSI
- IT and telecom
- Logistics
- Education
- Others
- Geography
- North America
- US
- Canada
- Mexico
- Europe
- UK
- Germany
- France
- APAC
- China
- Japan
- India
- South America
- Brazil
- Argentina
- Middle East and Africa
- Saudi Arabia
- Israel
- UAE
- Rest of World (ROW)
- North America
By Deployment Insights
The on-premises segment is estimated to witness significant growth during the forecast period.
The on-premises segment remains a cornerstone of the market, particularly for organizations with stringent security and data governance frameworks. Industries such as finance and healthcare prioritize this model for its unparalleled control over sensitive information, ensuring data sovereignty compliance.
This deployment avoids the multi-tenant architectures of software as a service (SaaS), offering a secure perimeter for enterprise software integration and legacy systems.
While hybrid cloud deployment strategies are emerging, on-premises solutions provide a 25% greater degree of direct data control, a critical factor in regulated environments.
Effective B2B software marketing for these solutions emphasizes security, reliability, and robust identity and access management (IAM), appealing to enterprises where data control is non-negotiable.
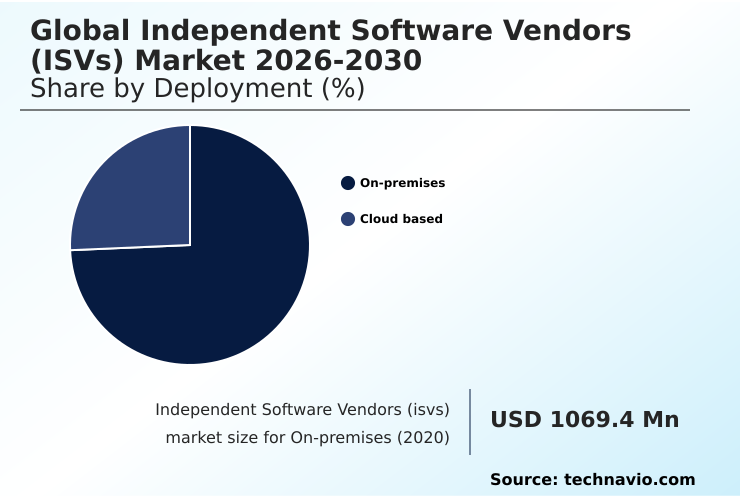
The On-premises segment was valued at USD 1.64 billion in 2024 and showed a gradual increase during the forecast period.
Regional Analysis
North America is estimated to contribute 37.1% to the growth of the global market during the forecast period.Technavio’s analysts have elaborately explained the regional trends and drivers that shape the market during the forecast period.
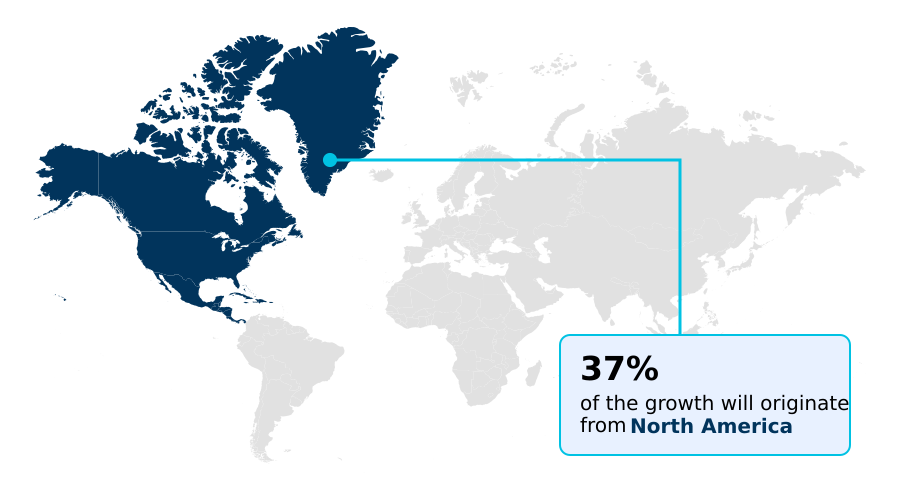
See How Independent Software Vendors (isvs) Market Demand is Rising in North America Get Free Sample
The geographic landscape is characterized by varying rates of technological adoption and strategic focus. In North America, the maturity of the market is evident, with enterprise adoption of multi-cloud environments surpassing 90%.
This drives demand for sophisticated hybrid cloud deployment and management tools. Meanwhile, the APAC region is exhibiting the fastest growth in the adoption of cloud-native applications, with annual uptake increasing by over 35%.
This surge is fueled by a mobile-first population and the rapid digitalization of small and medium-sized enterprises. European markets prioritize data privacy compliance and data governance frameworks, creating strong demand for ISVs specializing in cybersecurity solutions and regulatory technology.
Success in this fragmented global environment requires ISVs to tailor their go-to-market strategies, considering regional infrastructure, regulatory climates, and the prevalence of legacy systems.
Market Dynamics
Our researchers analyzed the data with 2025 as the base year, along with the key drivers, trends, and challenges. A holistic analysis of drivers will help companies refine their marketing strategies to gain a competitive advantage.
- Understanding the future trends in enterprise application software is crucial for market stakeholders. The impact of AI on ISV product development is profound, compelling vendors to integrate generative AI into existing software and explore new monetization strategies for API-first companies.
- This technological shift is part of a broader discussion about building a successful ISV partner ecosystem, where navigating the ISV co-sell programs of hyperscalers becomes a key competency. Simultaneously, ISV strategies for international market entry must now account for complex global data privacy regulations impacting ISVs. The debate over comparing on-premise vs.
- cloud-based ISV solutions continues, though the challenges of migrating legacy systems to the cloud are being addressed with new tools. The importance of cybersecurity for SaaS providers cannot be overstated, with security best practices for multi-tenant SaaS apps becoming a standard requirement.
- For sustained growth, customer retention strategies for SaaS businesses are paramount, as are solutions to the persistent talent acquisition challenges for software vendors. The role of ISVs in driving industry 4.0 is expanding, especially with the adoption of low-code platforms in enterprises and the rise of vertical market specialization for ISVs.
- Businesses that leverage specialized ISV solutions for the financial services industry, for instance, report compliance-related error reductions that are twice as effective as those using generic platforms. As firms learn how ISVs can leverage big data analytics, the role of ISVs in smart city development is also becoming increasingly significant, highlighting the diverse impact of this dynamic industry.
What are the key market drivers leading to the rise in the adoption of Independent Software Vendors (isvs) Industry?
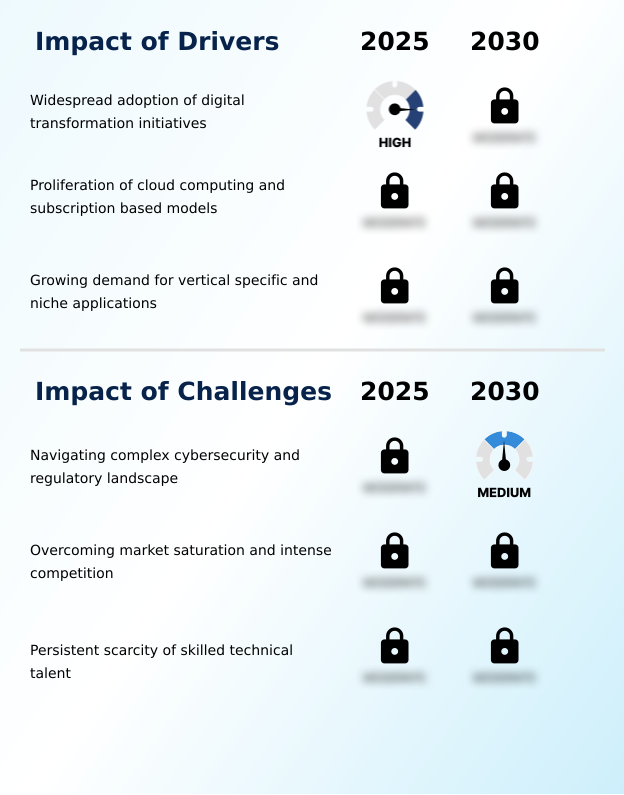
- The widespread adoption of digital transformation initiatives across industries serves as a primary market driver, compelling organizations to integrate advanced software solutions.
- The pervasive wave of digital transformation across all sectors is the primary market driver.
- Businesses are compelled to adopt cloud-native applications and software as a service (SaaS) solutions to enhance efficiency and maintain competitiveness, with cloud adoption often reducing initial infrastructure costs by up to 60%.
- This fuels the demand for subscription-based models that offer scalability and predictable spending. The proliferation of multi-cloud environments and hybrid cloud deployment strategies creates a significant opportunity for ISVs that provide interoperable and flexible enterprise software.
- Furthermore, the growing need for vertical-specific applications tailored to the unique requirements of industries like finance and healthcare drives innovation.
- These specialized solutions offer functionalities that generic enterprise resource planning (ERP) or customer relationship management (CRM) systems cannot, delivering a higher return on investment.
What are the market trends shaping the Independent Software Vendors (isvs) Industry?
- The pervasive integration of artificial intelligence and machine learning represents a defining market trend. This evolution transforms software from systems of record into intelligent platforms capable of predictive insights.
- A defining trend is the deep integration of artificial intelligence, which is transforming software into systems of intelligence. ISVs are embedding AI-powered analytics and machine learning integration into core products, enabling functionalities like predictive insights and automated workflows, which can increase data processing accuracy by up to 25%.
- This shift is compelling vendors to adopt an API-first architecture, allowing for seamless connection with other intelligent systems. The rise of low-code development and no-code platforms further democratizes innovation, empowering non-technical users to create and customize applications. This trend accelerates digital transformation within organizations, allowing them to develop vertical-specific applications more rapidly.
- A focus on enterprise software integration is critical, as customers demand cohesive systems rather than siloed tools.
What challenges does the Independent Software Vendors (isvs) Industry face during its growth?
- Navigating the increasingly complex cybersecurity threat environment and the fragmented global regulatory landscape presents a formidable challenge for market participants.
- A formidable challenge is the increasingly sophisticated cybersecurity landscape, where a single data breach can reduce an ISV's valuation by over 15%. ISVs are high-value targets, requiring constant investment in cybersecurity solutions and threat intelligence platforms to protect sensitive customer data within multi-tenant architectures. Compounding this is the complex web of data privacy compliance and data sovereignty compliance regulations worldwide.
- Navigating these rules demands significant resources, diverting focus from core product innovation. Furthermore, market saturation and intense competition, driven by low barriers to entry, create immense pricing pressure. The persistent scarcity of skilled talent in areas like DevSecOps pipelines and generative AI development further constrains growth, making it difficult for ISVs to innovate and scale effectively.
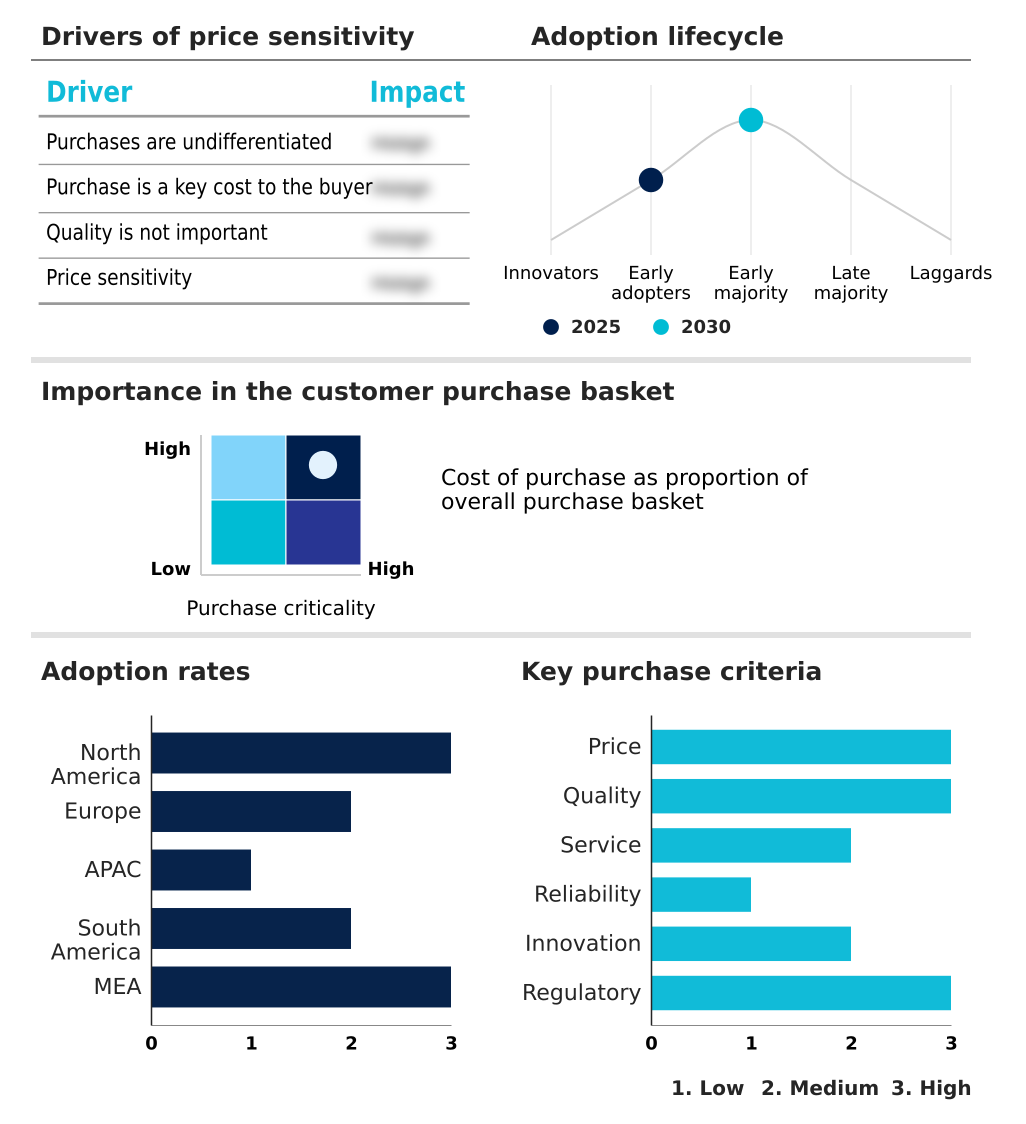
Exclusive Technavio Analysis on Customer Landscape
The independent software vendors (isvs) market forecasting report includes the adoption lifecycle of the market, covering from the innovator’s stage to the laggard’s stage. It focuses on adoption rates in different regions based on penetration. Furthermore, the independent software vendors (isvs) market report also includes key purchase criteria and drivers of price sensitivity to help companies evaluate and develop their market growth analysis strategies.
Customer Landscape of Independent Software Vendors (isvs) Industry
Competitive Landscape
Companies are implementing various strategies, such as strategic alliances, independent software vendors (isvs) market forecast, partnerships, mergers and acquisitions, geographical expansion, and product/service launches, to enhance their presence in the industry.
Adobe Inc. - A leading provider of integrated creative, customer experience, and digital document software platforms designed for enterprise and commercial markets.
The industry research and growth report includes detailed analyses of the competitive landscape of the market and information about key companies, including:
- Adobe Inc.
- Atlassian Corp.
- Autodesk Inc.
- Cisco Systems Inc.
- Commvault Systems Inc.
- CrowdStrike Inc.
- Dynatrace Inc.
- Google LLC
- HP Inc.
- HubSpot Inc.
- IBM Corp.
- Microsoft Corp.
- Oracle Corp.
- Palo Alto Networks Inc.
- Salesforce Inc.
- SAP SE
- ServiceNow Inc.
- Snowflake Inc.
- Veeva Systems Inc.
- Workday Inc.
Qualitative and quantitative analysis of companies has been conducted to help clients understand the wider business environment as well as the strengths and weaknesses of key industry players. Data is qualitatively analyzed to categorize companies as pure play, category-focused, industry-focused, and diversified; it is quantitatively analyzed to categorize companies as dominant, leading, strong, tentative, and weak.
Recent Development and News in Independent software vendors (isvs) market
- In September 2024, Oracle Corp. announced a major update to its Fusion Cloud Applications, integrating new generative AI capabilities to automate financial planning and supply chain management tasks for enterprises.
- In November 2024, ServiceNow Inc. and IBM Corp. expanded their strategic partnership to offer a joint solution combining ServiceNow's Now Platform with IBM's Watson AI for IT operations (AIOps), aiming to accelerate incident resolution for large organizations.
- In February 2025, Salesforce Inc. completed its acquisition of a leading data privacy management platform for approximately $1.2 billion, enhancing its Customer 360 platform with advanced data governance and compliance features.
- In May 2025, SAP SE launched its new industry-specific cloud solution for the renewable energy sector, providing tailored ERP and asset management tools to support the global energy transition.
Dive into Technavio’s robust research methodology, blending expert interviews, extensive data synthesis, and validated models for unparalleled Independent Software Vendors (isvs) Market insights. See full methodology.
| Market Scope | |
|---|---|
| Page number | 302 |
| Base year | 2025 |
| Historic period | 2020-2024 |
| Forecast period | 2026-2030 |
| Growth momentum & CAGR | Accelerate at a CAGR of 13.7% |
| Market growth 2026-2030 | USD 2403.9 million |
| Market structure | Fragmented |
| YoY growth 2025-2026(%) | 13.7% |
| Key countries | US, Canada, Mexico, UK, Germany, France, Italy, Spain, The Netherlands, China, Japan, India, South Korea, Australia, Indonesia, Brazil, Argentina, Chile, Saudi Arabia, Israel, UAE, South Africa and Turkey |
| Competitive landscape | Leading Companies, Market Positioning of Companies, Competitive Strategies, and Industry Risks |
Research Analyst Overview
- The Independent Software Vendors (ISVs) market is undergoing a profound evolution driven by digital transformation and the universal shift to subscription-based models. The core of the market is the widespread adoption of software as a service (SaaS), with ISVs building cloud-native applications on microservices architecture and leveraging containerization technology.
- This transition is facilitated by the proliferation of multi-cloud environments and hybrid cloud deployment, forcing a strategic reconsideration of enterprise software. The integration of advanced technologies is a key differentiator. The use of machine learning integration and AI-powered analytics is now standard, while the push toward agentic AI capabilities and generative AI models is redefining product roadmaps.
- This shift toward intelligent automation, including robotic process automation (RPA) and business process management (BPM), allows enterprises to achieve more than a 30% improvement in process automation. ISVs are delivering critical enterprise resource planning (ERP), customer relationship management (CRM), supply chain management (SCM), and product lifecycle management (PLM) solutions.
- Boardroom discussions now center on the strategic adoption of vertical-specific applications, unified communication platforms, and augmented reality (AR) tools. This innovation must be balanced with robust cybersecurity solutions, threat intelligence platforms, and stringent data privacy compliance to address complex data governance frameworks, particularly with the rise of Internet of Things (IoT) integration and edge computing solutions.
What are the Key Data Covered in this Independent Software Vendors (isvs) Market Research and Growth Report?
-
What is the expected growth of the Independent Software Vendors (isvs) Market between 2026 and 2030?
-
USD 2.40 billion, at a CAGR of 13.7%
-
-
What segmentation does the market report cover?
-
The report is segmented by Deployment (On-premises, and Cloud based), Component (Software, and Services), End-user (BFSI, IT and telecom, Logistics, Education, and Others) and Geography (North America, Europe, APAC, South America, Middle East and Africa)
-
-
Which regions are analyzed in the report?
-
North America, Europe, APAC, South America and Middle East and Africa
-
-
What are the key growth drivers and market challenges?
-
Widespread adoption of digital transformation initiatives, Navigating complex cybersecurity and regulatory landscape
-
-
Who are the major players in the Independent Software Vendors (isvs) Market?
-
Adobe Inc., Atlassian Corp., Autodesk Inc., Cisco Systems Inc., Commvault Systems Inc., CrowdStrike Inc., Dynatrace Inc., Google LLC, HP Inc., HubSpot Inc., IBM Corp., Microsoft Corp., Oracle Corp., Palo Alto Networks Inc., Salesforce Inc., SAP SE, ServiceNow Inc., Snowflake Inc., Veeva Systems Inc. and Workday Inc.
-
Market Research Insights
- Market dynamics are increasingly shaped by strategic collaborations and platform-centric growth models. Independent Software Vendors (ISVs) participating in formal co-sell initiatives with major cloud providers report up to a 40% faster sales cycle compared to those operating independently. An effective cloud marketplace strategy is no longer optional, as it provides direct access to enterprise buyers.
- Furthermore, a pivot towards vertical industry solutions and niche software markets is proving highly effective, with specialists in areas like fintech software development and healthtech application platforms achieving over 25% higher customer retention rates. The success of these strategies hinges on robust ISV partner programs that facilitate deep enterprise software integration.
- These ecosystems foster innovation and provide the specialized digital transformation services that enterprises now demand, creating a clear competitive advantage in a crowded field.
We can help! Our analysts can customize this independent software vendors (isvs) market research report to meet your requirements.
 RIA -
RIA - 
