
Liquid Yeast Market Size 2026-2030
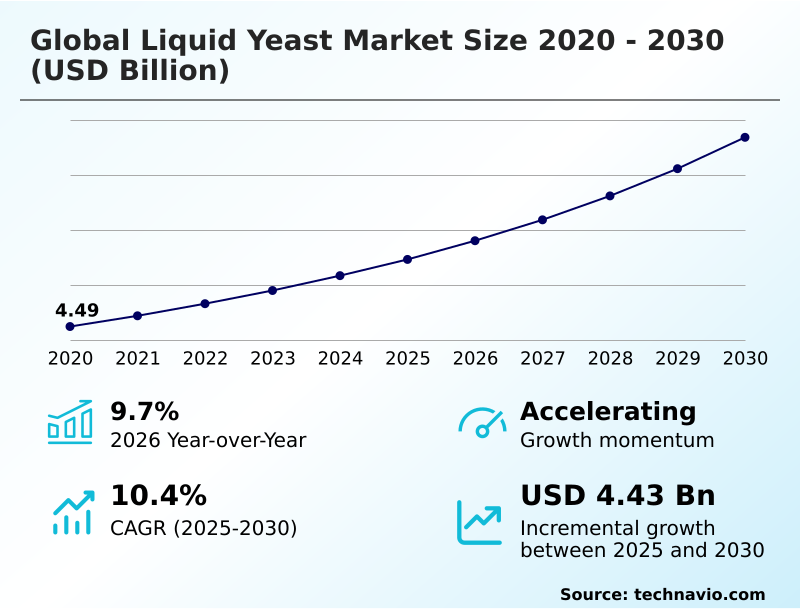
The liquid yeast market size is valued to increase by USD 4.43 billion, at a CAGR of 10.4% from 2025 to 2030. Rising adoption of automated industrial baking systems will drive the liquid yeast market.
Major Market Trends & Insights
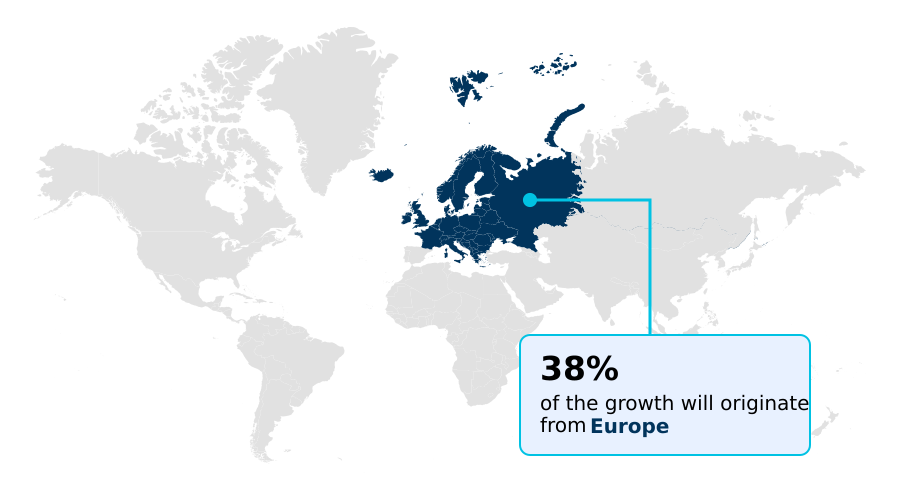
- Europe dominated the market and accounted for a 38.1% growth during the forecast period.
- By Application - Brewing yeast segment was valued at USD 3.00 billion in 2024
- By Product Type - Organic segment accounted for the largest market revenue share in 2024
Market Size & Forecast
- Market Opportunities: USD 6.88 billion
- Market Future Opportunities: USD 4.43 billion
- CAGR from 2025 to 2030 : 10.4%
Market Summary
What will be the Size of the Liquid Yeast Market during the forecast period?
Get Key Insights on Market Forecast (PDF) Get Free Sample
How is the Liquid Yeast Market Segmented?
The liquid yeast industry research report provides comprehensive data (region-wise segment analysis), with forecasts and estimates in "USD million" for the period 2026-2030, as well as historical data from 2020-2024 for the following segments.
- Application
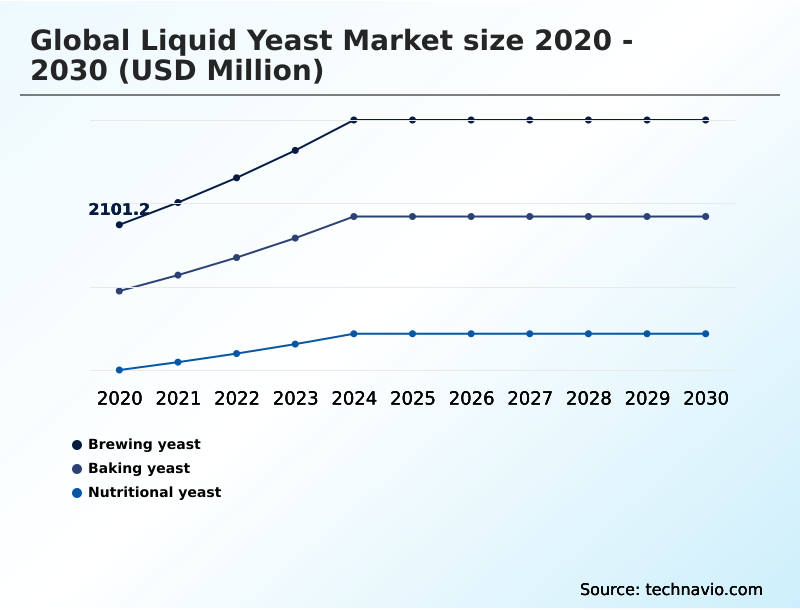
- Brewing yeast
- Baking yeast
- Nutritional yeast
- Product type
- Organic
- Non-organic
- End-user
- Industrial
- Commercial
- Household
- Geography
- Europe
- Germany
- UK
- France
- APAC
- China
- Japan
- India
- North America
- US
- Canada
- Mexico
- South America
- Brazil
- Argentina
- Colombia
- Middle East and Africa
- South Africa
- UAE
- Saudi Arabia
- Rest of World (ROW)
- Europe
By Application Insights
The brewing yeast segment is estimated to witness significant growth during the forecast period.
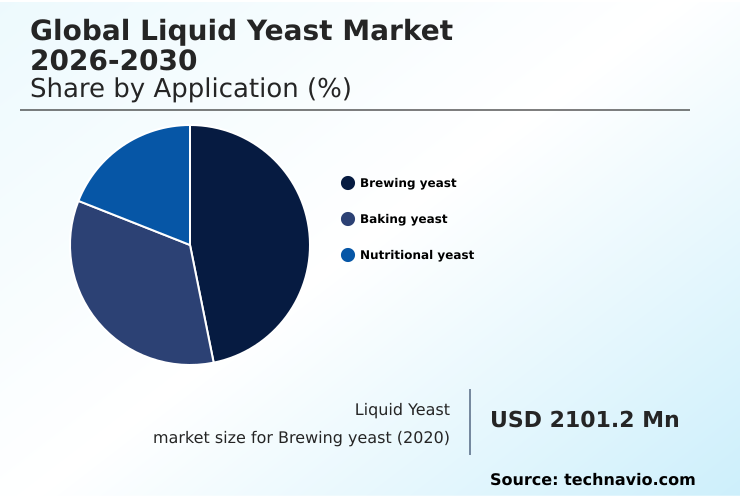
The Brewing yeast segment was valued at USD 3.00 billion in 2024 and showed a gradual increase during the forecast period.
Regional Analysis
Europe is estimated to contribute 38.1% to the growth of the global market during the forecast period.Technavio’s analysts have elaborately explained the regional trends and drivers that shape the market during the forecast period.
See How Liquid Yeast Market Demand is Rising in Europe Get Free Sample
Market Dynamics
Our researchers analyzed the data with 2025 as the base year, along with the key drivers, trends, and challenges. A holistic analysis of drivers will help companies refine their marketing strategies to gain a competitive advantage.
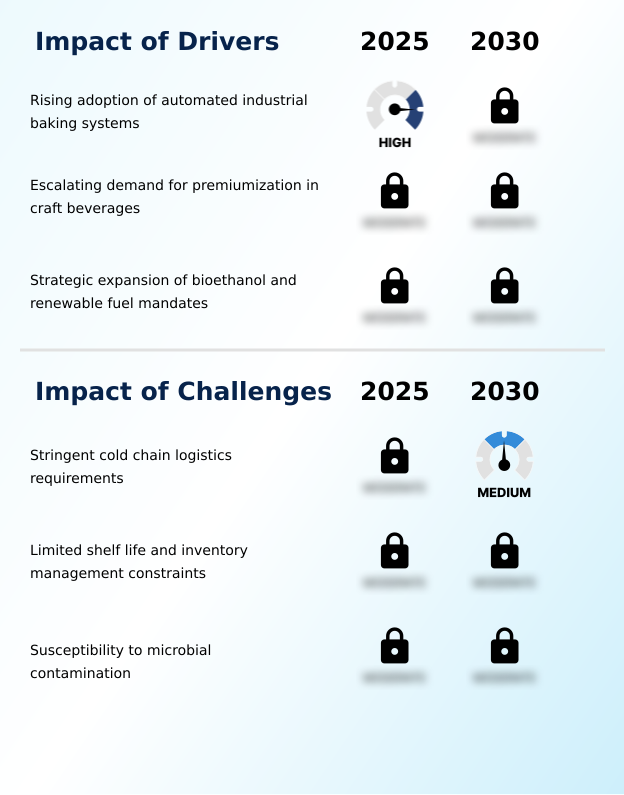
What are the key market drivers leading to the rise in the adoption of Liquid Yeast Industry?
What are the market trends shaping the Liquid Yeast Industry?
What challenges does the Liquid Yeast Industry face during its growth?
Exclusive Technavio Analysis on Customer Landscape
The liquid yeast market forecasting report includes the adoption lifecycle of the market, covering from the innovator’s stage to the laggard’s stage. It focuses on adoption rates in different regions based on penetration. Furthermore, the liquid yeast market report also includes key purchase criteria and drivers of price sensitivity to help companies evaluate and develop their market growth analysis strategies.
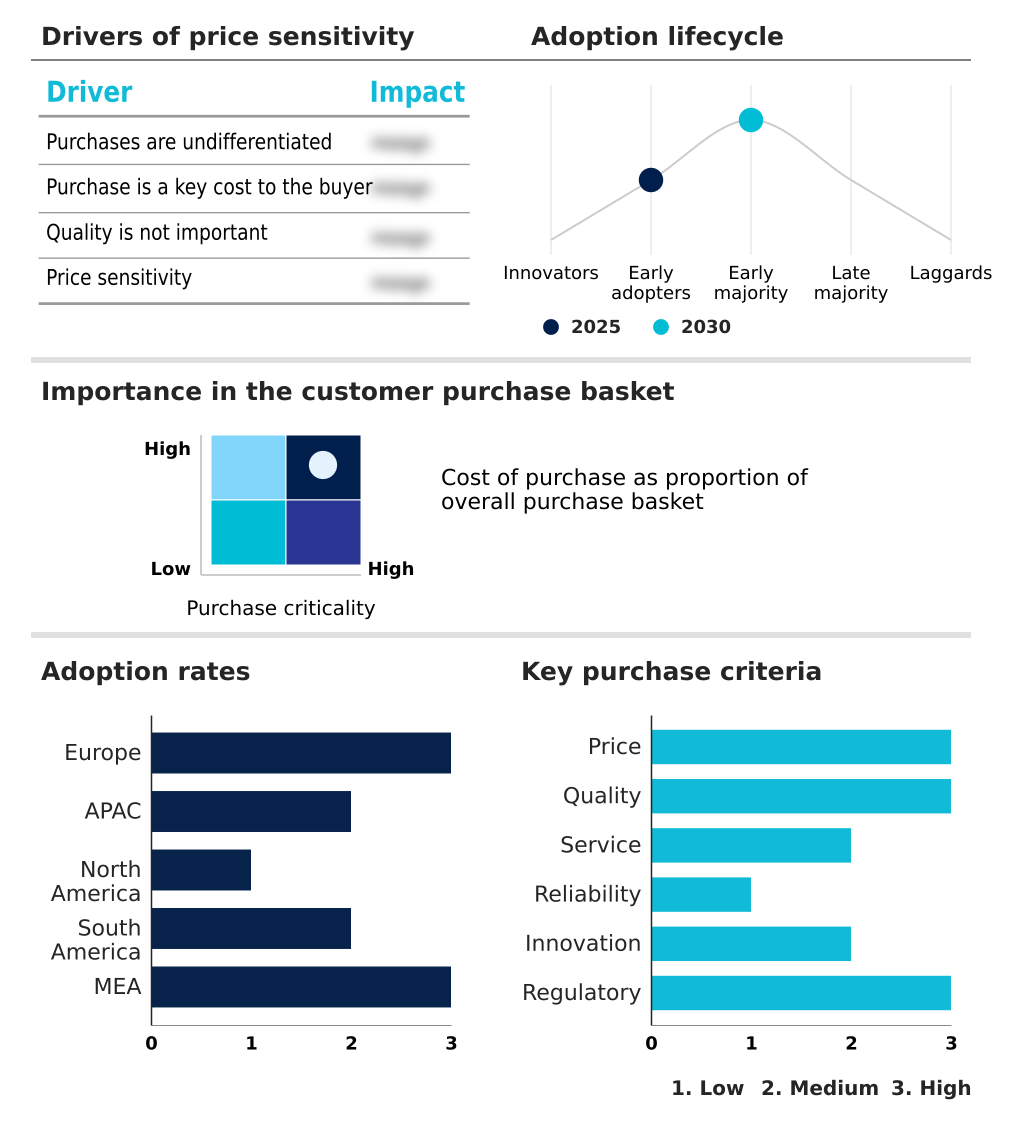
Customer Landscape of Liquid Yeast Industry
Competitive Landscape
Companies are implementing various strategies, such as strategic alliances, liquid yeast market forecast, partnerships, mergers and acquisitions, geographical expansion, and product/service launches, to enhance their presence in the industry.
Alltech Inc. -
The industry research and growth report includes detailed analyses of the competitive landscape of the market and information about key companies, including:
- Alltech Inc.
- Angel Yeast Co. Ltd.
- Archer Daniels Midland Co.
- Associated British Foods Plc
- Bluestone Yeast Co.
- Chr Hansen AS
- DSM Firmenich AG
- Escarpment Laboratories
- Imperial Yeast
- Inland Island Yeast Laboratories
- Kerry Group Plc
- Lallemand Inc.
- Leiber GmbH
- Lesaffre and Cie
- Mangrove Jacks
- Omega Yeast Labs LLC
- White Labs
- Wyeast Laboratories Inc.
Qualitative and quantitative analysis of companies has been conducted to help clients understand the wider business environment as well as the strengths and weaknesses of key industry players. Data is qualitatively analyzed to categorize companies as pure play, category-focused, industry-focused, and diversified; it is quantitatively analyzed to categorize companies as dominant, leading, strong, tentative, and weak.
Recent Development and News in Liquid yeast market
Dive into Technavio’s robust research methodology, blending expert interviews, extensive data synthesis, and validated models for unparalleled Liquid Yeast Market insights. See full methodology.
| Market Scope | |
|---|---|
| Page number | 291 |
| Base year | 2025 |
| Historic period | 2020-2024 |
| Forecast period | 2026-2030 |
| Growth momentum & CAGR | Accelerate at a CAGR of 10.4% |
| Market growth 2026-2030 | USD 4434.0 million |
| Market structure | Fragmented |
| YoY growth 2025-2026(%) | 9.7% |
| Key countries | Germany, UK, France, Italy, Spain, The Netherlands, China, Japan, India, South Korea, Australia, Indonesia, US, Canada, Mexico, Brazil, Argentina, Colombia, South Africa, UAE, Saudi Arabia, Egypt and Turkey |
| Competitive landscape | Leading Companies, Market Positioning of Companies, Competitive Strategies, and Industry Risks |
Research Analyst Overview
What are the Key Data Covered in this Liquid Yeast Market Research and Growth Report?
-
What is the expected growth of the Liquid Yeast Market between 2026 and 2030?
-
USD 4.43 billion, at a CAGR of 10.4%
-
-
What segmentation does the market report cover?
-
The report is segmented by Application (Brewing yeast, Baking yeast, and Nutritional yeast), Product Type (Organic, and Non-organic), End-user (Industrial, Commercial, and Household) and Geography (Europe, APAC, North America, South America, Middle East and Africa)
-
-
Which regions are analyzed in the report?
-
Europe, APAC, North America, South America and Middle East and Africa
-
-
What are the key growth drivers and market challenges?
-
Rising adoption of automated industrial baking systems, Stringent cold chain logistics requirements
-
-
Who are the major players in the Liquid Yeast Market?
-
Alltech Inc., Angel Yeast Co. Ltd., Archer Daniels Midland Co., Associated British Foods Plc, Bluestone Yeast Co., Chr Hansen AS, DSM Firmenich AG, Escarpment Laboratories, Imperial Yeast, Inland Island Yeast Laboratories, Kerry Group Plc, Lallemand Inc., Leiber GmbH, Lesaffre and Cie, Mangrove Jacks, Omega Yeast Labs LLC, White Labs and Wyeast Laboratories Inc.
-
Market Research Insights
We can help! Our analysts can customize this liquid yeast market research report to meet your requirements.
 RIA -
RIA - 
