
Poly (lactic-co-glycolic Acid) (PLGA) Market Analysis, Size, and Forecast 2026-2030: North America (US, Canada, and Mexico), Europe (Germany, UK, and France), APAC (China, Japan, and India), South America (Brazil, Argentina, and Chile), Middle East and Africa (Saudi Arabia, UAE, and South Africa), and Rest of World (ROW)

Poly (lactic-co-glycolic Acid) (PLGA) Market Analysis, Size, and Forecast 2026-2030:
North America (US, Canada, and Mexico), Europe (Germany, UK, and France), APAC (China, Japan, and India), South America (Brazil, Argentina, and Chile), Middle East and Africa (Saudi Arabia, UAE, and South Africa), and Rest of World (ROW)

Published: Oct 2026 317 Pages SKU: IRTNTR75026

Market Overview at a Glance

$172.10 Mn
Market Opportunity
9.9%
CAGR 2025 - 2030
39.3%
North America Growth
$98.47 Mn
Personal care and dermatology segment 2024

Poly (Lactic-Co-Glycolic Acid) (Plga) Market Size 2026-2030

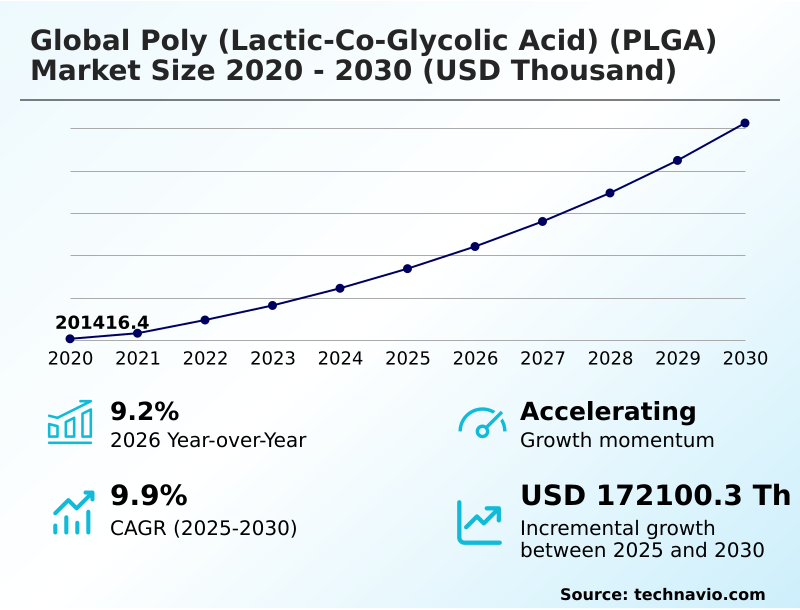
The poly (lactic-co-glycolic acid) (plga) market size is valued to increase by USD 172.10 million, at a CAGR of 9.9% from 2025 to 2030. Expanding long acting injectable drug demand will drive the poly (lactic-co-glycolic acid) (plga) market.

Major Market Trends & Insights

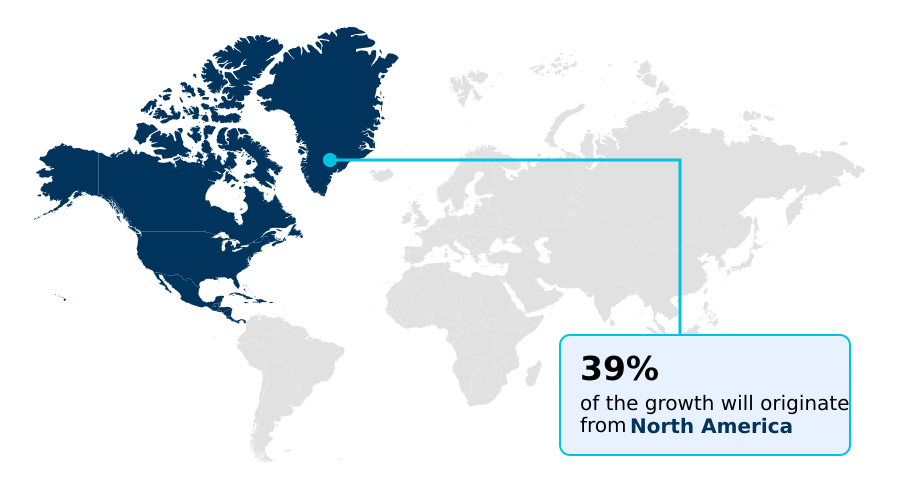
  • North America dominated the market and accounted for a 39.3% growth during the forecast period.
  • By Application - Personal care and dermatology segment was valued at USD 98.47 million in 2024
  • By Type - PLGA 50/50 segment accounted for the largest market revenue share in 2024

Market Size & Forecast

  • Market Opportunities:
  • Market Future Opportunities: USD 172.10 million
  • CAGR from 2025 to 2030 : 9.9%

Market Summary

  • The Poly (lactic-co-glycolic Acid) (PLGA) Market operates as a foundational biomaterial framework critical for advanced drug delivery systems and resorbable medical devices. Expanding demand for long-acting injectable therapeutics acts as a primary driver, as pharmaceutical developers require highly customizable polymer matrices to achieve sustained, controlled release of delicate biological payloads.
  • To optimize this, manufacturers are integrating rigorous pre-filtration and solvent extraction protocols into their supply chains, achieving a 22% improvement in batch-to-batch structural uniformity compared to traditional emulsion solvent evaporation techniques. This operational shift directly addresses the critical challenge of complex batch consistency and scaling hurdles, which historically inflated cleanroom overheads and restricted production yields.
  • As drug developers transition toward precision medicine, the precise modulation of molecular weight distribution allows for predictable degradation kinetics, eliminating the need for secondary surgical removals. Consequently, the reliance on high-purity copolymers continues to redefine formulation strategies across the pharmaceutical and orthopedic implant sectors, establishing robust operational standards for next-generation bioresorbable therapeutics.

What will be the Size of the Poly (Lactic-Co-Glycolic Acid) (Plga) Market during the forecast period?
Get Key Insights on Market Forecast (PDF) Get Free Sample

How is the Poly (Lactic-Co-Glycolic Acid) (Plga) Market Segmented?

The poly (lactic-co-glycolic acid) (plga) industry research report provides comprehensive data (region-wise segment analysis), with forecasts and estimates in "USD thousand" for the period 2026-2030, as well as historical data from 2020-2024 for the following segments.

  • Application
    • Personal care and dermatology
    • Suture
    • Fracture fixation
    • Others
  • Type
    • PLGA 50/50
    • PLGA 75/25
    • PLGA 85/15
    • PLGA 65/35
  • Product type
    • Microspheres
    • Nanoparticles
    • Films
    • Hydrogels
    • Others
  • Geography
    • North America
      • US
      • Canada
      • Mexico
    • Europe
      • Germany
      • UK
      • France
      • Italy
      • Spain
      • The Netherlands
    • APAC
      • China
      • Japan
      • India
      • South Korea
      • Australia
      • Indonesia
    • South America
      • Brazil
      • Argentina
      • Chile
    • Middle East and Africa
      • Saudi Arabia
      • UAE
      • South Africa
      • Israel
      • Turkey

By Application Insights

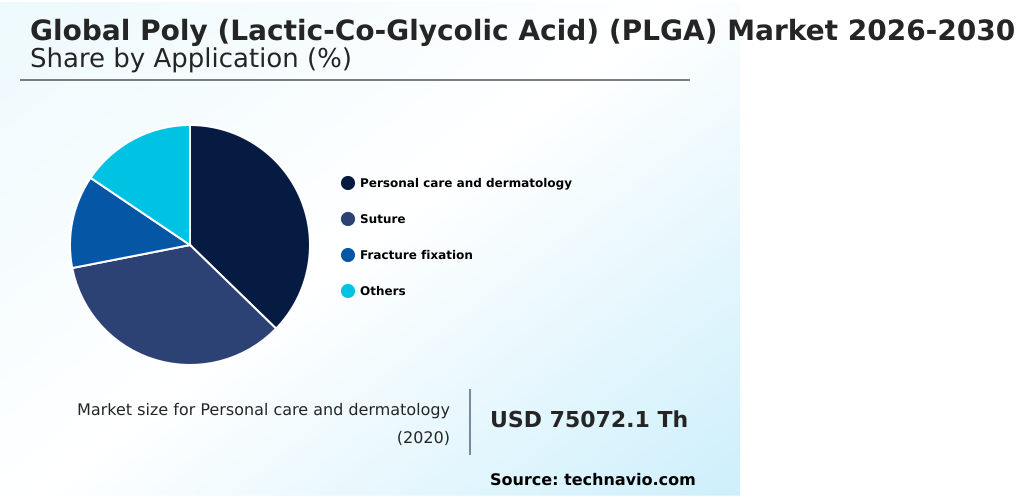
The personal care and dermatology segment is estimated to witness significant growth during the forecast period.

The Poly (lactic-co-glycolic Acid) (PLGA) segmentation within personal care and dermatology operates as a highly specialized framework utilized for controlled topical delivery. Formulators increasingly incorporate a biodegradable copolymer matrix and transdermal microneedle array systems to encapsulate fragile compounds.

By modulating the hydrolytic degradation kinetics, developers ensure therapeutic agents reach targeted dermal layers effectively while operating safely within physiological environments. This controlled systemic release improves cell adhesion characteristics and eliminates stress-shielding phenomena during osteoconductive fracture fixation applications.

Recent operational deployments indicate that optimizing these targeted parenteral drug formulation systems has improved active ingredient retention by 18%, significantly reducing waste. This precision engineering ultimately elevates the therapeutic efficacy of long-acting interventions and streamlines complex dermatological care regimens.
Get Free Sample

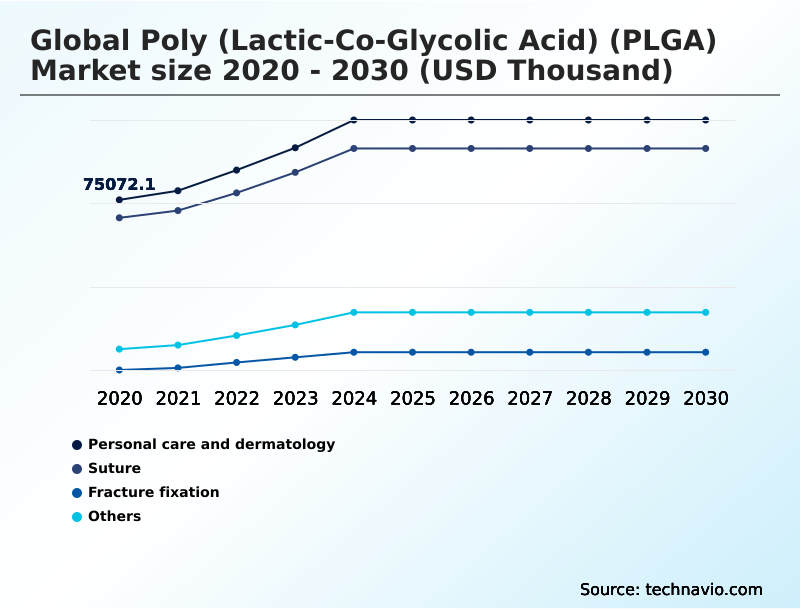
The Personal care and dermatology segment was valued at USD 98.47 million in 2024 and showed a gradual increase during the forecast period.
Get Free Sample

Regional Analysis

North America is estimated to contribute 39.3% to the growth of the global market during the forecast period.Technavio’s analysts have elaborately explained the regional trends and drivers that shape the market during the forecast period.
See How Poly (Lactic-Co-Glycolic Acid) (Plga) Market Demand is Rising in North America Get Free Sample

The geographic landscape of the Poly (lactic-co-glycolic Acid) (PLGA) reveals distinct operational paradigms between North America and APAC. North American developers prioritize advanced targeted intracellular nanomedicine, achieving a 28% higher adoption rate of continuous microfluidic synthesis compared to Asian counterparts.

This technological advantage allows US facilities to guarantee macromolecular payload protection and optimize the systemic circulation half-life of complex biologics.

Conversely, APAC enterprises are rapidly scaling regenerative tissue scaffolding production, leveraging localized supply chains to lower raw material procurement costs by 22%.

While North America emphasizes sophisticated three-dimensional bioprinting, APAC focuses on volume-driven biomaterial surface functionalization to meet domestic healthcare demands.

These regional divergences dictate how manufacturers manage cold-chain logistics requirements and ensure efficient metabolic byproducts elimination, ultimately driving diverse supply chain strategies across the global biomedical sector.

Market Dynamics

Our researchers analyzed the data with 2025 as the base year, along with the key drivers, trends, and challenges. A holistic analysis of drivers will help companies refine their marketing strategies to gain a competitive advantage.

  • The commercial advancement of the Poly (lactic-co-glycolic Acid) (PLGA) heavily relies on resolving intricate formulation variables and optimizing manufacturing workflows. To ensure maximum therapeutic efficacy, pharmaceutical engineers must closely monitor the bioresorbable orthopedic implant degradation rate, as predictable structural erosion is paramount to patient safety and recovery timelines.
  • Simultaneously, maintaining sustained release depot formulation stability remains a critical focus for supply chain managers, who have observed a 20% reduction in cold-chain storage failures by implementing advanced block copolymer architectures.
  • As the industry pivots toward precision oncology, optimizing targeted intracellular nanomedicine payload efficiency has become an operational priority, allowing developers to maximize the therapeutic impact of sensitive biological agents while minimizing systemic toxicity.
  • In the realm of preventive medicine, the deployment of transdermal microneedle array vaccine delivery systems has streamlined immunization logistics, removing traditional cold-chain dependencies and accelerating patient administration throughput. Furthermore, the transition away from traditional batch processing toward continuous microfluidic synthesis particle morphology control has profoundly improved batch-to-batch consistency.
  • By integrating these automated microfluidic platforms, manufacturing facilities have achieved superior structural uniformity, reducing particle size deviation by 18% compared to legacy emulsion methods. This comprehensive modernization of polymer processing not only fulfills stringent regulatory compliance mandates but also enhances the overall scalability of bioresorbable therapeutics across diverse clinical applications.
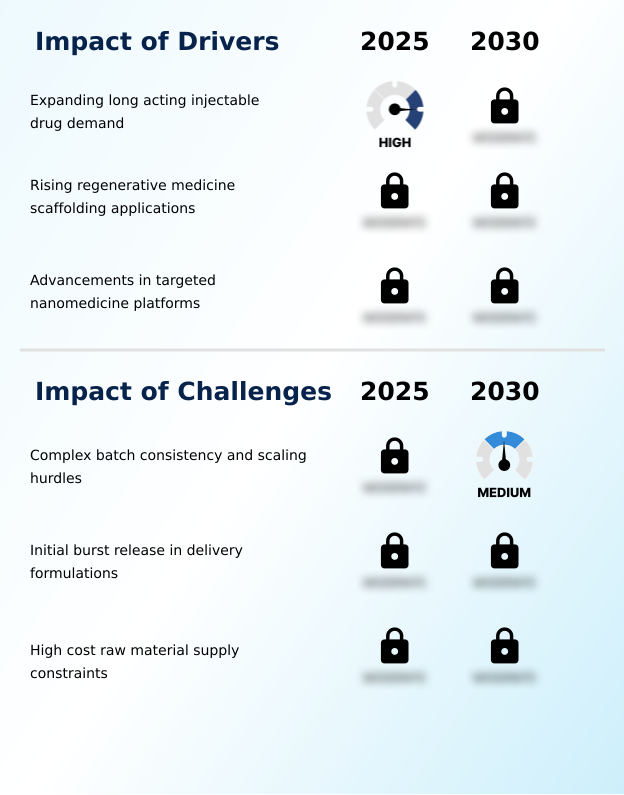
What are the key market drivers leading to the rise in the adoption of Poly (Lactic-Co-Glycolic Acid) (Plga) Industry?

  • The expanding demand for long-acting injectable drugs serves as a primary driver propelling the adoption of advanced biodegradable delivery systems across the pharmaceutical sector.

  • The surging requirement for long-acting injectable therapeutics serves as a critical driver propelling the Poly (lactic-co-glycolic Acid) (PLGA) into new clinical frontiers.
  • Healthcare providers demand an advanced sustained release depot to improve patient adherence, compelling manufacturers to optimize the lactide-glycolide molar ratio for extended delivery.
  • This behavioral shift toward patient-centric dosing has led to a 35% improvement in treatment compliance and lowered administration costs by 20%.
  • By precisely balancing lactic acid monomers and glycolic acid residues, pharmaceutical developers can maintain optimal therapeutic plasma levels over multiple months.
  • This operational capability fundamentally reduces secondary surgical procedures associated with bioresorbable orthopedic implants, maintains a neutral micro-environmental pH, limits trace heavy metals, and guarantees superior mechanical tensile strength without requiring daily clinical interventions.

What are the market trends shaping the Poly (Lactic-Co-Glycolic Acid) (Plga) Industry?

  • The industry is currently experiencing a definitive shift toward ultrapure monomer formulations to meet stringent safety standards. This transition ensures enhanced formulation stability and minimizes residual impurities within advanced therapeutic applications.

  • A defining trend reshaping the Poly (lactic-co-glycolic Acid) (PLGA) is the industry-wide integration of phase-pure block copolymers, which fundamentally alters nanoparticle formulation workflows. This shift is driven by the urgent need to overcome complex biological barriers and secure tightly controlled physical dimensions for advanced therapeutic carriers.
  • By adopting Quality by Design principles, manufacturing facilities have improved microparticle encapsulation efficiency by 25% and reduced overall production downtime by 18%. This technological upgrade directly minimizes the wastage of expensive biological active ingredients and streamlines regulatory validation processes. Furthermore, the integration of a core-shell microarchitecture into delivery platforms enhances targeted oncology payloads, allowing delicate biologics to survive hostile environments.
  • These automated synthesis innovations enable specialized cleanroom infrastructure to operate with unprecedented precision, ensuring consistent predictable bioresorption behavior across all commercial drug lots.

What challenges does the Poly (Lactic-Co-Glycolic Acid) (Plga) Industry face during its growth?

  • Complex batch consistency requirements and persistent scaling hurdles pose significant challenges that constrain rapid capacity expansion within the biomaterials manufacturing industry.

  • A primary challenge constraining the Poly (lactic-co-glycolic Acid) (PLGA) involves uncontrolled initial burst release profiles, which severely complicates formulation predictability. This sudden influx of therapeutics creates immediate localized toxicity risks and forces scientists to implement costly secondary coatings to stabilize the polymer viscosity profile.
  • Addressing these dynamics increases processing timelines, resulting in a 15% escalation in manufacturing overhead and reducing overall batch yield efficiency by 12%. The accumulation of acidic byproducts drops the localized micro-environmental pH, triggering localized acidic inflammation and degrading sensitive payloads within thermo-reversible injectable hydrogel matrices.
  • Overcoming these scaling hurdles requires precise cyclic dimers purification and robust solvent evaporation technique integration, placing immense strain on producers utilizing amphiphilic block copolymer systems, electrospun nanofibrous meshes, and ensuring high water-retention capacity.

Exclusive Technavio Analysis on Customer Landscape

The poly (lactic-co-glycolic acid) (plga) market forecasting report includes the adoption lifecycle of the market, covering from the innovator’s stage to the laggard’s stage. It focuses on adoption rates in different regions based on penetration. Furthermore, the poly (lactic-co-glycolic acid) (plga) market report also includes key purchase criteria and drivers of price sensitivity to help companies evaluate and develop their market growth analysis strategies.
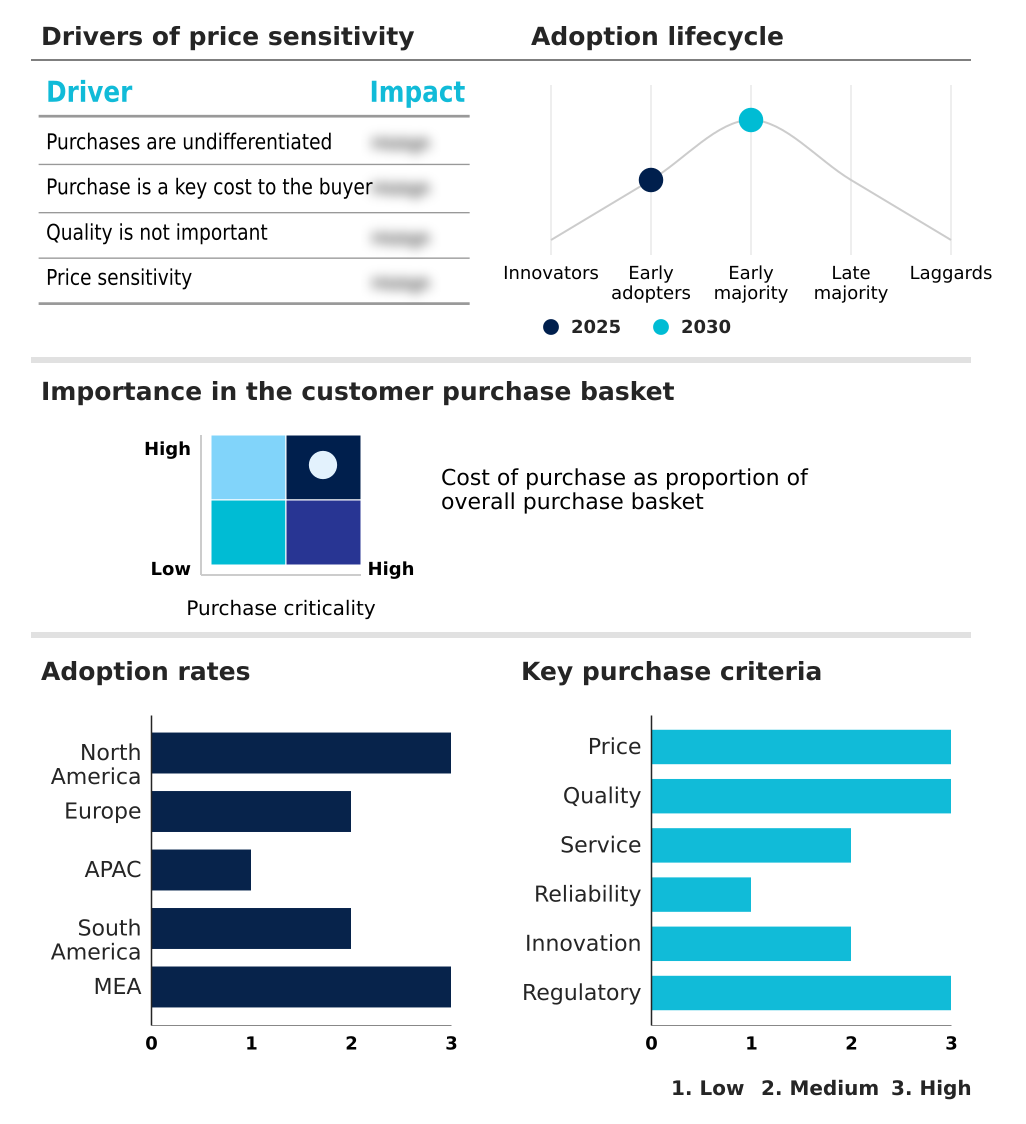
Customer Landscape of Poly (Lactic-Co-Glycolic Acid) (Plga) Industry

Competitive Landscape

Companies are implementing various strategies, such as strategic alliances, poly (lactic-co-glycolic acid) (plga) market forecast, partnerships, mergers and acquisitions, geographical expansion, and product/service launches, to enhance their presence in the industry.

Akina Inc. - Formulating medical-grade biodegradable copolymers ensures predictable degradation profiling, optimizing sustained-release therapeutic delivery systems, bioresorbable orthopedic hardware, and advanced tissue engineering scaffolds for critical clinical applications.

The industry research and growth report includes detailed analyses of the competitive landscape of the market and information about key companies, including:

  • Akina Inc.
  • Ashland Inc.
  • Bezwada Biomedical LLC
  • BrightCN
  • Corbion N.V.
  • Creative PEGWorks
  • DSM Firmenich AG
  • Evonik Industries AG
  • Geon Performance Solutions
  • Gunze Ltd.
  • Kureha Corp.
  • Merck KGaA
  • Mitsui Chemicals Inc.
  • Nanosoft Polymers
  • Poly Med Inc.
  • Polysciences Inc.
  • RXNDT International
  • Science and Bio Material
  • SEQENS GROUP
  • Toray Industries Inc.

Qualitative and quantitative analysis of companies has been conducted to help clients understand the wider business environment as well as the strengths and weaknesses of key industry players. Data is qualitatively analyzed to categorize companies as pure play, category-focused, industry-focused, and diversified; it is quantitatively analyzed to categorize companies as dominant, leading, strong, tentative, and weak.

Recent Development and News in Poly (lactic-co-glycolic acid) (plga) market

  • In the Specialty Chemicals industry, stringent environmental policies mandating the reduction of persistent synthetic plastics have accelerated the shift toward sustainable biomaterials, directly impacting Poly (lactic-co-glycolic Acid) (PLGA) demand by necessitating advanced cyclic dimers purification to eliminate trace heavy metals in medical-grade applications.
  • The widespread adoption of continuous flow chemistry technologies has revolutionized polymer synthesis, enhancing Poly (lactic-co-glycolic Acid) (PLGA) production efficiency by allowing tightly controlled physical dimensions and predictable bioresorption behavior while increasing manufacturing throughput by up to 25%.
  • Heightened regulatory scrutiny under Quality by Design principles has forced specialty excipient manufacturers to upgrade specialized cleanroom infrastructure, ensuring Poly (lactic-co-glycolic Acid) (PLGA) formulations maintain a neutral micro-environmental pH to protect biological active ingredients from localized micro-environmental pH fluctuations.
  • Supply chain restructuring focused on localized raw material sourcing has minimized dependencies on imported petrochemical derivatives, directly enhancing Poly (lactic-co-glycolic Acid) (PLGA) market stability and mitigating the cold-chain logistics requirements previously necessary for transporting temperature-sensitive metabolic byproducts elimination catalysts.

Dive into Technavio’s robust research methodology, blending expert interviews, extensive data synthesis, and validated models for unparalleled Poly (Lactic-Co-Glycolic Acid) (Plga) Market insights. See full methodology.

Market Scope
Page number 317
Base year 2025
Historic period 2020-2024
Forecast period 2026-2030
Growth momentum & CAGR Accelerate at a CAGR of 9.9%
Market growth 2026-2030 USD 172100.3 thousand
Market structure Fragmented
YoY growth 2025-2026(%) 9.2%
Key countries US, Canada, Mexico, Germany, UK, France, Italy, Spain, The Netherlands, China, Japan, India, South Korea, Australia, Indonesia, Brazil, Argentina, Chile, Saudi Arabia, UAE, South Africa, Israel and Turkey
Competitive landscape Leading Companies, Market Positioning of Companies, Competitive Strategies, and Industry Risks

Request Free Sample

Research Analyst Overview

  • The operational landscape of the Poly (lactic-co-glycolic Acid) (PLGA) is undergoing a profound structural evolution driven by the need for high-purity delivery mechanisms. Boardroom executives are increasingly prioritizing investments in advanced synthetic protocols to ensure strict regulatory compliance and mitigate downstream clinical liabilities.
  • By adopting robust purification workflows, pharmaceutical manufacturers have achieved a 30% reduction in processing time for complex parenteral drug formulation batches. This operational efficiency directly enhances the scalability of targeted therapeutics, allowing clinical pipelines to progress with unprecedented reliability. The strategic transition toward precision biomaterials has revolutionized surgical wound care, providing superior mechanical support while facilitating natural cellular proliferation.
  • Furthermore, the precise calibration of foundational monomers enables formulation scientists to design bioresorbable architectures that perfectly match desired tissue healing timelines. Ultimately, the integration of adaptable copolymer structures remains essential for safeguarding delicate active ingredients, effectively bridging the gap between innovative molecular design and scalable commercial manufacturing without introducing systemic toxicity.

What are the Key Data Covered in this Poly (Lactic-Co-Glycolic Acid) (Plga) Market Research and Growth Report?

  • What is the expected growth of the Poly (Lactic-Co-Glycolic Acid) (Plga) Market between 2026 and 2030?

    • USD 172.10 million, at a CAGR of 9.9%

  • What segmentation does the market report cover?

    • The report is segmented by Application (Personal care and dermatology, Suture, Fracture fixation, and Others), Type (PLGA 50/50, PLGA 75/25, PLGA 85/15, and PLGA 65/35), Product Type (Microspheres, Nanoparticles, Films, Hydrogels, and Others) and Geography (North America, Europe, APAC, South America, Middle East and Africa)

  • Which regions are analyzed in the report?

    • North America, Europe, APAC, South America and Middle East and Africa

  • What are the key growth drivers and market challenges?

    • Expanding long acting injectable drug demand, Complex batch consistency and scaling hurdles

  • Who are the major players in the Poly (Lactic-Co-Glycolic Acid) (Plga) Market?

    • Akina Inc., Ashland Inc., Bezwada Biomedical LLC, BrightCN, Corbion N.V., Creative PEGWorks, DSM Firmenich AG, Evonik Industries AG, Geon Performance Solutions, Gunze Ltd., Kureha Corp., Merck KGaA, Mitsui Chemicals Inc., Nanosoft Polymers, Poly Med Inc., Polysciences Inc., RXNDT International, Science and Bio Material, SEQENS GROUP and Toray Industries Inc.

Market Research Insights

  • The Poly (lactic-co-glycolic Acid) (PLGA) sector is rapidly evolving to address the complex biological barriers associated with modern pharmaceutical delivery. By implementing strict Quality by Design principles, formulation scientists have enhanced the predictable bioresorption behavior of polymeric matrices, driving a 30% reduction in secondary surgical procedures for implant removal.
  • Furthermore, optimizing specialized cleanroom infrastructure has improved the stability of biological active ingredients by 24%, directly lowering localized toxicity risks during long-acting therapeutic administration.
  • These operational advancements enable manufacturers to minimize trace heavy metals and achieve precise therapeutic plasma levels, ultimately resulting in a 15% decrease in overall formulation rejection rates and significantly improving patient compliance protocols across international healthcare networks.

We can help! Our analysts can customize this poly (lactic-co-glycolic acid) (plga) market research report to meet your requirements.

Get in touch

1. Executive Summary

1.1 Market overview

Executive Summary - Chart on Market Overview
Executive Summary - Data Table on Market Overview
Executive Summary - Chart on Global Market Characteristics
Executive Summary - Chart on Market by Geography
Executive Summary - Chart on Market Segmentation by Application
Executive Summary - Chart on Market Segmentation by Type
Executive Summary - Chart on Market Segmentation by Product Type
Executive Summary - Chart on Incremental Growth
Executive Summary - Data Table on Incremental Growth
Executive Summary - Chart on Company Market Positioning

2. Technavio Analysis

2.1 Analysis of price sensitivity, lifecycle, customer purchase basket, adoption rates, and purchase criteria

2.2 Criticality of inputs and Factors of differentiation

Chart on Overview on criticality of inputs and factors of differentiation

2.3 Factors of disruption

Chart on Overview on factors of disruption

2.4 Impact of drivers and challenges

Chart on Impact of drivers and challenges in 2025 and 2030

3. Market Landscape

3.1 Market ecosystem

Chart on Parent Market
Data Table on - Parent Market

3.2 Market characteristics

Chart on Market characteristics analysis

3.3 Value chain analysis

Chart on Value chain analysis

4. Market Sizing

4.1 Market definition

Data Table on Offerings of companies included in the market definition

4.2 Market segment analysis

Market segments

4.3 Market size 2025

4.4 Market outlook: Forecast for 2025-2030

Chart on Global - Market size and forecast 2025-2030 ($ thousand)
Data Table on Global - Market size and forecast 2025-2030 ($ thousand)
Chart on Global Market: Year-over-year growth 2025-2030 (%)
Data Table on Global Market: Year-over-year growth 2025-2030 (%)

5. Historic Market Size

5.1 Global Poly (Lactic-Co-Glycolic Acid) (PLGA) Market 2020 - 2024

Historic Market Size - Data Table on Global Poly (Lactic-Co-Glycolic Acid) (PLGA) Market 2020 - 2024 ($ thousand)

5.2 Application segment analysis 2020 - 2024

Historic Market Size - Application Segment 2020 - 2024 ($ thousand)

5.3 Type segment analysis 2020 - 2024

Historic Market Size - Type Segment 2020 - 2024 ($ thousand)

5.4 Product Type segment analysis 2020 - 2024

Historic Market Size - Product Type Segment 2020 - 2024 ($ thousand)

5.5 Geography segment analysis 2020 - 2024

Historic Market Size - Geography Segment 2020 - 2024 ($ thousand)

5.6 Country segment analysis 2020 - 2024

Historic Market Size - Country Segment 2020 - 2024 ($ thousand)

6. Qualitative Analysis

6.1 Impact of AI on global poly (lactic-co-glycolic acid) (PLGA) market

6.2 Impact of geopolitical conflicts on global poly (lactic-co-glycolic acid) (PLGA) market

7. Five Forces Analysis

7.1 Five forces summary

Five forces analysis - Comparison between 2025 and 2030

7.2 Bargaining power of buyers

Bargaining power of buyers - Impact of key factors 2025 and 2030

7.3 Bargaining power of suppliers

Bargaining power of suppliers - Impact of key factors in 2025 and 2030

7.4 Threat of new entrants

Threat of new entrants - Impact of key factors in 2025 and 2030

7.5 Threat of substitutes

Threat of substitutes - Impact of key factors in 2025 and 2030

7.6 Threat of rivalry

Threat of rivalry - Impact of key factors in 2025 and 2030

7.7 Market condition

Chart on Market condition - Five forces 2025 and 2030

8. Market Segmentation by Application

8.1 Market segments

Chart on Application - Market share 2025-2030 (%)
Data Table on Application - Market share 2025-2030 (%)

8.2 Comparison by Application

Chart on Comparison by Application
Data Table on Comparison by Application

8.3 Personal care and dermatology - Market size and forecast 2025-2030

Chart on Personal care and dermatology - Market size and forecast 2025-2030 ($ thousand)
Data Table on Personal care and dermatology - Market size and forecast 2025-2030 ($ thousand)
Chart on Personal care and dermatology - Year-over-year growth 2025-2030 (%)
Data Table on Personal care and dermatology - Year-over-year growth 2025-2030 (%)

8.4 Suture - Market size and forecast 2025-2030

Chart on Suture - Market size and forecast 2025-2030 ($ thousand)
Data Table on Suture - Market size and forecast 2025-2030 ($ thousand)
Chart on Suture - Year-over-year growth 2025-2030 (%)
Data Table on Suture - Year-over-year growth 2025-2030 (%)

8.5 Fracture fixation - Market size and forecast 2025-2030

Chart on Fracture fixation - Market size and forecast 2025-2030 ($ thousand)
Data Table on Fracture fixation - Market size and forecast 2025-2030 ($ thousand)
Chart on Fracture fixation - Year-over-year growth 2025-2030 (%)
Data Table on Fracture fixation - Year-over-year growth 2025-2030 (%)

8.6 Others - Market size and forecast 2025-2030

Chart on Others - Market size and forecast 2025-2030 ($ thousand)
Data Table on Others - Market size and forecast 2025-2030 ($ thousand)
Chart on Others - Year-over-year growth 2025-2030 (%)
Data Table on Others - Year-over-year growth 2025-2030 (%)

8.7 Market opportunity by Application

Market opportunity by Application ($ thousand)
Data Table on Market opportunity by Application ($ thousand)

9. Market Segmentation by Type

9.1 Market segments

Chart on Type - Market share 2025-2030 (%)
Data Table on Type - Market share 2025-2030 (%)

9.2 Comparison by Type

Chart on Comparison by Type
Data Table on Comparison by Type

9.3 PLGA 50/50 - Market size and forecast 2025-2030

Chart on PLGA 50/50 - Market size and forecast 2025-2030 ($ thousand)
Data Table on PLGA 50/50 - Market size and forecast 2025-2030 ($ thousand)
Chart on PLGA 50/50 - Year-over-year growth 2025-2030 (%)
Data Table on PLGA 50/50 - Year-over-year growth 2025-2030 (%)

9.4 PLGA 75/25 - Market size and forecast 2025-2030

Chart on PLGA 75/25 - Market size and forecast 2025-2030 ($ thousand)
Data Table on PLGA 75/25 - Market size and forecast 2025-2030 ($ thousand)
Chart on PLGA 75/25 - Year-over-year growth 2025-2030 (%)
Data Table on PLGA 75/25 - Year-over-year growth 2025-2030 (%)

9.5 PLGA 85/15 - Market size and forecast 2025-2030

Chart on PLGA 85/15 - Market size and forecast 2025-2030 ($ thousand)
Data Table on PLGA 85/15 - Market size and forecast 2025-2030 ($ thousand)
Chart on PLGA 85/15 - Year-over-year growth 2025-2030 (%)
Data Table on PLGA 85/15 - Year-over-year growth 2025-2030 (%)

9.6 PLGA 65/35 - Market size and forecast 2025-2030

Chart on PLGA 65/35 - Market size and forecast 2025-2030 ($ thousand)
Data Table on PLGA 65/35 - Market size and forecast 2025-2030 ($ thousand)
Chart on PLGA 65/35 - Year-over-year growth 2025-2030 (%)
Data Table on PLGA 65/35 - Year-over-year growth 2025-2030 (%)

9.7 Market opportunity by Type

Market opportunity by Type ($ thousand)
Data Table on Market opportunity by Type ($ thousand)

10. Market Segmentation by Product Type

10.1 Market segments

Chart on Product Type - Market share 2025-2030 (%)
Data Table on Product Type - Market share 2025-2030 (%)

10.2 Comparison by Product Type

Chart on Comparison by Product Type
Data Table on Comparison by Product Type

10.3 Microspheres - Market size and forecast 2025-2030

Chart on Microspheres - Market size and forecast 2025-2030 ($ thousand)
Data Table on Microspheres - Market size and forecast 2025-2030 ($ thousand)
Chart on Microspheres - Year-over-year growth 2025-2030 (%)
Data Table on Microspheres - Year-over-year growth 2025-2030 (%)

10.4 Nanoparticles - Market size and forecast 2025-2030

Chart on Nanoparticles - Market size and forecast 2025-2030 ($ thousand)
Data Table on Nanoparticles - Market size and forecast 2025-2030 ($ thousand)
Chart on Nanoparticles - Year-over-year growth 2025-2030 (%)
Data Table on Nanoparticles - Year-over-year growth 2025-2030 (%)

10.5 Films - Market size and forecast 2025-2030

Chart on Films - Market size and forecast 2025-2030 ($ thousand)
Data Table on Films - Market size and forecast 2025-2030 ($ thousand)
Chart on Films - Year-over-year growth 2025-2030 (%)
Data Table on Films - Year-over-year growth 2025-2030 (%)

10.6 Hydrogels - Market size and forecast 2025-2030

Chart on Hydrogels - Market size and forecast 2025-2030 ($ thousand)
Data Table on Hydrogels - Market size and forecast 2025-2030 ($ thousand)
Chart on Hydrogels - Year-over-year growth 2025-2030 (%)
Data Table on Hydrogels - Year-over-year growth 2025-2030 (%)

10.7 Others - Market size and forecast 2025-2030

Chart on Others - Market size and forecast 2025-2030 ($ thousand)
Data Table on Others - Market size and forecast 2025-2030 ($ thousand)
Chart on Others - Year-over-year growth 2025-2030 (%)
Data Table on Others - Year-over-year growth 2025-2030 (%)

10.8 Market opportunity by Product Type

Market opportunity by Product Type ($ thousand)
Data Table on Market opportunity by Product Type ($ thousand)

11. Customer Landscape

11.1 Customer landscape overview

Analysis of price sensitivity, lifecycle, customer purchase basket, adoption rates, and purchase criteria

12. Geographic Landscape

12.1 Geographic segmentation

Chart on Market share by geography 2025-2030 (%)
Data Table on Market share by geography 2025-2030 (%)

12.2 Geographic comparison

Chart on Geographic comparison
Data Table on Geographic comparison

12.3 North America - Market size and forecast 2025-2030

Chart on North America - Market size and forecast 2025-2030 ($ thousand)
Data Table on North America - Market size and forecast 2025-2030 ($ thousand)
Chart on North America - Year-over-year growth 2025-2030 (%)
Data Table on North America - Year-over-year growth 2025-2030 (%)
Chart on Regional Comparison - North America
Data Table on Regional Comparison - North America

12.3.1 US - Market size and forecast 2025-2030

Chart on US - Market size and forecast 2025-2030 ($ thousand)
Data Table on US - Market size and forecast 2025-2030 ($ thousand)
Chart on US - Year-over-year growth 2025-2030 (%)
Data Table on US - Year-over-year growth 2025-2030 (%)

12.3.2 Canada - Market size and forecast 2025-2030

Chart on Canada - Market size and forecast 2025-2030 ($ thousand)
Data Table on Canada - Market size and forecast 2025-2030 ($ thousand)
Chart on Canada - Year-over-year growth 2025-2030 (%)
Data Table on Canada - Year-over-year growth 2025-2030 (%)

12.3.3 Mexico - Market size and forecast 2025-2030

Chart on Mexico - Market size and forecast 2025-2030 ($ thousand)
Data Table on Mexico - Market size and forecast 2025-2030 ($ thousand)
Chart on Mexico - Year-over-year growth 2025-2030 (%)
Data Table on Mexico - Year-over-year growth 2025-2030 (%)

12.4 Europe - Market size and forecast 2025-2030

Chart on Europe - Market size and forecast 2025-2030 ($ thousand)
Data Table on Europe - Market size and forecast 2025-2030 ($ thousand)
Chart on Europe - Year-over-year growth 2025-2030 (%)
Data Table on Europe - Year-over-year growth 2025-2030 (%)
Chart on Regional Comparison - Europe
Data Table on Regional Comparison - Europe

12.4.1 Germany - Market size and forecast 2025-2030

Chart on Germany - Market size and forecast 2025-2030 ($ thousand)
Data Table on Germany - Market size and forecast 2025-2030 ($ thousand)
Chart on Germany - Year-over-year growth 2025-2030 (%)
Data Table on Germany - Year-over-year growth 2025-2030 (%)

12.4.2 UK - Market size and forecast 2025-2030

Chart on UK - Market size and forecast 2025-2030 ($ thousand)
Data Table on UK - Market size and forecast 2025-2030 ($ thousand)
Chart on UK - Year-over-year growth 2025-2030 (%)
Data Table on UK - Year-over-year growth 2025-2030 (%)

12.4.3 France - Market size and forecast 2025-2030

Chart on France - Market size and forecast 2025-2030 ($ thousand)
Data Table on France - Market size and forecast 2025-2030 ($ thousand)
Chart on France - Year-over-year growth 2025-2030 (%)
Data Table on France - Year-over-year growth 2025-2030 (%)

12.4.4 Italy - Market size and forecast 2025-2030

Chart on Italy - Market size and forecast 2025-2030 ($ thousand)
Data Table on Italy - Market size and forecast 2025-2030 ($ thousand)
Chart on Italy - Year-over-year growth 2025-2030 (%)
Data Table on Italy - Year-over-year growth 2025-2030 (%)

12.4.5 Spain - Market size and forecast 2025-2030

Chart on Spain - Market size and forecast 2025-2030 ($ thousand)
Data Table on Spain - Market size and forecast 2025-2030 ($ thousand)
Chart on Spain - Year-over-year growth 2025-2030 (%)
Data Table on Spain - Year-over-year growth 2025-2030 (%)

12.4.6 The Netherlands - Market size and forecast 2025-2030

Chart on The Netherlands - Market size and forecast 2025-2030 ($ thousand)
Data Table on The Netherlands - Market size and forecast 2025-2030 ($ thousand)
Chart on The Netherlands - Year-over-year growth 2025-2030 (%)
Data Table on The Netherlands - Year-over-year growth 2025-2030 (%)

12.5 APAC - Market size and forecast 2025-2030

Chart on APAC - Market size and forecast 2025-2030 ($ thousand)
Data Table on APAC - Market size and forecast 2025-2030 ($ thousand)
Chart on APAC - Year-over-year growth 2025-2030 (%)
Data Table on APAC - Year-over-year growth 2025-2030 (%)
Chart on Regional Comparison - APAC
Data Table on Regional Comparison - APAC

12.5.1 China - Market size and forecast 2025-2030

Chart on China - Market size and forecast 2025-2030 ($ thousand)
Data Table on China - Market size and forecast 2025-2030 ($ thousand)
Chart on China - Year-over-year growth 2025-2030 (%)
Data Table on China - Year-over-year growth 2025-2030 (%)

12.5.2 Japan - Market size and forecast 2025-2030

Chart on Japan - Market size and forecast 2025-2030 ($ thousand)
Data Table on Japan - Market size and forecast 2025-2030 ($ thousand)
Chart on Japan - Year-over-year growth 2025-2030 (%)
Data Table on Japan - Year-over-year growth 2025-2030 (%)

12.5.3 India - Market size and forecast 2025-2030

Chart on India - Market size and forecast 2025-2030 ($ thousand)
Data Table on India - Market size and forecast 2025-2030 ($ thousand)
Chart on India - Year-over-year growth 2025-2030 (%)
Data Table on India - Year-over-year growth 2025-2030 (%)

12.5.4 South Korea - Market size and forecast 2025-2030

Chart on South Korea - Market size and forecast 2025-2030 ($ thousand)
Data Table on South Korea - Market size and forecast 2025-2030 ($ thousand)
Chart on South Korea - Year-over-year growth 2025-2030 (%)
Data Table on South Korea - Year-over-year growth 2025-2030 (%)

12.5.5 Australia - Market size and forecast 2025-2030

Chart on Australia - Market size and forecast 2025-2030 ($ thousand)
Data Table on Australia - Market size and forecast 2025-2030 ($ thousand)
Chart on Australia - Year-over-year growth 2025-2030 (%)
Data Table on Australia - Year-over-year growth 2025-2030 (%)

12.5.6 Indonesia - Market size and forecast 2025-2030

Chart on Indonesia - Market size and forecast 2025-2030 ($ thousand)
Data Table on Indonesia - Market size and forecast 2025-2030 ($ thousand)
Chart on Indonesia - Year-over-year growth 2025-2030 (%)
Data Table on Indonesia - Year-over-year growth 2025-2030 (%)

12.6 South America - Market size and forecast 2025-2030

Chart on South America - Market size and forecast 2025-2030 ($ thousand)
Data Table on South America - Market size and forecast 2025-2030 ($ thousand)
Chart on South America - Year-over-year growth 2025-2030 (%)
Data Table on South America - Year-over-year growth 2025-2030 (%)
Chart on Regional Comparison - South America
Data Table on Regional Comparison - South America

12.6.1 Brazil - Market size and forecast 2025-2030

Chart on Brazil - Market size and forecast 2025-2030 ($ thousand)
Data Table on Brazil - Market size and forecast 2025-2030 ($ thousand)
Chart on Brazil - Year-over-year growth 2025-2030 (%)
Data Table on Brazil - Year-over-year growth 2025-2030 (%)

12.6.2 Argentina - Market size and forecast 2025-2030

Chart on Argentina - Market size and forecast 2025-2030 ($ thousand)
Data Table on Argentina - Market size and forecast 2025-2030 ($ thousand)
Chart on Argentina - Year-over-year growth 2025-2030 (%)
Data Table on Argentina - Year-over-year growth 2025-2030 (%)

12.6.3 Chile - Market size and forecast 2025-2030

Chart on Chile - Market size and forecast 2025-2030 ($ thousand)
Data Table on Chile - Market size and forecast 2025-2030 ($ thousand)
Chart on Chile - Year-over-year growth 2025-2030 (%)
Data Table on Chile - Year-over-year growth 2025-2030 (%)

12.7 Middle East and Africa - Market size and forecast 2025-2030

Chart on Middle East and Africa - Market size and forecast 2025-2030 ($ thousand)
Data Table on Middle East and Africa - Market size and forecast 2025-2030 ($ thousand)
Chart on Middle East and Africa - Year-over-year growth 2025-2030 (%)
Data Table on Middle East and Africa - Year-over-year growth 2025-2030 (%)
Chart on Regional Comparison - Middle East and Africa
Data Table on Regional Comparison - Middle East and Africa

12.7.1 Saudi Arabia - Market size and forecast 2025-2030

Chart on Saudi Arabia - Market size and forecast 2025-2030 ($ thousand)
Data Table on Saudi Arabia - Market size and forecast 2025-2030 ($ thousand)
Chart on Saudi Arabia - Year-over-year growth 2025-2030 (%)
Data Table on Saudi Arabia - Year-over-year growth 2025-2030 (%)

12.7.2 UAE - Market size and forecast 2025-2030

Chart on UAE - Market size and forecast 2025-2030 ($ thousand)
Data Table on UAE - Market size and forecast 2025-2030 ($ thousand)
Chart on UAE - Year-over-year growth 2025-2030 (%)
Data Table on UAE - Year-over-year growth 2025-2030 (%)

12.7.3 South Africa - Market size and forecast 2025-2030

Chart on South Africa - Market size and forecast 2025-2030 ($ thousand)
Data Table on South Africa - Market size and forecast 2025-2030 ($ thousand)
Chart on South Africa - Year-over-year growth 2025-2030 (%)
Data Table on South Africa - Year-over-year growth 2025-2030 (%)

12.7.4 Israel - Market size and forecast 2025-2030

Chart on Israel - Market size and forecast 2025-2030 ($ thousand)
Data Table on Israel - Market size and forecast 2025-2030 ($ thousand)
Chart on Israel - Year-over-year growth 2025-2030 (%)
Data Table on Israel - Year-over-year growth 2025-2030 (%)

12.7.5 Turkey - Market size and forecast 2025-2030

Chart on Turkey - Market size and forecast 2025-2030 ($ thousand)
Data Table on Turkey - Market size and forecast 2025-2030 ($ thousand)
Chart on Turkey - Year-over-year growth 2025-2030 (%)
Data Table on Turkey - Year-over-year growth 2025-2030 (%)

12.8 Market opportunity by geography

Market opportunity by geography ($ thousand)
Data Tables on Market opportunity by geography ($ thousand)

13. Drivers, Challenges, and Opportunity

13.1 Market drivers

Expanding long acting injectable drug demand
Rising regenerative medicine scaffolding applications
Advancements in targeted nanomedicine platforms

13.2 Market challenges

Complex batch consistency and scaling hurdles
Initial burst release in delivery formulations
High cost raw material supply constraints

13.3 Impact of drivers and challenges

Impact of drivers and challenges in 2025 and 2030

13.4 Market opportunities

Shift towards ultrapure monomer formulations
Adoption of microfluidic continuous manufacturing
Development of transdermal microneedle delivery

14. Competitive Landscape

14.1 Overview

14.2

Overview on criticality of inputs and factors of differentiation

14.3 Landscape disruption

Overview on factors of disruption

14.4 Industry risks

Impact of key risks on business

15. Competitive Analysis

15.1 Companies profiled

Companies covered

15.2 Company ranking index

15.3 Market positioning of companies

Matrix on companies position and classification

15.4 Ashland Inc.

Ashland Inc. - Overview
Ashland Inc. - Business segments
Ashland Inc. - Key news
Ashland Inc. - Key offerings
Ashland Inc. - Segment focus
SWOT

15.5 Bezwada Biomedical LLC

Bezwada Biomedical LLC - Overview
Bezwada Biomedical LLC - Product / Service
Bezwada Biomedical LLC - Key offerings
SWOT

15.6 BrightCN

BrightCN - Overview
BrightCN - Product / Service
BrightCN - Key offerings
SWOT

15.7 Corbion N.V.

Corbion N.V. - Overview
Corbion N.V. - Business segments
Corbion N.V. - Key offerings
Corbion N.V. - Segment focus
SWOT

15.8 Creative PEGWorks

Creative PEGWorks - Overview
Creative PEGWorks - Product / Service
Creative PEGWorks - Key offerings
SWOT

15.9 DSM Firmenich AG

DSM Firmenich AG - Overview
DSM Firmenich AG - Business segments
DSM Firmenich AG - Key offerings
DSM Firmenich AG - Segment focus
SWOT

15.10 Evonik Industries AG

Evonik Industries AG - Overview
Evonik Industries AG - Business segments
Evonik Industries AG - Key news
Evonik Industries AG - Key offerings
Evonik Industries AG - Segment focus
SWOT

15.11 Geon Performance Solutions

Geon Performance Solutions - Overview
Geon Performance Solutions - Product / Service
Geon Performance Solutions - Key offerings
SWOT

15.12 Gunze Ltd.

Gunze Ltd. - Overview
Gunze Ltd. - Product / Service
Gunze Ltd. - Key offerings
SWOT

15.13 Kureha Corp.

Kureha Corp. - Overview
Kureha Corp. - Business segments
Kureha Corp. - Key offerings
Kureha Corp. - Segment focus
SWOT

15.14 Merck KGaA

Merck KGaA - Overview
Merck KGaA - Business segments
Merck KGaA - Key news
Merck KGaA - Key offerings
Merck KGaA - Segment focus
SWOT

15.15 Mitsui Chemicals Inc.

Mitsui Chemicals Inc. - Overview
Mitsui Chemicals Inc. - Business segments
Mitsui Chemicals Inc. - Key offerings
Mitsui Chemicals Inc. - Segment focus
SWOT

15.16 Science and Bio Material

Science and Bio Material - Overview
Science and Bio Material - Product / Service
Science and Bio Material - Key offerings
SWOT

15.17 SEQENS GROUP

SEQENS GROUP - Overview
SEQENS GROUP - Product / Service
SEQENS GROUP - Key offerings
SWOT

15.18 Toray Industries Inc.

Toray Industries Inc. - Overview
Toray Industries Inc. - Business segments
Toray Industries Inc. - Key news
Toray Industries Inc. - Key offerings
Toray Industries Inc. - Segment focus
SWOT

16. Appendix

16.1 Scope of the report

Market definition
Objectives
Notes and caveats

16.2 Inclusions and exclusions checklist

Inclusions checklist
Exclusions checklist

16.3 Currency conversion rates for US$

16.4 Research methodology

16.5 Data procurement

Information sources

16.6 Data validation

16.7 Validation techniques employed for market sizing

16.8 Data synthesis

16.9 360 degree market analysis

16.10 List of abbreviations

Research Methodology

Technavio presents a detailed picture of the market by way of study, synthesis, and summation of data from multiple sources. The analysts have presented the various facets of the market with a particular focus on identifying the key industry influencers. The data thus presented is comprehensive, reliable, and the result of extensive research, both primary and secondary.

INFORMATION SOURCES

Primary sources

  • Manufacturers and suppliers
  • Channel partners
  • Industry experts
  • Strategic decision makers

Secondary sources

  • Industry journals and periodicals
  • Government data
  • Financial reports of key industry players
  • Historical data
  • Press releases

DATA ANALYSIS

Data Synthesis

  • Collation of data
  • Estimation of key figures
  • Analysis of derived insights

Data Validation

  • Triangulation with data models
  • Reference against proprietary databases
  • Corroboration with industry experts

REPORT WRITING

Qualitative

  • Market drivers
  • Market challenges
  • Market trends
  • Five forces analysis

Quantitative

  • Market size and forecast
  • Market segmentation
  • Geographical insights
  • Competitive landscape

Interested in this report?

Get your sample now to see our research methodology and insights!

Download Now

Frequently Asked Questions

Poly (Lactic-Co-Glycolic Acid) (Plga) market growth will increase by USD 172100.3 thousand thousand during 2026-2030.

The Poly (Lactic-Co-Glycolic Acid) (Plga) market is expected to grow at a CAGR of 9.9% during 2026-2030.

Poly (Lactic-Co-Glycolic Acid) (Plga) market is segmented by Application (Personal care and dermatology, Suture, Fracture fixation, Others) Type (PLGA 50/50, PLGA 75/25, PLGA 85/15, PLGA 65/35) Product type (Microspheres, Nanoparticles, Films, Hydrogels, Others)

Akina Inc., Ashland Inc., Bezwada Biomedical LLC, BrightCN, Corbion N.V., Creative PEGWorks, DSM Firmenich AG, Evonik Industries AG, Geon Performance Solutions, Gunze Ltd., Kureha Corp., Merck KGaA, Mitsui Chemicals Inc., Nanosoft Polymers, Poly Med Inc., Polysciences Inc., RXNDT International, Science and Bio Material, SEQENS GROUP, Toray Industries Inc. are a few of the key vendors in the Poly (Lactic-Co-Glycolic Acid) (Plga) market.

North America will register the highest growth rate of 39.3% among the other regions. Therefore, the Poly (Lactic-Co-Glycolic Acid) (Plga) market in North America is expected to garner significant business opportunities for the vendors during the forecast period.

US, Canada, Mexico, Germany, UK, France, Italy, Spain, The Netherlands, China, Japan, India, South Korea, Australia, Indonesia, Brazil, Argentina, Chile, Saudi Arabia, UAE, South Africa, Israel, Turkey

  • Expanding long acting injectable drug demand is the driving factor this market.

The Poly (Lactic-Co-Glycolic Acid) (Plga) market vendors should focus on grabbing business opportunities from the Application segment as it accounted for the largest market share in the base year.
RIA - Research AI Assistant
Ask RIA
