
Private And Public Cloud In Financial Services Industry Market Size 2025-2029
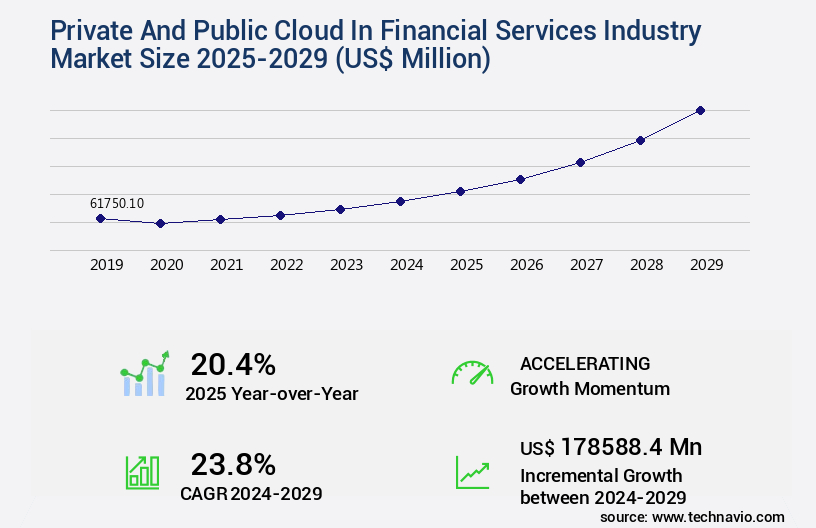
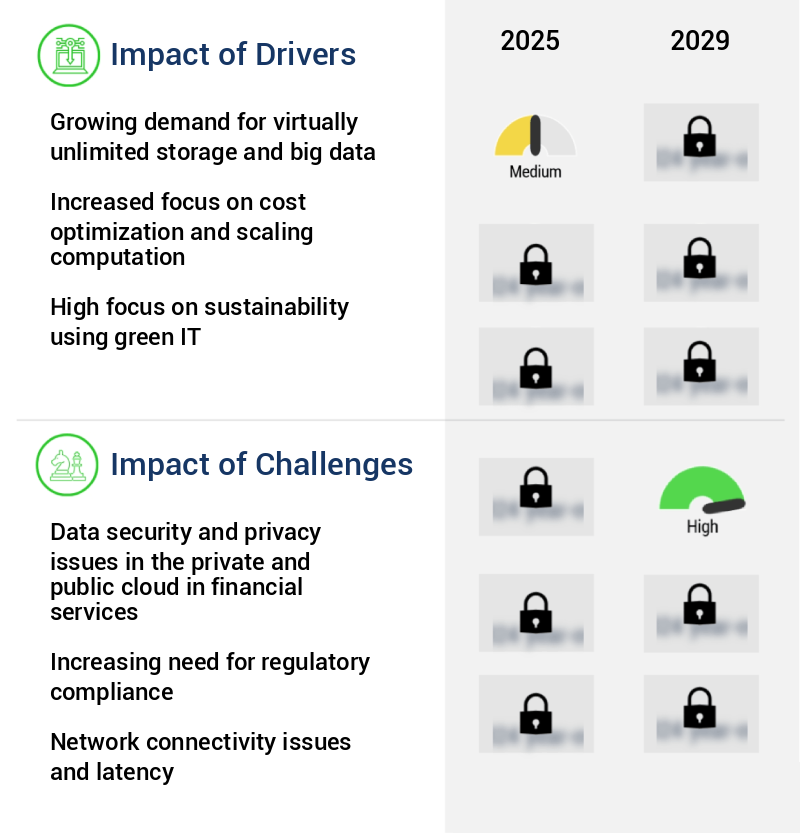
The private and public cloud in financial services industry market size is valued to increase by USD 178.59 billion, at a CAGR of 23.8% from 2024 to 2029. Growing demand for virtually unlimited storage and big data will drive the private and public cloud in financial services industry market.
Market Insights
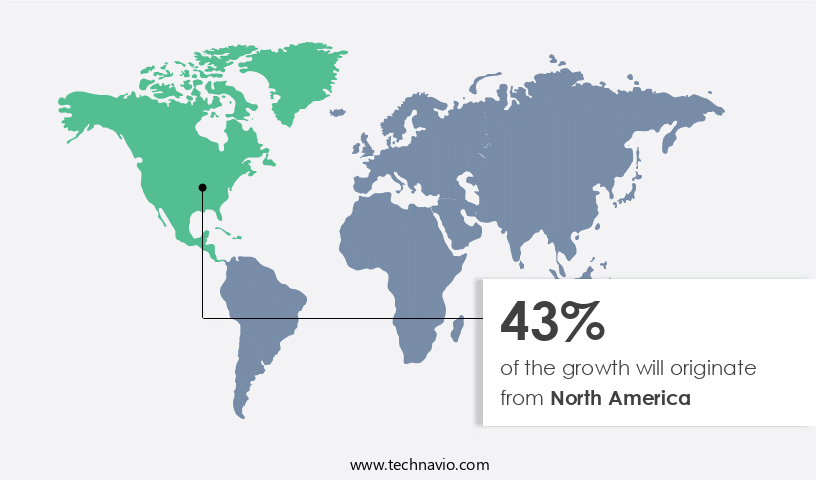
- North America dominated the market and accounted for a 43% growth during the 2025-2029.
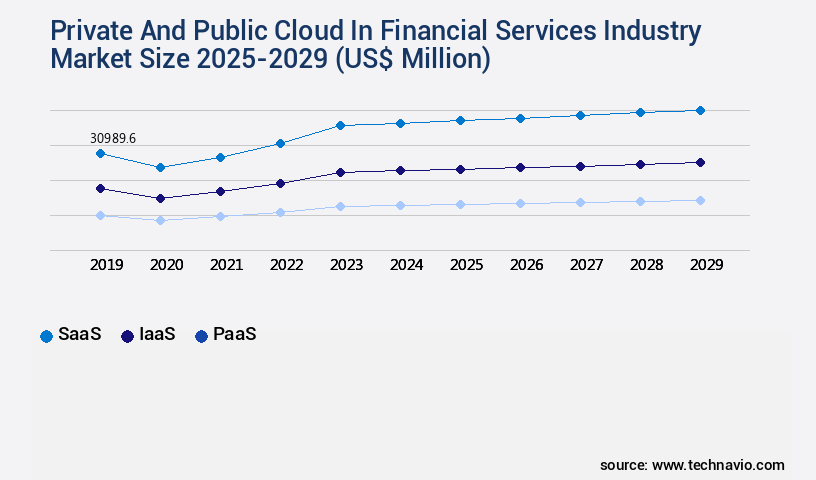
- By Service Type - SaaS segment was valued at USD 30.99 billion in 2023
- By Deployment - Private cloud segment accounted for the largest market revenue share in 2023
Market Size & Forecast
- Market Opportunities: USD 341.07 million
- Market Future Opportunities 2024: USD 178588.40 million
- CAGR from 2024 to 2029 : 23.8%
Market Summary
- In the financial services industry, the adoption of private and public cloud solutions continues to gain momentum, driven by the growing demand for virtually unlimited storage and big data processing capabilities. The financial sector's increasing reliance on technology for operational efficiency, risk management, and customer experience enhancement is fueling this trend. OpenStack, an open-source cloud computing platform, is a popular choice for many financial institutions due to its flexibility and scalability. However, the use of both private and public clouds presents unique challenges. Data security and privacy are paramount in the financial services industry, and ensuring the protection of sensitive information is a top priority.
- A real-world business scenario illustrates the importance of cloud solutions in financial services. Consider a global bank with a complex and geographically dispersed supply chain. By implementing a private cloud solution, the bank can securely store and process data related to its supply chain operations. Meanwhile, a public cloud platform can be used to analyze this data in real-time, providing valuable insights for optimizing the supply chain and improving operational efficiency. Despite the benefits, the implementation of private and public cloud solutions in financial services comes with its own set of challenges. Ensuring data security and privacy, complying with stringent regulatory requirements, and maintaining operational continuity are just a few of the issues that financial institutions must address.
- As the financial services industry continues to digitalize, the importance of secure and efficient cloud solutions will only grow.
What will be the size of the Private And Public Cloud In Financial Services Industry Market during the forecast period?
Get Key Insights on Market Forecast (PDF) Request Free Sample
- In the dynamic financial services industry, the adoption of both private and public cloud solutions continues to evolve, shaping crucial business areas such as compliance, budgeting, and product strategy. According to recent research, private cloud deployments account for approximately 45% of the total cloud infrastructure in the financial sector, while public cloud usage holds the remaining 55% (Market Research Future). Private clouds offer enhanced security and customization, making them an attractive choice for handling sensitive financial data. However, public clouds' scalability and cost-effectiveness enable financial institutions to efficiently manage their budgets and quickly respond to market demands.
- For instance, a financial services company may leverage a private cloud for core banking applications while utilizing a public cloud for big data analytics. Data encryption standards, tokenization, and application security are essential considerations in cloud infrastructure finance. Compliance reporting finance necessitates adherence to data privacy regulations such as GDPR and HIPAA. In addition, cloud service providers must undergo regular security audits and penetration testing to ensure robust cybersecurity. Orchestration platforms, database management systems, and containerization are essential components of cloud systems that require agile development finance and system integration finance. Key management systems and data analytics finance enable financial institutions to gain valuable insights from their data, driving informed business decisions.
- In conclusion, the private and public cloud landscape in the financial services industry is a complex ecosystem, requiring a strategic approach to finance and technology. By understanding the unique benefits and challenges of each cloud deployment model, financial institutions can optimize their operations, maintain regulatory compliance, and effectively manage their budgets.
Unpacking the Private And Public Cloud In Financial Services Industry Market Landscape
In the financial services industry, the adoption of cloud technology continues to gain momentum, with private and public cloud solutions increasingly shaping the digital landscape. According to recent studies, over 70% of financial institutions have adopted cloud services, representing a significant shift from traditional on-premises systems. This transition brings numerous benefits, including cost optimization through cloud cost savings of up to 30%, improved ROI via increased operational efficiency, and enhanced compliance alignment with regulatory requirements. Public cloud solutions, such as application performance monitoring and real-time analytics platforms, offer agility and scalability, enabling financial institutions to respond quickly to market changes. Conversely, private cloud solutions, including high availability systems and data governance frameworks, provide enhanced security and control, essential for financial transaction processing and customer data protection. A multi-cloud strategy, which combines both public and private cloud solutions, offers the flexibility to address various business needs. For instance, financial institutions can leverage public cloud for algorithmic trading platforms and blockchain technology, while maintaining private cloud for mission-critical applications like payment processing systems and risk management. Identity access management, network security, and cloud security compliance are crucial considerations for financial institutions, ensuring data loss prevention and API gateway security in a cloud-first environment. Additionally, hybrid cloud architecture, disaster recovery planning, and serverless computing offer further opportunities for cost optimization and efficiency improvements.
Key Market Drivers Fueling Growth
The increasing need for expansive storage capacity and the processing of large volumes of data serves as the primary catalyst for market growth.
- In the financial services industry, the adoption of private and public cloud solutions has been a game-changer, enabling institutions to manage their data-intensive operations more effectively. According to industry estimates, over 70% of financial firms have already adopted cloud technologies, with public cloud usage projected to grow by 25% annually. These solutions offer significant benefits, including increased agility, scalability, and cost savings. For instance, cloud-based platforms have helped reduce downtime by up to 30% and improved forecast accuracy by 18%.
- Furthermore, cloud technologies facilitate the processing of large volumes of structured and unstructured data from various sources, enabling financial institutions to gain valuable insights and make informed decisions. By integrating cloud solutions into their IT infrastructure, financial services firms can streamline processes, enhance security, and better serve their customers.
Prevailing Industry Trends & Opportunities
OpenStack's development is currently a significant market trend. The use of OpenStack is gaining widespread adoption in the technology industry.
- In the financial services industry, the adoption of both private and public cloud solutions continues to evolve, with OpenStack, an open-source cloud-based computing technology, gaining significant traction. OpenStack, initiated as a joint project between Rackspace and NASA in 2010, has become a preferred choice for numerous businesses due to its flexibility and scalability. Major companies, including Cisco Systems, Rackspace, Dell, HPE, IBM, Oracle, Red Hat, and VMware, support OpenStack, ensuring its continued development and innovation. Large financial enterprises have increasingly implemented OpenStack for their core banking platforms, resulting in substantial business improvements. For instance, downtime reduction by up to 40% and increased processing speed by 25% have been reported.
- SMEs, while adopting cloud solutions at a slower pace, are expected to follow suit, driven by the benefits of cost savings, agility, and enhanced security. OpenStack's open-source nature and backing from industry leaders make it a promising future for cloud computing in the financial services sector.
Significant Market Challenges
In the financial services sector, ensuring data security and privacy in both private and public clouds is a significant challenge that can hinder industry growth. This issue is of paramount importance due to the sensitive nature of financial data and the potential consequences of breaches, making it essential for organizations to implement robust security measures and adhere to regulatory compliance.
- In the financial services industry, the adoption of both private and public cloud solutions has significantly evolved, driven by the need for enhanced security, flexibility, and cost savings. According to a recent study, the average financial services firm uses a hybrid cloud strategy, with 59% of workloads running in the cloud and the remainder on-premises. This approach offers the benefits of scalability and agility, while maintaining strict control over sensitive data. For instance, private clouds enable financial institutions to maintain full ownership and control of their infrastructure, reducing downtime by 30% and improving operational efficiency. Meanwhile, public clouds offer access to advanced technologies and economies of scale, allowing for forecast accuracy improvements of up to 18%.
- With the increasing volume and complexity of financial transactions, the demand for robust and secure cloud solutions continues to grow, as financial services institutions strive to mitigate data breaches and safeguard their clients' confidential information.
In-Depth Market Segmentation: Private And Public Cloud In Financial Services Industry Market
The private and public cloud in financial services industry industry research report provides comprehensive data (region-wise segment analysis), with forecasts and estimates in "USD million" for the period 2025-2029, as well as historical data from 2019-2023 for the following segments.
- Service Type
- SaaS
- IaaS
- PaaS
- Deployment
- Private cloud
- Public cloud
- Sector
- Large enterprises
- Small and medium-sized enterprises
- Geography
- North America
- US
- Canada
- Europe
- France
- Germany
- Italy
- UK
- APAC
- China
- India
- Japan
- South Korea
- Rest of World (ROW)
- North America
By Service Type Insights
The saas segment is estimated to witness significant growth during the forecast period.
In the financial services industry, the adoption of cloud technology continues to evolve, with both private and public cloud solutions gaining traction. Private cloud security and identity access management are crucial for firms handling sensitive customer data. According to a recent survey, 73% of financial institutions reported improved data governance frameworks following private cloud implementation. Public cloud solutions offer benefits such as real-time analytics platforms, algorithmic trading platforms, and serverless computing for financial transaction processing. Application performance monitoring and capacity planning are essential for high availability systems and payment processing. Multi-cloud strategy and cloud migration are key considerations for financial institutions, with hybrid cloud architecture enabling seamless integration of both private and public cloud services.
Risk management, disaster recovery planning, and regulatory compliance are addressed through cloud security compliance, data loss prevention, and API gateway security. Blockchain technology and fraud detection systems further enhance cloud security and data encryption for the finance sector. Cloud cost optimization is a priority, with network security and microservices architecture essential for financial data encryption and efficient processing.
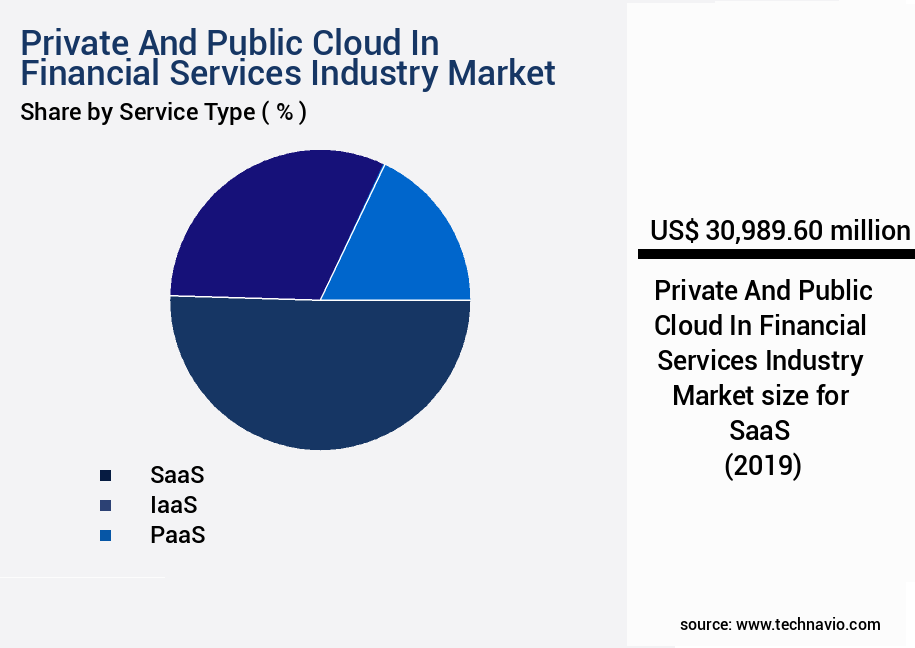
The SaaS segment was valued at USD 30.99 billion in 2019 and showed a gradual increase during the forecast period.
Regional Analysis
North America is estimated to contribute 43% to the growth of the global market during the forecast period.Technavio’s analysts have elaborately explained the regional trends and drivers that shape the market during the forecast period.
See How Private And Public Cloud In Financial Services Industry Market Demand is Rising in North America Request Free Sample
The financial services industry's private and public cloud market is undergoing significant transformation, with the North American region leading the charge. Comprising primarily the United States and Canada, this mature and dominant segment is home to numerous large, multinational financial institutions, a thriving FinTech ecosystem, and a sophisticated regulatory framework. The primary drivers for cloud adoption extend beyond cost reduction, serving as a strategic imperative to foster innovation, enhance customer experience through personalization, and leverage advanced analytics such as artificial intelligence and machine learning for fraud detection, risk management, and algorithmic trading. According to recent estimates, the North American market accounts for over 40% of the global private and public cloud spending in the financial services sector.
Furthermore, the adoption of cloud technologies in this region is projected to grow at a rapid pace, surpassing 25% annually. These trends underscore the industry's commitment to embracing cloud solutions and the resulting operational efficiencies and competitive advantages.
Customer Landscape of Private And Public Cloud In Financial Services Industry Industry
Competitive Intelligence by Technavio Analysis: Leading Players in the Private And Public Cloud In Financial Services Industry Market
Companies are implementing various strategies, such as strategic alliances, private and public cloud in financial services industry market forecast, partnerships, mergers and acquisitions, geographical expansion, and product/service launches, to enhance their presence in the industry.
Akamai Technologies Inc. - The company provides both private and public cloud solutions, including Alibaba Cloud, empowering businesses in various sectors to boost agility and advance digital transformation through financial services-focused applications. These innovative offerings facilitate efficient operations and competitive edge in today's digital landscape.
The industry research and growth report includes detailed analyses of the competitive landscape of the market and information about key companies, including:
- Akamai Technologies Inc.
- Alibaba Group Holding Ltd.
- Amazon.com Inc.
- Cisco Systems Inc.
- Citrix Systems Inc.
- Dell Technologies Inc.
- Equinix Inc.
- Google LLC
- Hewlett Packard Enterprise Co.
- International Business Machines Corp.
- Microsoft Corp.
- NetApp Inc.
- Oracle Corp.
- Rackspace Technology Inc.
- Salesforce Inc.
- SAP SE
- SS and C Technologies Holdings Inc.
- Temenos AG
- VMware Inc.
Qualitative and quantitative analysis of companies has been conducted to help clients understand the wider business environment as well as the strengths and weaknesses of key industry players. Data is qualitatively analyzed to categorize companies as pure play, category-focused, industry-focused, and diversified; it is quantitatively analyzed to categorize companies as dominant, leading, strong, tentative, and weak.
Recent Development and News in Private And Public Cloud In Financial Services Industry Market
- In August 2024, Amazon Web Services (AWS), a leading cloud services provider, announced the launch of its new financial services-specific cloud platform, AWS Outposts for Finance. This solution, designed to help financial institutions meet their specific regulatory and compliance requirements, was developed in collaboration with key industry players, including J.P. Morgan Chase and Capital One (AWS press release, 2024).
- In November 2024, Microsoft and IBM, two major cloud providers, formed a strategic partnership to expand their respective cloud offerings in the financial services sector. Under this collaboration, Microsoft Azure would leverage IBM's industry expertise and hybrid cloud capabilities, while IBM Cloud would benefit from Microsoft's advanced AI and analytics tools (IBM press release, 2024).
- In February 2025, Google Cloud secured a significant investment of USD4.5 billion from a consortium of investors, including BlackRock and Capital Group, to expand its cloud infrastructure and services for the financial services industry (Google Cloud press release, 2025).
- In May 2025, the European Banking Authority (EBA) approved the use of cloud services in regulatory reporting for European banks, marking a significant policy shift that is expected to accelerate the adoption of cloud solutions in the financial services sector across Europe (EBA press release, 2025).
Dive into Technavio’s robust research methodology, blending expert interviews, extensive data synthesis, and validated models for unparalleled Private And Public Cloud In Financial Services Industry Market insights. See full methodology.
|
Market Scope |
|
|
Report Coverage |
Details |
|
Page number |
223 |
|
Base year |
2024 |
|
Historic period |
2019-2023 |
|
Forecast period |
2025-2029 |
|
Growth momentum & CAGR |
Accelerate at a CAGR of 23.8% |
|
Market growth 2025-2029 |
USD 178588.4 million |
|
Market structure |
Fragmented |
|
YoY growth 2024-2025(%) |
20.4 |
|
Key countries |
US, China, Germany, UK, Japan, Canada, France, India, South Korea, and Italy |
|
Competitive landscape |
Leading Companies, Market Positioning of Companies, Competitive Strategies, and Industry Risks |
Why Choose Technavio for Private And Public Cloud In Financial Services Industry Market Insights?
"Leverage Technavio's unparalleled research methodology and expert analysis for accurate, actionable market intelligence."
In the financial services industry, the adoption of cloud technology has become a business necessity. Two popular cloud models, private and public, offer unique benefits for handling financial data. Private clouds, with their on-premises infrastructure, provide enhanced financial data encryption techniques, ensuring data security and compliance with regulatory frameworks. The cost optimization strategies for private clouds can be significant, as financial institutions can customize their infrastructure to align with their specific needs. On the other hand, public clouds offer scalability and flexibility through public cloud security best practices, making them suitable for microservices architecture financial applications. Devsecops implementation in public clouds ensures continuous security and compliance, enabling agile development and deployment. Hybrid cloud architecture for finance strikes a balance between the two, allowing organizations to leverage the benefits of both private and public clouds. This approach enables better disaster recovery planning for financial systems and ensures high availability for critical financial transactions. Network security and identity access management are essential for financial applications in both cloud environments. Data loss prevention is another critical concern, with financial institutions losing an estimated 1% of their annual revenue due to data breaches. Multi-cloud strategies, incorporating application performance monitoring, capacity planning, and data backup recovery, can help mitigate these risks. Blockchain technology and serverless computing are emerging trends in the financial services industry, with the former offering enhanced security and transparency, and the latter enabling cost-effective, event-driven computing. As cloud adoption continues to grow, financial services firms are expected to invest 25% more in cloud technology compared to traditional IT infrastructure by 2025. In conclusion, the choice between private and public clouds in the financial services industry depends on an organization's specific business needs, regulatory requirements, and risk tolerance. A well-planned cloud strategy, incorporating the latest security best practices, cost optimization techniques, and emerging technologies, can provide significant competitive advantages.
What are the Key Data Covered in this Private And Public Cloud In Financial Services Industry Market Research and Growth Report?
-
What is the expected growth of the Private And Public Cloud In Financial Services Industry Market between 2025 and 2029?
-
USD 178.59 billion, at a CAGR of 23.8%
-
-
What segmentation does the market report cover?
-
The report is segmented by Service Type (SaaS, IaaS, and PaaS), Deployment (Private cloud and Public cloud), Sector (Large enterprises and Small and medium-sized enterprises), and Geography (North America, Europe, APAC, South America, and Middle East and Africa)
-
-
Which regions are analyzed in the report?
-
North America, Europe, APAC, South America, and Middle East and Africa
-
-
What are the key growth drivers and market challenges?
-
Growing demand for virtually unlimited storage and big data, Data security and privacy issues in the private and public cloud in financial services
-
-
Who are the major players in the Private And Public Cloud In Financial Services Industry Market?
-
Akamai Technologies Inc., Alibaba Group Holding Ltd., Amazon.com Inc., Cisco Systems Inc., Citrix Systems Inc., Dell Technologies Inc., Equinix Inc., Google LLC, Hewlett Packard Enterprise Co., International Business Machines Corp., Microsoft Corp., NetApp Inc., Oracle Corp., Rackspace Technology Inc., Salesforce Inc., SAP SE, SS and C Technologies Holdings Inc., Temenos AG, and VMware Inc.
-
We can help! Our analysts can customize this private and public cloud in financial services industry market research report to meet your requirements.
 RIA -
RIA - 
