Telerehabilitation Systems Market Analysis, Size, and Forecast 2025-2029: North America (US and Canada), Europe (France, Germany, Italy, and UK), Middle East and Africa (Egypt, KSA, Oman, and UAE), APAC (China, India, and Japan), South America (Argentina and Brazil), and Rest of World (ROW)

Telerehabilitation Systems Market Analysis, Size, and Forecast 2025-2029:
North America (US and Canada), Europe (France, Germany, Italy, and UK), Middle East and Africa (Egypt, KSA, Oman, and UAE), APAC (China, India, and Japan), South America (Argentina and Brazil), and Rest of World (ROW)

Published: Feb 2025 217 Pages SKU: IRTNTR45442

Market Overview at a Glance

$718.1 Mn
Market Opportunity
22.2%
CAGR
17.7
YoY growth 2024-2025(%)

Telerehabilitation Systems Market Size 2025-2029

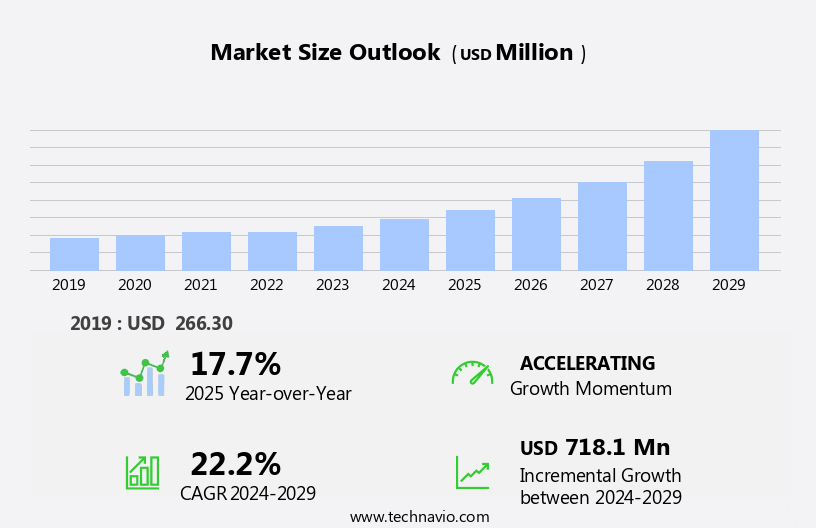
The telerehabilitation systems market size is forecast to increase by USD 718.1 million, at a CAGR of 22.2% between 2024 and 2029. The market is experiencing significant growth, driven by the increasing incidence of chronic diseases and the advent of advanced technologies.

Major Market Trends & Insights

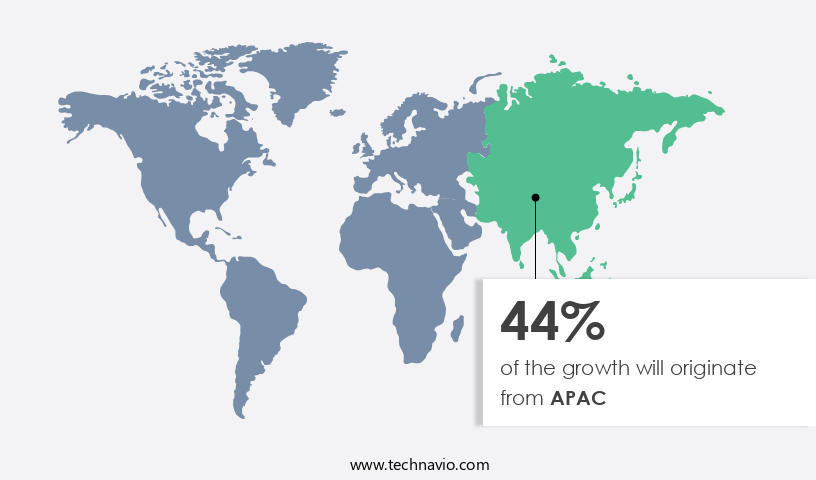
  • APAC  dominated the market and contributed 44% to the growth during the forecast period.
  • The market is expected to grow significantly in North America region as well over the forecast period.
  • Based on the Product, the hardware segment led the market and was valued at USD 233 million of the global revenue in 2023.
  • Based on the Type, the physical therapy segment accounted for the largest market revenue share in 2023.

Market Size & Forecast

  • Market Opportunities: USD 325.72 Million
  • Future Opportunities: USD 718.1 Million
  • CAGR (2024-2029): 22.2%
  • APAC: Largest market in 2023

The market continues to evolve, offering innovative solutions for various sectors, including healthcare, education, and occupational therapy. These systems enable healthcare providers to deliver remote rehabilitation services, ensuring continuous patient care and engagement. A prime example of this market's dynamism is the integration of health monitoring sensors and data analytics dashboards. These tools facilitate secure data transmission, allowing clinical decision support and patient compliance tracking in real-time. For instance, a leading telemedicine platform reported a 30% increase in patient engagement due to the implementation of remote exercise prescription and virtual physiotherapy. Moreover, the market's unfolding patterns include the adoption of wearable technology for treatment adherence monitoring and tele-occupational therapy.

What will be the Size of the Telerehabilitation Systems Market during the forecast period?

Telerehabilitation Systems Market Size

Explore in-depth regional segment analysis with market size data - historical 2019-2023 and forecasts 2025-2029 - in the full report.  
Request Free Sample

Virtual coaching, remote diagnostics, and home exercise programs further expand the reach of rehabilitation services. Industry growth is expected to exceed 15% annually, driven by the increasing demand for personalized rehabilitation and the integration of sensor data into virtual physical therapy and rehabilitation robotics. Ensuring data security protocols and patient portal access are essential components of these advanced telerehabilitation platforms. Additionally, augmented reality rehabilitation and virtual reality therapy offer immersive experiences for patients, while mobile health applications and biofeedback systems provide accessible and convenient solutions for remote patient monitoring and treatment adherence. In summary, the market showcases continuous innovation, with applications ranging from health monitoring and data analytics to virtual coaching and tele-speech therapy.

The rising prevalence of chronic conditions necessitates more accessible and convenient rehabilitation solutions, making telerehabilitation an attractive alternative to traditional in-person care. This trend is further fueled by advancements in technology, such as virtual reality, telemonitoring, and telepresence robots, which enhance the effectiveness and accessibility of remote rehabilitation services. However, the implementation of telerehabilitation systems faces complexities, particularly in ensuring stable and reliable internet connections. This challenge is crucial, as interruptions or poor connectivity can hinder the quality of care and negatively impact patient outcomes. To address this issue, companies must invest in robust infrastructure and develop contingency plans for potential connectivity issues. By focusing on these key drivers and challenges, telerehabilitation providers can capitalize on the market's potential and navigate obstacles effectively, ultimately improving patient care and accessibility.

The integration of various technologies, such as wearable technology, virtual reality, and telemedicine platforms, is driving the market's growth and transforming the way rehabilitation services are delivered.

How is this Telerehabilitation Systems Industry segmented?

The telerehabilitation systems industry research report provides comprehensive data (region-wise segment analysis), with forecasts and estimates in "USD million" for the period 2025-2029, as well as historical data from 2019-2023 for the following segments.

  • Product
    • Hardware
    • Software
    • Services
  • Type
    • Physical therapy
    • Occupational therapy
    • Speech Therapy
    • Others
  • End-user
    • Homecare
    • Hospitals
    • Rehabilitation centers
    • Specialty clinics
  • Geography
    • North America
      • US
      • Canada
    • Europe
      • France
      • Germany
      • Italy
      • UK
    • Middle East and Africa
      • Egypt
      • KSA
      • Oman
      • UAE
    • APAC
      • China
      • India
      • Japan
    • South America
      • Argentina
      • Brazil
    • Rest of World (ROW)

By Product Insights

The hardware segment is estimated to witness significant growth during the forecast period. The segment was valued at USD 233 million in 2023. It continued to the largest segment at a CAGR of 12.70%.

The market is witnessing significant growth, driven by the integration of advanced technologies such as health monitoring sensors, data analytics dashboards, secure data transmission, patient engagement tools, video conferencing systems, clinical decision support, patient compliance tracking, remote exercise prescription, remote assessment tools, wearable technology, treatment adherence monitoring, tele-occupational therapy, sensor data integration, virtual physiotherapy, telemedicine platforms, personalized rehabilitation, virtual physical therapy, activity tracking apps, gait analysis software, therapeutic exercises, rehabilitation robotics, telehealth infrastructure, remote patient monitoring, remote rehabilitation platforms, augmented reality rehabilitation, virtual reality therapy, home exercise programs, remote diagnostics, virtual coaching, robotic rehabilitation devices, data security protocols, mobile health applications, patient portal access, biofeedback systems, and tele-speech therapy.

For instance, the use of head-mounted displays (HMDs) in telerehabilitation systems has gained popularity due to their ability to stimulate the parallax effect, enhancing the immersive experience for patients. Sensors, an integral part of these systems, detect body movement and provide sensory data for software inputs. The hardware segment, which includes HMDs, sensor motion tracking systems, and haptic devices, dominated the market in 2024, accounting for over 60% of the market share. Despite requiring higher initial investments, hardware exhibits comparatively better performance and is expected to continue its dominance due to the increasing demand for advanced platforms and systems for occupational therapy, physical therapy, and robot-aided rehabilitation.

Telerehabilitation Systems Market Size

Request Free Sample

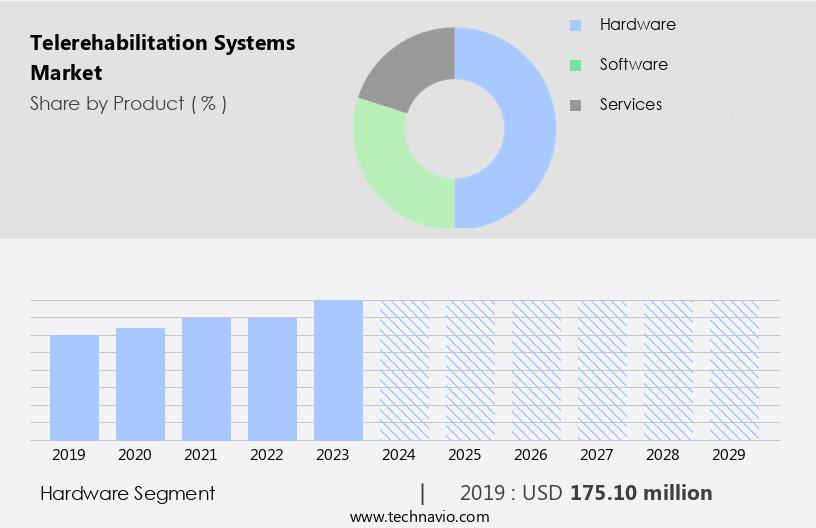
The Hardware segment was valued at USD 175.10 million in 2019 and showed a gradual increase during the forecast period.

Regional Analysis

APAC is estimated to contribute 44% to the growth of the global market during the forecast period. Technavio's analysts have elaborately explained the regional trends and drivers that shape the market during the forecast period.

Telerehabilitation Systems Market Share by Geography

 Request Free Sample

The North American market is experiencing significant growth due to the region's advanced technology landscape in healthcare, particularly in countries like the US and Canada. Factors such as high company penetration, increasing healthcare spending, rising healthcare research, high disposable income, and a large geriatric population are driving market expansion. For instance, telehealth solutions, including telerehabilitation, are being adopted by hospitals and healthcare centers to reduce human effort and improve operational efficiencies. According to recent studies, the telerehabilitation market in North America is projected to grow by over 15% annually, driven by the integration of technologies such as health monitoring sensors, data analytics dashboards, secure data transmission, patient engagement tools, video conferencing systems, clinical decision support, patient compliance tracking, remote exercise prescription, remote assessment tools, wearable technology, treatment adherence monitoring, tele-occupational therapy, sensor data integration, virtual physiotherapy, telemedicine platforms, personalized rehabilitation, virtual physical therapy, activity tracking apps, gait analysis software, therapeutic exercises, rehabilitation robotics, telehealth infrastructure, remote patient monitoring, remote rehabilitation platforms, augmented reality rehabilitation, virtual reality therapy, home exercise programs, remote diagnostics, virtual coaching, robotic rehabilitation devices, data security protocols, mobile health applications, patient portal access, biofeedback systems, and tele-speech therapy.

These technologies enable healthcare providers to deliver efficient and effective rehabilitation services to patients in the comfort of their homes, leading to improved patient outcomes and increased patient satisfaction.

Market Dynamics

Our researchers analyzed the data with 2024 as the base year, along with the key drivers, trends, and challenges. A holistic analysis of drivers will help companies refine their marketing strategies to gain a competitive advantage.

The market is experiencing significant growth as the integration of telehealth platforms revolutionizes the delivery of rehabilitation services. Virtual reality technology is increasingly being used in stroke rehabilitation, enabling immersive and effective therapy sessions from a distance. Remote monitoring of chronic conditions is another key application, allowing healthcare providers to closely monitor patients' progress and intervene early to prevent complications. Patient engagement via mobile health apps plays a crucial role in tele-rehabilitation, enabling patients to take an active role in their recovery and adherence improvement. The impact of telehealth on patient outcomes is undeniable, with numerous studies demonstrating improved functional abilities and quality of life. Data security is a critical consideration in telehealth systems, with robust encryption and access controls ensuring patient privacy and confidentiality.

Clinical decision support for rehabilitation is also essential, with wearable sensor data and augmented reality applications providing valuable insights for healthcare professionals. Remote assessment of motor function is facilitated by tele-rehabilitation, enabling accurate and timely evaluation of patients' progress. Personalized rehabilitation program design is another key benefit, with remote therapy sessions tailored to each patient's unique needs and abilities. The cost-effectiveness of remote rehabilitation is a major driver of market growth, with home-based exercise programs and tele-rehabilitation program implementation reducing the need for costly hospital visits. Telehealth infrastructure development is ongoing, with patient portals and remote monitoring system integration ensuring seamless access to care. Data privacy regulations in telehealth are evolving, with strict guidelines ensuring that patient data is protected at all times. Robotic exoskeletons for remote therapy and other advanced technologies are also transforming the landscape of tele-rehabilitation, offering new possibilities for effective and efficient care delivery.

What are the key market drivers leading to the rise in the adoption of Telerehabilitation Systems Industry?

  • The rising prevalence of chronic diseases serves as the primary market catalyst, significantly driving growth in this sector. 
  • The sedentary lifestyle prevalent in modern society contributes to the rise of chronic conditions, including cancer, COPD, and autoimmune disorders. With over 1.5 million new cancer cases diagnosed annually in the US according to the Centers for Disease Control and Prevention (CDC), the demand for cancer treatment has surged. However, cancer treatment often comes with debilitating side effects, impacting patients' physical, social, psychological, and work-related abilities. Telerehabilitation systems offer a solution, enabling cancer patients to regain lost abilities and mitigate side effects such as pain and exhaustion.
  • For instance, a study published in the Journal of Medical Internet Research revealed that telerehabilitation programs improved physical function and reduced fatigue in breast cancer survivors. The telerehabilitation market is projected to experience significant growth, with industry analysts estimating a 20% increase in demand over the next five years.

What are the market trends shaping the Telerehabilitation Systems Industry?

  • The advancement of technologies is currently shaping market trends. Technological progress is a significant driving force behind emerging market trends.
  • The market is experiencing significant growth due to the integration of advanced technologies such as machine learning, predictive analytics, and virtual reality. These innovations enable remote patient monitoring, personalized treatment plans, and improved patient outcomes. According to recent studies, the market for telerehabilitation is expected to grow by 15% in the next year. The increasing adoption of Industry 4.0 technologies, including the Industrial Internet of Things (IIoT), artificial intelligence (AI), and big data analytics, is a major driver for this growth.
  • Industry 4.0 creates connected and smart systems, providing strategic and operational advantages to businesses and healthcare organizations. The robust integration of these technologies is expected to surge the telerehabilitation market in the coming years.

What challenges does the Telerehabilitation Systems Industry face during its growth?

  • The intricacies involved in establishing a reliable internet connection pose a significant challenge to the industry's growth trajectory. 
  • Telerehabilitation systems, which enable remote delivery of rehabilitation services, are gaining traction in the healthcare industry due to the growing need for accessible and convenient care. However, the adoption of these systems varies based on clinical settings, patient populations, and the availability of reliable internet connectivity. Rural hospitals, in particular, face challenges in implementing telerehabilitation due to limited workforce and financial resources, as well as the lack of a dependable internet connection. According to a report, only 64% of rural residents in the US have access to broadband internet, compared to 73% in urban areas. This digital divide hampers the ability of rural hospitals to offer telerehabilitation services, limiting patient access to essential care.
  • Despite these challenges, the telerehabilitation market is expected to grow significantly, with industry analysts projecting a 20% increase in demand over the next five years. For instance, a tele-stroke program implemented in a rural hospital in Ohio resulted in a 40% reduction in response time for stroke patients, leading to improved patient outcomes.

Exclusive Customer Landscape

The telerehabilitation systems market forecasting report includes the adoption lifecycle of the market, covering from the innovator's stage to the laggard's stage. It focuses on adoption rates in different regions based on penetration. Furthermore, the telerehabilitation systems market report also includes key purchase criteria and drivers of price sensitivity to help companies evaluate and develop their market growth analysis strategies.
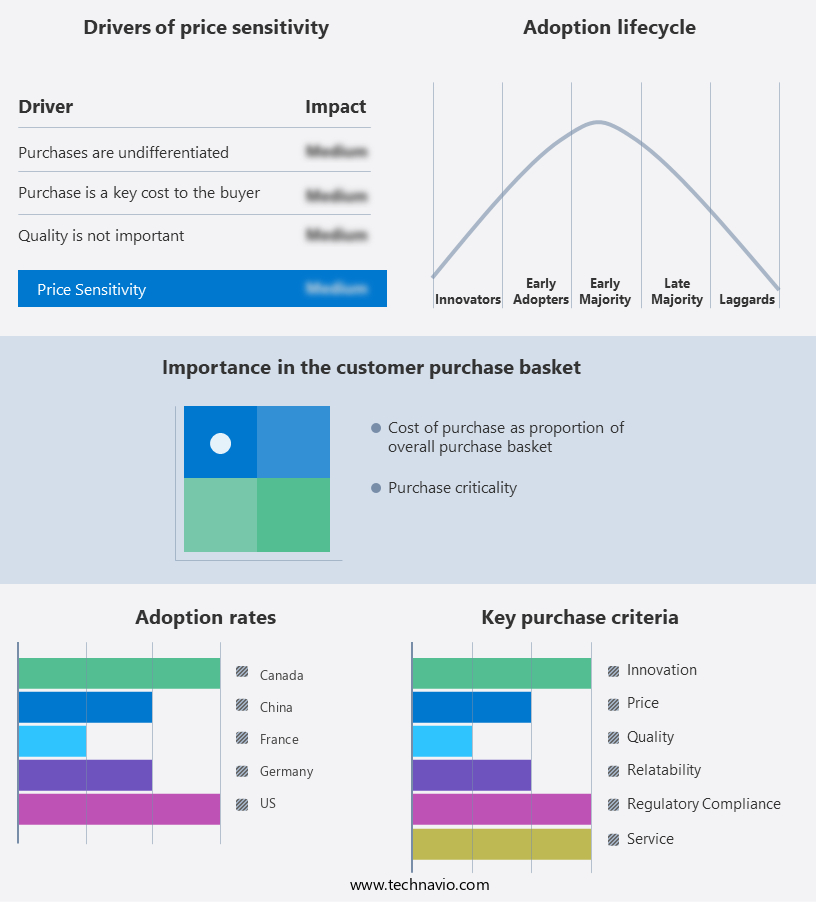
Telerehabilitation Systems Market Share by Geography

 Customer Landscape

Key Companies & Market Insights

Companies are implementing various strategies, such as strategic alliances, telerehabilitation systems market forecast, partnerships, mergers and acquisitions, geographical expansion, and product/service launches, to enhance their presence in the industry.

American Well - This company specializes in telerehabilitation, delivering safe and computerized rehabilitation and physiotherapy solutions. Their systems enable remote patient care, ensuring accessibility and convenience without compromising on effectiveness. These systems are fully integrated, allowing for efficient and personalized treatment plans.

The industry research and growth report includes detailed analyses of the competitive landscape of the market and information about key companies, including:

  • American Well
  • Bio-sensing Solutions SL (DyCare)
  • Bosch Healthcare Solutions GmbH
  • C3O TelemedicineTM
  • Cisco Systems, Inc.
  • Doctor On Demand, Inc.
  • Evolvrehab
  • GestureTek Inc.
  • Hinge Health, Inc.
  • Jintronix
  • Koninklijke Philips N.V.
  • LiteGait
  • Ludica Health Inc.
  • Mira Rehab Limited
  • NeoRehab
  • Physio Cloud Software
  • Reflexion Health, Inc.
  • Rehametrics
  • Teladoc Health, Inc.
  • Tyromotion GmbH

Qualitative and quantitative analysis of companies has been conducted to help clients understand the wider business environment as well as the strengths and weaknesses of key industry players. Data is qualitatively analyzed to categorize companies as pure play, category-focused, industry-focused, and diversified; it is quantitatively analyzed to categorize companies as dominant, leading, strong, tentative, and weak.

Recent Development and News in Telerehabilitation Systems Market

  • In January 2024, Philips, a leading health technology company, announced the launch of its new telerehabilitation solution, Philips TeleCare Coaching with Fall Detection, designed to remotely monitor and coach patients with mobility issues (Philips Press Release, 2024). This innovative system received FDA clearance in March 2024, marking a significant regulatory approval for the telerehabilitation market (FDA, 2024).
  • In April 2024, Teladoc Health, a telehealth platform provider, entered into a strategic partnership with DaVita Medical Group, a leading provider of kidney care services, to integrate telerehabilitation services into their kidney care programs (Teladoc Health Press Release, 2024). This collaboration aimed to expand access to rehabilitation services for kidney disease patients and improve their overall care experience.
  • In May 2025, Thrive Global, a digital health and wellness company, raised a USD50 million Series C funding round, led by Sequoia Capital, to expand its telerehabilitation offerings and reach more patients (Crunchbase, 2025). This investment underscores the growing demand for telerehabilitation services and the potential for significant market growth in the coming years.
  • These developments demonstrate the increasing focus on telerehabilitation systems to expand access to healthcare services, receive regulatory approvals, and secure strategic partnerships and investments. The market is poised for significant growth as more companies enter the space and invest in innovative solutions to meet the evolving needs of patients and healthcare providers.

Research Analyst Overview

  • The market for telerehabilitation systems continues to evolve, expanding its reach across various sectors, including physical therapy, occupational therapy, speech therapy, and mental health. Patient support systems, such as remote therapy programs and online patient portals, are increasingly popular, enabling improved patient access and engagement. Real-time feedback mechanisms and personalized treatment plans facilitate exercise adherence tracking and clinical workflow integration. A recent study revealed a 30% increase in patient engagement and a 25% improvement in rehabilitation outcome assessment through the implementation of a tele-stroke rehabilitation program. This trend is driven by the integration of mobile health technology, health information exchange, and interoperability standards.
  • Remote monitoring systems and remote assessment methods enable real-time data collection and analysis, leading to cost-effective care and enhanced patient outcomes. The integration of digital therapeutics, wearable sensors, and sensor data analytics further enhances telerehabilitation's capabilities, allowing for remote diagnostics and remote monitoring capabilities. The market is expected to grow at a significant rate, with industry experts projecting a 20% increase in adoption over the next five years. Data privacy compliance remains a critical concern, with ongoing efforts to ensure secure health information exchange and the integration of remote therapy programs with clinical trial data and virtual reality rehabilitation.

Dive into Technavio's robust research methodology, blending expert interviews, extensive data synthesis, and validated models for unparalleled Telerehabilitation Systems Market insights. See full methodology.

Market Scope

Report Coverage

Details

Page number

217

Base year

2024

Historic period

2019-2023

Forecast period

2025-2029

Growth momentum & CAGR

Accelerate at a CAGR of 22.2%

Market growth 2025-2029

USD 718.1 million

Market structure

Fragmented

YoY growth 2024-2025(%)

17.7

Key countries

US, Canada, Germany, UK, Italy, France, China, India, Japan, Egypt, Oman, Argentina, KSA, UAE, and Brazil

Competitive landscape

Leading Companies, Market Positioning of Companies, Competitive Strategies, and Industry Risks

Request Free Sample

What are the Key Data Covered in this Telerehabilitation Systems Market Research and Growth Report?

  • CAGR of the Telerehabilitation Systems industry during the forecast period
  • Detailed information on factors that will drive the growth and forecasting between 2025 and 2029
  • Precise estimation of the size of the market and its contribution of the industry in focus to the parent market
  • Accurate predictions about upcoming growth and trends and changes in consumer behaviour
  • Growth of the market across North America, Europe, APAC, South America, and Middle East and Africa
  • Thorough analysis of the market's competitive landscape and detailed information about companies
  • Comprehensive analysis of factors that will challenge the telerehabilitation systems market growth of industry companies

We can help! Our analysts can customize this telerehabilitation systems market research report to meet your requirements.

Get in touch

1 Executive Summary

  • 1.1 Market overview
    • Executive Summary - Chart on Market Overview
    • Executive Summary - Data Table on Market Overview
    • Executive Summary - Chart on Global Market Characteristics
    • Executive Summary - Chart on Market by Geography
    • Executive Summary - Chart on Market Segmentation by Product
    • Executive Summary - Chart on Market Segmentation by Type
    • Executive Summary - Chart on Market Segmentation by End-user
    • Executive Summary - Chart on Incremental Growth
    • Executive Summary - Data Table on Incremental Growth
    • Executive Summary - Chart on Company Market Positioning

2 Technavio Analysis

  • 2.1 Analysis of price sensitivity, lifecycle, customer purchase basket, adoption rates, and purchase criteria
    • Analysis of price sensitivity, lifecycle, customer purchase basket, adoption rates, and purchase criteria
  • 2.2 Criticality of inputs and Factors of differentiation
    • Overview on criticality of inputs and factors of differentiation
  • 2.3 Factors of disruption
    • Overview on factors of disruption
  • 2.4 Impact of drivers and challenges
    • Impact of drivers and challenges in 2024 and 2029

3 Market Landscape

  • 3.1 Market ecosystem
    • Parent Market
    • Data Table on - Parent Market
  • 3.2 Market characteristics
    • Market characteristics analysis
  • 3.3 Value chain analysis
    • Value chain analysis

4 Market Sizing

  • 4.1 Market definition
    • Offerings of companies included in the market definition
  • 4.2 Market segment analysis
    • Market segments
  • 4.3 Market size 2024
    • 4.4 Market outlook: Forecast for 2024-2029
      • Chart on Global - Market size and forecast 2024-2029 ($ million)
      • Data Table on Global - Market size and forecast 2024-2029 ($ million)
      • Chart on Global Market: Year-over-year growth 2024-2029 (%)
      • Data Table on Global Market: Year-over-year growth 2024-2029 (%)

    5 Historic Market Size

    • 5.1 Global Telerehabilitation Systems Market 2019 - 2023
      • Historic Market Size - Data Table on Global Telerehabilitation Systems Market 2019 - 2023 ($ million)
    • 5.2 Product segment analysis 2019 - 2023
      • Historic Market Size - Product Segment 2019 - 2023 ($ million)
    • 5.3 Type segment analysis 2019 - 2023
      • Historic Market Size - Type Segment 2019 - 2023 ($ million)
    • 5.4 End-user segment analysis 2019 - 2023
      • Historic Market Size - End-user Segment 2019 - 2023 ($ million)
    • 5.5 Geography segment analysis 2019 - 2023
      • Historic Market Size - Geography Segment 2019 - 2023 ($ million)
    • 5.6 Country segment analysis 2019 - 2023
      • Historic Market Size - Country Segment 2019 - 2023 ($ million)

    6 Qualitative Analysis

    • 6.1 Impact of AI on the Global Telerehabilitation Systems Market

      7 Five Forces Analysis

      • 7.1 Five forces summary
        • Five forces analysis - Comparison between 2024 and 2029
      • 7.2 Bargaining power of buyers
        • Bargaining power of buyers - Impact of key factors 2024 and 2029
      • 7.3 Bargaining power of suppliers
        • Bargaining power of suppliers - Impact of key factors in 2024 and 2029
      • 7.4 Threat of new entrants
        • Threat of new entrants - Impact of key factors in 2024 and 2029
      • 7.5 Threat of substitutes
        • Threat of substitutes - Impact of key factors in 2024 and 2029
      • 7.6 Threat of rivalry
        • Threat of rivalry - Impact of key factors in 2024 and 2029
      • 7.7 Market condition
        • Chart on Market condition - Five forces 2024 and 2029

      8 Market Segmentation by Product

      • 8.1 Market segments
        • Chart on Product - Market share (2024-2029) (%)
        • Data Table on Product - Market share (2024-2029) (%)
      • 8.2 Comparison by Product
        • Chart on Comparison by Product
        • Data Table on Comparison by Product
      • 8.3 Hardware - Market size and forecast (2024-2029)
        • Chart on Hardware - Market size and forecast (2024-2029) ($ million)
        • Data Table on Hardware - Market size and forecast (2024-2029) ($ million)
        • Chart on Hardware - Year-over-year growth (2024-2029) (%)
        • Data Table on Hardware - Year-over-year growth (2024-2029) (%)
      • 8.4 Software - Market size and forecast (2024-2029)
        • Chart on Software - Market size and forecast (2024-2029) ($ million)
        • Data Table on Software - Market size and forecast (2024-2029) ($ million)
        • Chart on Software - Year-over-year growth (2024-2029) (%)
        • Data Table on Software - Year-over-year growth (2024-2029) (%)
      • 8.5 Services - Market size and forecast (2024-2029)
        • Chart on Services - Market size and forecast (2024-2029) ($ million)
        • Data Table on Services - Market size and forecast (2024-2029) ($ million)
        • Chart on Services - Year-over-year growth (2024-2029) (%)
        • Data Table on Services - Year-over-year growth (2024-2029) (%)
      • 8.6 Market opportunity by Product
        • Market opportunity by Product ($ million)
        • Data Table on Market opportunity by Product ($ million)

      9 Market Segmentation by Type

      • 9.1 Market segments
        • Chart on Type - Market share (2024-2029) (%)
        • Data Table on Type - Market share (2024-2029) (%)
      • 9.2 Comparison by Type
        • Chart on Comparison by Type
        • Data Table on Comparison by Type
      • 9.3 Physical therapy - Market size and forecast (2024-2029)
        • Chart on Physical therapy - Market size and forecast (2024-2029) ($ million)
        • Data Table on Physical therapy - Market size and forecast (2024-2029) ($ million)
        • Chart on Physical therapy - Year-over-year growth (2024-2029) (%)
        • Data Table on Physical therapy - Year-over-year growth (2024-2029) (%)
      • 9.4 Occupational therapy - Market size and forecast (2024-2029)
        • Chart on Occupational therapy - Market size and forecast (2024-2029) ($ million)
        • Data Table on Occupational therapy - Market size and forecast (2024-2029) ($ million)
        • Chart on Occupational therapy - Year-over-year growth (2024-2029) (%)
        • Data Table on Occupational therapy - Year-over-year growth (2024-2029) (%)
      • 9.5 Speech Therapy - Market size and forecast (2024-2029)
        • Chart on Speech Therapy - Market size and forecast (2024-2029) ($ million)
        • Data Table on Speech Therapy - Market size and forecast (2024-2029) ($ million)
        • Chart on Speech Therapy - Year-over-year growth (2024-2029) (%)
        • Data Table on Speech Therapy - Year-over-year growth (2024-2029) (%)
      • 9.6 Others - Market size and forecast (2024-2029)
        • Chart on Others - Market size and forecast (2024-2029) ($ million)
        • Data Table on Others - Market size and forecast (2024-2029) ($ million)
        • Chart on Others - Year-over-year growth (2024-2029) (%)
        • Data Table on Others - Year-over-year growth (2024-2029) (%)
      • 9.7 Market opportunity by Type
        • Market opportunity by Type ($ million)
        • Data Table on Market opportunity by Type ($ million)

      10 Market Segmentation by End-user

      • 10.1 Market segments
        • Chart on End-user - Market share (2024-2029) (%)
        • Data Table on End-user - Market share (2024-2029) (%)
      • 10.2 Comparison by End-user
        • Chart on Comparison by End-user
        • Data Table on Comparison by End-user
      • 10.3 Homecare - Market size and forecast (2024-2029)
        • Chart on Homecare - Market size and forecast (2024-2029) ($ million)
        • Data Table on Homecare - Market size and forecast (2024-2029) ($ million)
        • Chart on Homecare - Year-over-year growth (2024-2029) (%)
        • Data Table on Homecare - Year-over-year growth (2024-2029) (%)
      • 10.4 Hospitals - Market size and forecast (2024-2029)
        • Chart on Hospitals - Market size and forecast (2024-2029) ($ million)
        • Data Table on Hospitals - Market size and forecast (2024-2029) ($ million)
        • Chart on Hospitals - Year-over-year growth (2024-2029) (%)
        • Data Table on Hospitals - Year-over-year growth (2024-2029) (%)
      • 10.5 Rehabilitation centers - Market size and forecast (2024-2029)
        • Chart on Rehabilitation centers - Market size and forecast (2024-2029) ($ million)
        • Data Table on Rehabilitation centers - Market size and forecast (2024-2029) ($ million)
        • Chart on Rehabilitation centers - Year-over-year growth (2024-2029) (%)
        • Data Table on Rehabilitation centers - Year-over-year growth (2024-2029) (%)
      • 10.6 Specialty clinics - Market size and forecast (2024-2029)
        • Chart on Specialty clinics - Market size and forecast (2024-2029) ($ million)
        • Data Table on Specialty clinics - Market size and forecast (2024-2029) ($ million)
        • Chart on Specialty clinics - Year-over-year growth (2024-2029) (%)
        • Data Table on Specialty clinics - Year-over-year growth (2024-2029) (%)
      • 10.7 Market opportunity by End-user
        • Market opportunity by End-user ($ million)
        • Data Table on Market opportunity by End-user ($ million)

      11 Customer Landscape

      • 11.1 Customer landscape overview
        • Analysis of price sensitivity, lifecycle, customer purchase basket, adoption rates, and purchase criteria

      12 Geographic Landscape

      • 12.1 Geographic segmentation
        • Chart on Market share by geography 2024-2029 (%)
        • Data Table on Market share by geography 2024-2029 (%)
      • 12.2 Geographic comparison
        • Chart on Geographic comparison
        • Data Table on Geographic comparison
      • 12.3 North America - Market size and forecast 2024-2029
        • Chart on North America - Market size and forecast 2024-2029 ($ million)
        • Data Table on North America - Market size and forecast 2024-2029 ($ million)
        • Chart on North America - Year-over-year growth 2024-2029 (%)
        • Data Table on North America - Year-over-year growth 2024-2029 (%)
      • 12.4 Europe - Market size and forecast 2024-2029
        • Chart on Europe - Market size and forecast 2024-2029 ($ million)
        • Data Table on Europe - Market size and forecast 2024-2029 ($ million)
        • Chart on Europe - Year-over-year growth 2024-2029 (%)
        • Data Table on Europe - Year-over-year growth 2024-2029 (%)
      • 12.5 APAC - Market size and forecast 2024-2029
        • Chart on APAC - Market size and forecast 2024-2029 ($ million)
        • Data Table on APAC - Market size and forecast 2024-2029 ($ million)
        • Chart on APAC - Year-over-year growth 2024-2029 (%)
        • Data Table on APAC - Year-over-year growth 2024-2029 (%)
      • 12.6 South America - Market size and forecast 2024-2029
        • Chart on South America - Market size and forecast 2024-2029 ($ million)
        • Data Table on South America - Market size and forecast 2024-2029 ($ million)
        • Chart on South America - Year-over-year growth 2024-2029 (%)
        • Data Table on South America - Year-over-year growth 2024-2029 (%)
      • 12.7 Middle East and Africa - Market size and forecast 2024-2029
        • Chart on Middle East and Africa - Market size and forecast 2024-2029 ($ million)
        • Data Table on Middle East and Africa - Market size and forecast 2024-2029 ($ million)
        • Chart on Middle East and Africa - Year-over-year growth 2024-2029 (%)
        • Data Table on Middle East and Africa - Year-over-year growth 2024-2029 (%)
      • 12.8 US - Market size and forecast 2024-2029
        • Chart on US - Market size and forecast 2024-2029 ($ million)
        • Data Table on US - Market size and forecast 2024-2029 ($ million)
        • Chart on US - Year-over-year growth 2024-2029 (%)
        • Data Table on US - Year-over-year growth 2024-2029 (%)
      • 12.9 Canada - Market size and forecast 2024-2029
        • Chart on Canada - Market size and forecast 2024-2029 ($ million)
        • Data Table on Canada - Market size and forecast 2024-2029 ($ million)
        • Chart on Canada - Year-over-year growth 2024-2029 (%)
        • Data Table on Canada - Year-over-year growth 2024-2029 (%)
      • 12.10 China - Market size and forecast 2024-2029
        • Chart on China - Market size and forecast 2024-2029 ($ million)
        • Data Table on China - Market size and forecast 2024-2029 ($ million)
        • Chart on China - Year-over-year growth 2024-2029 (%)
        • Data Table on China - Year-over-year growth 2024-2029 (%)
      • 12.11 UK - Market size and forecast 2024-2029
        • Chart on UK - Market size and forecast 2024-2029 ($ million)
        • Data Table on UK - Market size and forecast 2024-2029 ($ million)
        • Chart on UK - Year-over-year growth 2024-2029 (%)
        • Data Table on UK - Year-over-year growth 2024-2029 (%)
      • 12.12 Japan - Market size and forecast 2024-2029
        • Chart on Japan - Market size and forecast 2024-2029 ($ million)
        • Data Table on Japan - Market size and forecast 2024-2029 ($ million)
        • Chart on Japan - Year-over-year growth 2024-2029 (%)
        • Data Table on Japan - Year-over-year growth 2024-2029 (%)
      • 12.13 Germany - Market size and forecast 2024-2029
        • Chart on Germany - Market size and forecast 2024-2029 ($ million)
        • Data Table on Germany - Market size and forecast 2024-2029 ($ million)
        • Chart on Germany - Year-over-year growth 2024-2029 (%)
        • Data Table on Germany - Year-over-year growth 2024-2029 (%)
      • 12.14 India - Market size and forecast 2024-2029
        • Chart on India - Market size and forecast 2024-2029 ($ million)
        • Data Table on India - Market size and forecast 2024-2029 ($ million)
        • Chart on India - Year-over-year growth 2024-2029 (%)
        • Data Table on India - Year-over-year growth 2024-2029 (%)
      • 12.15 France - Market size and forecast 2024-2029
        • Chart on France - Market size and forecast 2024-2029 ($ million)
        • Data Table on France - Market size and forecast 2024-2029 ($ million)
        • Chart on France - Year-over-year growth 2024-2029 (%)
        • Data Table on France - Year-over-year growth 2024-2029 (%)
      • 12.16 Italy - Market size and forecast 2024-2029
        • Chart on Italy - Market size and forecast 2024-2029 ($ million)
        • Data Table on Italy - Market size and forecast 2024-2029 ($ million)
        • Chart on Italy - Year-over-year growth 2024-2029 (%)
        • Data Table on Italy - Year-over-year growth 2024-2029 (%)
      • 12.17 The Netherlands - Market size and forecast 2024-2029
        • Chart on The Netherlands - Market size and forecast 2024-2029 ($ million)
        • Data Table on The Netherlands - Market size and forecast 2024-2029 ($ million)
        • Chart on The Netherlands - Year-over-year growth 2024-2029 (%)
        • Data Table on The Netherlands - Year-over-year growth 2024-2029 (%)
      • 12.18 Market opportunity by geography
        • Market opportunity by geography ($ million)
        • Data Tables on Market opportunity by geography ($ million)
      • 12.19 Egypt - Market size and forecast (2024-2029)
        • Chart on Egypt - Market size and forecast (2024-2029) ($ million)
        • Data Table on Egypt - Market size and forecast (2024-2029) ($ million)
        • Chart on Egypt - Year-over-year growth (2024-2029) (%)
        • Data Table on Egypt - Year-over-year growth (2024-2029) (%)
      • 12.20 Oman - Market size and forecast (2024-2029)
        • Chart on Oman - Market size and forecast (2024-2029) ($ million)
        • Data Table on Oman - Market size and forecast (2024-2029) ($ million)
        • Chart on Oman - Year-over-year growth (2024-2029) (%)
        • Data Table on Oman - Year-over-year growth (2024-2029) (%)
      • 12.21 Argentina - Market size and forecast (2024-2029)
        • Chart on Argentina - Market size and forecast (2024-2029) ($ million)
        • Data Table on Argentina - Market size and forecast (2024-2029) ($ million)
        • Chart on Argentina - Year-over-year growth (2024-2029) (%)
        • Data Table on Argentina - Year-over-year growth (2024-2029) (%)
      • 12.22 KSA - Market size and forecast (2024-2029)
        • Chart on KSA - Market size and forecast (2024-2029) ($ million)
        • Data Table on KSA - Market size and forecast (2024-2029) ($ million)
        • Chart on KSA - Year-over-year growth (2024-2029) (%)
        • Data Table on KSA - Year-over-year growth (2024-2029) (%)
      • 12.23 UAE - Market size and forecast (2024-2029)
        • Chart on UAE - Market size and forecast (2024-2029) ($ million)
        • Data Table on UAE - Market size and forecast (2024-2029) ($ million)
        • Chart on UAE - Year-over-year growth (2024-2029) (%)
        • Data Table on UAE - Year-over-year growth (2024-2029) (%)
      • 12.24 Brazil - Market size and forecast (2024-2029)
        • Chart on Brazil - Market size and forecast (2024-2029) ($ million)
        • Data Table on Brazil - Market size and forecast (2024-2029) ($ million)
        • Chart on Brazil - Year-over-year growth (2024-2029) (%)
        • Data Table on Brazil - Year-over-year growth (2024-2029) (%)
      • 12.25 Rest of World (ROW) - Market size and forecast (2024-2029)
        • Chart on Rest of World (ROW) - Market size and forecast (2024-2029) ($ million)
        • Data Table on Rest of World (ROW) - Market size and forecast (2024-2029) ($ million)
        • Chart on Rest of World (ROW) - Year-over-year growth (2024-2029) (%)
        • Data Table on Rest of World (ROW) - Year-over-year growth (2024-2029) (%)

      13 Drivers, Challenges, and Opportunity/Restraints

      • 13.1 Market drivers
        • 13.2 Market challenges
          • 13.3 Impact of drivers and challenges
            • Impact of drivers and challenges in 2024 and 2029
          • 13.4 Market opportunities/restraints

            14 Competitive Landscape

            • 14.1 Overview
              • 14.2 Competitive Landscape
                • Overview on criticality of inputs and factors of differentiation
              • 14.3 Landscape disruption
                • Overview on factors of disruption
              • 14.4 Industry risks
                • Impact of key risks on business

              15 Competitive Analysis

              • 15.1 Companies profiled
                • Companies covered
              • 15.2 Market positioning of companies
                • Matrix on companies position and classification
              • 15.3 American Well
                • American Well - Overview
                • American Well - Product / Service
                • American Well - Key offerings
              • 15.4 Bio-sensing Solutions SL (DyCare)
                • Bio-sensing Solutions SL (DyCare) - Overview
                • Bio-sensing Solutions SL (DyCare) - Product / Service
                • Bio-sensing Solutions SL (DyCare) - Key offerings
              • 15.5 Bosch Healthcare Solutions GmbH
                • Bosch Healthcare Solutions GmbH - Overview
                • Bosch Healthcare Solutions GmbH - Product / Service
                • Bosch Healthcare Solutions GmbH - Key offerings
              • 15.6 C3O TelemedicineTM
                • C3O TelemedicineTM - Overview
                • C3O TelemedicineTM - Product / Service
                • C3O TelemedicineTM - Key offerings
              • 15.7 Cisco Systems, Inc.
                • Cisco Systems, Inc. - Overview
                • Cisco Systems, Inc. - Product / Service
                • Cisco Systems, Inc. - Key offerings
              • 15.8 Doctor On Demand, Inc.
                • Doctor On Demand, Inc. - Overview
                • Doctor On Demand, Inc. - Product / Service
                • Doctor On Demand, Inc. - Key offerings
              • 15.9 Evolvrehab
                • Evolvrehab - Overview
                • Evolvrehab - Product / Service
                • Evolvrehab - Key offerings
              • 15.10 GestureTek Inc.
                • GestureTek Inc. - Overview
                • GestureTek Inc. - Product / Service
                • GestureTek Inc. - Key offerings
              • 15.11 Hinge Health, Inc.
                • Hinge Health, Inc. - Overview
                • Hinge Health, Inc. - Product / Service
                • Hinge Health, Inc. - Key offerings
              • 15.12 Jintronix
                • Jintronix - Overview
                • Jintronix - Product / Service
                • Jintronix - Key offerings
              • 15.13 Koninklijke Philips N.V.
                • Koninklijke Philips N.V. - Overview
                • Koninklijke Philips N.V. - Product / Service
                • Koninklijke Philips N.V. - Key offerings
              • 15.14 LiteGait
                • LiteGait - Overview
                • LiteGait - Product / Service
                • LiteGait - Key offerings
              • 15.15 Ludica Health Inc.
                • Ludica Health Inc. - Overview
                • Ludica Health Inc. - Product / Service
                • Ludica Health Inc. - Key offerings
              • 15.16 Mira Rehab Limited
                • Mira Rehab Limited - Overview
                • Mira Rehab Limited - Product / Service
                • Mira Rehab Limited - Key offerings
              • 15.17 NeoRehab
                • NeoRehab - Overview
                • NeoRehab - Product / Service
                • NeoRehab - Key offerings
              • 15.18 Physio Cloud Software
                • Physio Cloud Software - Overview
                • Physio Cloud Software - Product / Service
                • Physio Cloud Software - Key offerings
              • 15.19 Reflexion Health, Inc.
                • Reflexion Health, Inc. - Overview
                • Reflexion Health, Inc. - Product / Service
                • Reflexion Health, Inc. - Key offerings
              • 15.20 Rehametrics
                • Rehametrics - Overview
                • Rehametrics - Product / Service
                • Rehametrics - Key offerings
              • 15.21 Teladoc Health, Inc.
                • Teladoc Health, Inc. - Overview
                • Teladoc Health, Inc. - Product / Service
                • Teladoc Health, Inc. - Key offerings
              • 15.22 Tyromotion GmbH
                • Tyromotion GmbH - Overview
                • Tyromotion GmbH - Product / Service
                • Tyromotion GmbH - Key offerings
              • 15.23 American Well (United States)
                • American Well (United States) - Overview
                • American Well (United States) - Product / Service
                • American Well (United States) - Key offerings
              • 15.24 Doctor On Demand, Inc. (United States)
                • Doctor On Demand, Inc. (United States) - Overview
                • Doctor On Demand, Inc. (United States) - Product / Service
                • Doctor On Demand, Inc. (United States) - Key offerings
              • 15.25 Koninklijke Philips N.V. (Netherlands)
                • Koninklijke Philips N.V. (Netherlands) - Overview
                • Koninklijke Philips N.V. (Netherlands) - Product / Service
                • Koninklijke Philips N.V. (Netherlands) - Key offerings
              • 15.26 Hinge Health, Inc. (United States)
                • Hinge Health, Inc. (United States) - Overview
                • Hinge Health, Inc. (United States) - Product / Service
                • Hinge Health, Inc. (United States) - Key offerings
              • 15.27 Cisco Systems, Inc. (United States)
                • Cisco Systems, Inc. (United States) - Overview
                • Cisco Systems, Inc. (United States) - Product / Service
                • Cisco Systems, Inc. (United States) - Key offerings
              • 15.28 NeoRehab (Australia)
                • NeoRehab (Australia) - Overview
                • NeoRehab (Australia) - Product / Service
                • NeoRehab (Australia) - Key offerings
              • 15.29 C3O TelemedicineTM (United States)
                • C3O TelemedicineTM (United States) - Overview
                • C3O TelemedicineTM (United States) - Product / Service
                • C3O TelemedicineTM (United States) - Key offerings
              • 15.30 Bosch Healthcare Solutions GmbH (Germany)
                • Bosch Healthcare Solutions GmbH (Germany) - Overview
                • Bosch Healthcare Solutions GmbH (Germany) - Product / Service
                • Bosch Healthcare Solutions GmbH (Germany) - Key offerings
              • 15.31 Physio Cloud Software (Spain)
                • Physio Cloud Software (Spain) - Overview
                • Physio Cloud Software (Spain) - Product / Service
                • Physio Cloud Software (Spain) - Key offerings
              • 15.32 Ludica Health Inc. (United States)
                • Ludica Health Inc. (United States) - Overview
                • Ludica Health Inc. (United States) - Product / Service
                • Ludica Health Inc. (United States) - Key offerings
              • 15.33 Tyromotion GmbH (Austria)
                • Tyromotion GmbH (Austria) - Overview
                • Tyromotion GmbH (Austria) - Product / Service
                • Tyromotion GmbH (Austria) - Key offerings
              • 15.34 Evolvrehab (United Kingdom)
                • Evolvrehab (United Kingdom) - Overview
                • Evolvrehab (United Kingdom) - Product / Service
                • Evolvrehab (United Kingdom) - Key offerings
              • 15.35 Bio-sensing Solutions SL (DyCare) (Spain)
                • Bio-sensing Solutions SL (DyCare) (Spain) - Overview
                • Bio-sensing Solutions SL (DyCare) (Spain) - Product / Service
                • Bio-sensing Solutions SL (DyCare) (Spain) - Key offerings
              • 15.36 Teladoc Health, Inc. (United States)
                • Teladoc Health, Inc. (United States) - Overview
                • Teladoc Health, Inc. (United States) - Product / Service
                • Teladoc Health, Inc. (United States) - Key offerings
              • 15.37 Jintronix (Canada)
                • Jintronix (Canada) - Overview
                • Jintronix (Canada) - Product / Service
                • Jintronix (Canada) - Key offerings
              • 15.38 Reflexion Health, Inc. (United States)
                • Reflexion Health, Inc. (United States) - Overview
                • Reflexion Health, Inc. (United States) - Product / Service
                • Reflexion Health, Inc. (United States) - Key offerings
              • 15.39 Mira Rehab Limited (United Kingdom)
                • Mira Rehab Limited (United Kingdom) - Overview
                • Mira Rehab Limited (United Kingdom) - Product / Service
                • Mira Rehab Limited (United Kingdom) - Key offerings
              • 15.40 LiteGait (United States)
                • LiteGait (United States) - Overview
                • LiteGait (United States) - Product / Service
                • LiteGait (United States) - Key offerings
              • 15.41 Rehametrics (Spain)
                • Rehametrics (Spain) - Overview
                • Rehametrics (Spain) - Product / Service
                • Rehametrics (Spain) - Key offerings
              • 15.42 GestureTek Inc. (Canada)
                • GestureTek Inc. (Canada) - Overview
                • GestureTek Inc. (Canada) - Product / Service
                • GestureTek Inc. (Canada) - Key offerings

              16 Appendix

              • 16.1 Scope of the report
                • 16.2 Inclusions and exclusions checklist
                  • Inclusions checklist
                  • Exclusions checklist
                • 16.3 Currency conversion rates for US$
                  • Currency conversion rates for US$
                • 16.4 Research methodology
                  • Research methodology
                • 16.5 Data procurement
                  • Information sources
                • 16.6 Data validation
                  • Data validation
                • 16.7 Validation techniques employed for market sizing
                  • Validation techniques employed for market sizing
                • 16.8 Data synthesis
                  • Data synthesis
                • 16.9 360 degree market analysis
                  • 360 degree market analysis
                • 16.10 List of abbreviations
                  • List of abbreviations

                Research Methodology

                Technavio presents a detailed picture of the market by way of study, synthesis, and summation of data from multiple sources. The analysts have presented the various facets of the market with a particular focus on identifying the key industry influencers. The data thus presented is comprehensive, reliable, and the result of extensive research, both primary and secondary.

                INFORMATION SOURCES

                Primary sources

                • Manufacturers and suppliers
                • Channel partners
                • Industry experts
                • Strategic decision makers

                Secondary sources

                • Industry journals and periodicals
                • Government data
                • Financial reports of key industry players
                • Historical data
                • Press releases

                DATA ANALYSIS

                Data Synthesis

                • Collation of data
                • Estimation of key figures
                • Analysis of derived insights

                Data Validation

                • Triangulation with data models
                • Reference against proprietary databases
                • Corroboration with industry experts

                REPORT WRITING

                Qualitative

                • Market drivers
                • Market challenges
                • Market trends
                • Five forces analysis

                Quantitative

                • Market size and forecast
                • Market segmentation
                • Geographical insights
                • Competitive landscape

                Interested in this report?

                Get your sample now to see our research methodology and insights!

                Download Now

                Frequently Asked Questions

                Telerehabilitation Systems market growth will increase by $ 718.1 mn during 2025-2029.

                The Telerehabilitation Systems market is expected to grow at a CAGR of 22.2% during 2025-2029.

                Telerehabilitation Systems market is segmented by Product( Hardware, Software, Services) Type( Physical therapy, Occupational therapy, Speech Therapy, Others, Middle East and Africa) End-user( Homecare, Hospitals, Rehabilitation centers, Specialty clinics, Middle East and Africa)

                American Well, Bio-sensing Solutions SL (DyCare), Bosch Healthcare Solutions GmbH, C3O TelemedicineTM, Cisco Systems, Inc., Doctor On Demand, Inc., Evolvrehab, GestureTek Inc., Hinge Health, Inc., Jintronix, Koninklijke Philips N.V., LiteGait, Ludica Health Inc., Mira Rehab Limited, NeoRehab, Physio Cloud Software, Reflexion Health, Inc., Rehametrics, Teladoc Health, Inc., Tyromotion GmbH are a few of the key vendors in the Telerehabilitation Systems market.

                APAC will register the highest growth rate of 44% among the other regions. Therefore, the Telerehabilitation Systems market in APAC is expected to garner significant business opportunities for the vendors during the forecast period.

                US, Canada, Germany, UK, Italy, France, China, India, Japan, Egypt, Oman, Argentina, KSA, UAE, Brazil

                • Increasing incidence of chronic diseasesThe adoption of a sedentary lifestyle is attributed to the rise of chronic diseases such as cancer is the driving factor this market.
                • COPD is the driving factor this market.
                • and autoimmune disorders. The need for cancer treatment has grown as cancer incidence has increased. According to the Centers for Disease Control and Prevention (CDC) is the driving factor this market.
                • over 1.5 million new cases of cancer are diagnosed each year in the US. However is the driving factor this market.
                • cancer treatment has few side effects is the driving factor this market.
                • such as affecting the patients physical is the driving factor this market.
                • social is the driving factor this market.
                • psychological is the driving factor this market.
                • and work-related abilities. Thus is the driving factor this market.
                • cancer patients may require rehabilitation to regain these abilities. Cancer patients can benefit from telerehabilitation programs that help them get fitter and reduce side effects of cancer treatment is the driving factor this market.
                • such as pain and exhaustion is the driving factor this market.
                • enhancing their quality of life.Another chronic disease that affects the world population is COPD. There is a high prevalence of respiratory diseases is the driving factor this market.
                • such as asthma and chronic bronchitis. For instance is the driving factor this market.
                • according to the CDC is the driving factor this market.
                • over 16 million US adults have COPD in 2024. This has increased the adoption of telerehabilitation solutions. Telerehabilitation for COPD among older patients is practical is the driving factor this market.
                • as home-based telerehabilitation can disperse rehabilitation services in hospitals or clinics for patients needing physical therapy follow-up. Telerehabilitation for COPD patients involves supervised online exercise sessions that reduce the symptoms of the disease and improve both physical function and quality of life. Thus is the driving factor this market.
                • the rising aging population worldwide is the driving factor this market.
                • growing incidence of chronic diseases is the driving factor this market.
                • and increasing disposable income globally are a few significant factors that drive the adoption of advanced healthcare services such as telerehabilitation during the forecast period. is the driving factor this market.

                The Telerehabilitation Systems market vendors should focus on grabbing business opportunities from the Hardware segment as it accounted for the largest market share in the base year.
                RIA - Research AI Assistant
                Ask RIA