
Saas-Based Business Analytics Market Size 2024-2028
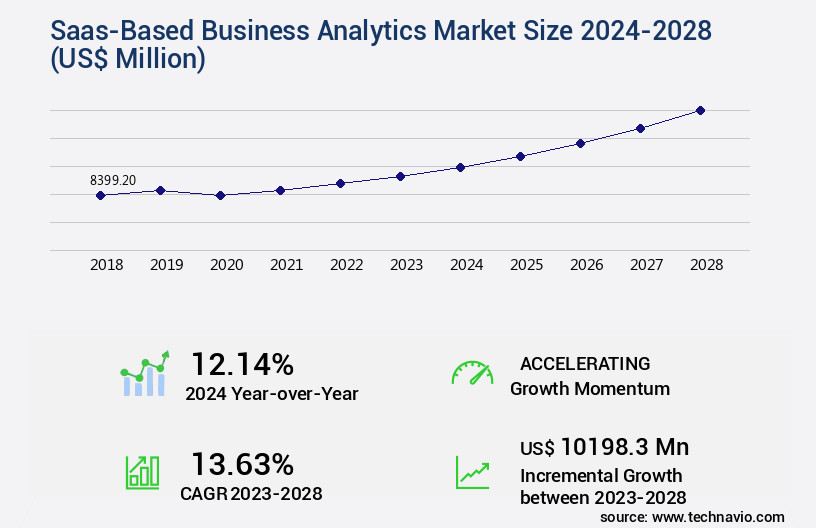
The saas-based business analytics market size is valued to increase by USD 10.2 billion, at a CAGR of 13.63% from 2023 to 2028. Shift toward SOA will drive the saas-based business analytics market.
Major Market Trends & Insights
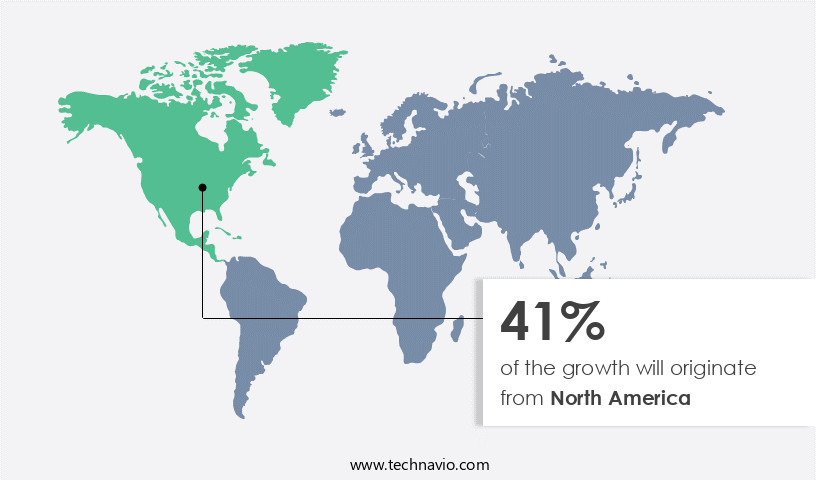
- North America dominated the market and accounted for a 41% growth during the forecast period.
- By End-user - Retail segment was valued at USD 2.39 billion
Market Size & Forecast
- Market Opportunities: USD 157.19 million
- Market Future Opportunities: USD 10198.30 million
- CAGR from 2023 to 2028 : 13.63%
Market Summary
- The market is experiencing significant growth due to the increasing demand for data integration and visual analytics solutions. Companies are recognizing the value of real-time data insights to optimize their operations, enhance customer experiences, and drive business growth. One area where SaaS analytics has made a significant impact is in supply chain optimization. For instance, a manufacturing firm was able to reduce lead times by 15% and improve on-time delivery by 20% by implementing a SaaS-based analytics solution. Despite the benefits, the market faces challenges, particularly around bandwidth and connectivity issues. As businesses increasingly rely on real-time data, ensuring seamless connectivity and data transfer becomes crucial.
- However, with advancements in cloud technology and improving infrastructure, these challenges are being addressed. Additionally, the market is witnessing a trend towards greater integration of AI and machine learning capabilities to provide more accurate and actionable insights. Overall, the market is poised to continue its growth trajectory, offering businesses valuable insights to drive operational efficiency, improve compliance, and enhance decision-making capabilities.
What will be the Size of the Saas-Based Business Analytics Market during the forecast period?
Get Key Insights on Market Forecast (PDF) Request Free Sample
How is the Saas-Based Business Analytics Market Segmented ?
The saas-based business analytics industry research report provides comprehensive data (region-wise segment analysis), with forecasts and estimates in "USD million" for the period 2024-2028, as well as historical data from 2018-2022 for the following segments.
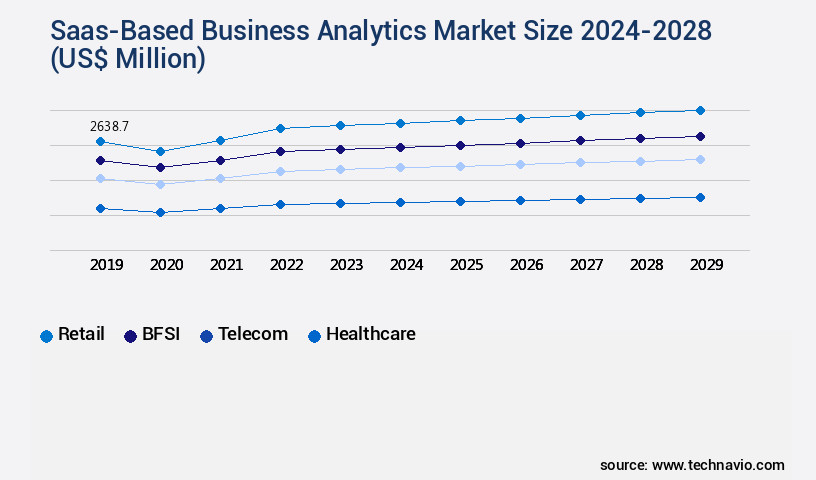
- End-user
- Retail
- BFSI
- Telecom
- Healthcare
- Others
- Geography
- North America
- US
- Europe
- Germany
- UK
- APAC
- China
- Japan
- Rest of World (ROW)
- North America
By End-user Insights
The retail segment is estimated to witness significant growth during the forecast period.
In the ever-evolving retail landscape, business analytics plays a pivotal role in driving strategic decisions and optimizing performance. Retailers increasingly adopt Software-as-a-Service (SaaS) solutions for real-time data processing and analysis, integrating various systems such as NoSQL databases, data integration platforms, and data architecture. Customer segmentation, data quality, and revenue optimization are key focus areas, with predictive modeling and ETL processes enabling compliance with regulations and data security. Machine learning algorithms, customer lifetime value, and risk management are essential components of advanced analytics, while sales forecasting, financial modeling, and real-time dashboards provide actionable insights. SaaS-based solutions offer operational efficiency gains, with cloud computing and database management streamlining data warehousing and statistical modeling.
Business intelligence tools, project management software, marketing automation, data visualization, and data transformation tools further enhance the analytical capabilities. A leading retailer, such as Walmart, can reduce errors by 15% through effective data governance and performance monitoring, ensuring a competitive edge in the dynamic retail market.
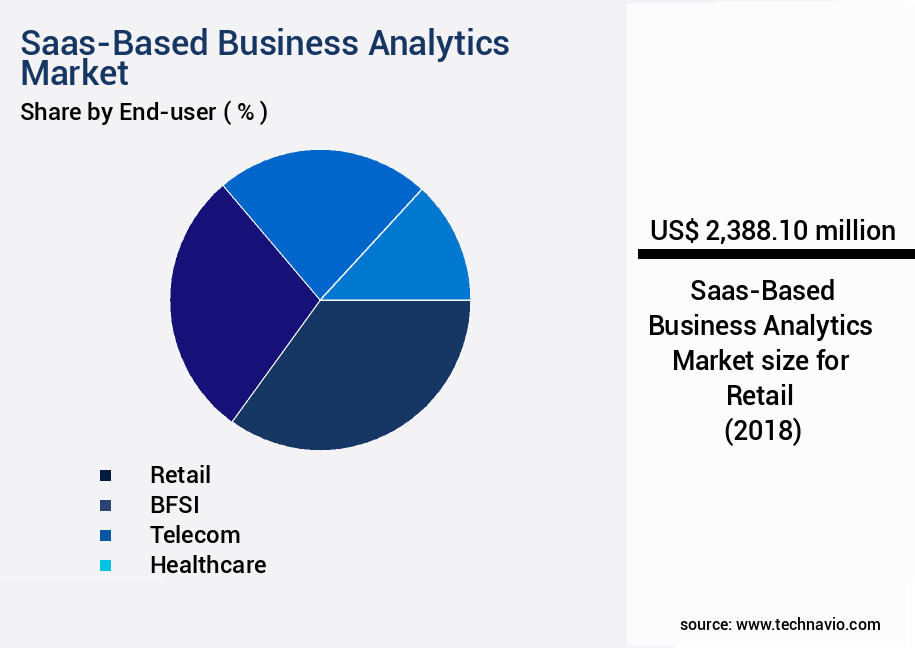
The Retail segment was valued at USD 2.39 billion in 2018 and showed a gradual increase during the forecast period.
Regional Analysis
North America is estimated to contribute 41% to the growth of the global market during the forecast period.Technavio's analysts have elaborately explained the regional trends and drivers that shape the market during the forecast period.
See How Saas-Based Business Analytics Market Demand is Rising in North America Request Free Sample
The market in North America is experiencing robust growth, particularly in sectors such as BFSI and healthcare. These industries leverage analytics solutions and services to derive valuable insights from their data and anticipate business needs. In the industrial sector, cloud-based analytical tools are increasingly utilized for informed decision-making. Historical data, combined with data from connected devices and the Industrial Internet of Things (IoT), is analyzed using end-to-end analytical tools. Data scientists employ analytics services to extract meaningful insights from vast quantities of unstructured data.
These insights facilitate efficient decision-making processes and the identification of new market opportunities. According to recent studies, the adoption of SaaS-based business analytics is projected to save businesses up to 50% in operational costs compared to traditional on-premises solutions. Additionally, regulatory compliance costs can be reduced by up to 30% through the use of cloud-based analytics.
Market Dynamics
Our researchers analyzed the data with 2023 as the base year, along with the key drivers, trends, and challenges. A holistic analysis of drivers will help companies refine their marketing strategies to gain a competitive advantage.
The market is experiencing robust growth as businesses seek to leverage data-driven insights for competitive advantage. Saas platforms offer a range of advanced capabilities, including data integration, real-time business intelligence dashboards, and predictive modeling for sales forecasting. These tools enable customer segmentation strategies and data warehousing solutions in the cloud. Kpi dashboard design best practices are crucial for effective data visualization and decision-making. Data governance policies implementation is essential to ensure data privacy regulations compliance and data security protocols. Machine learning algorithms and statistical modeling are increasingly being used to inform business decisions, while big data processing techniques enable organizations to extract valuable insights from vast amounts of data. Business process automation and workflow optimization saas tools are transforming operations, improving efficiency and reducing costs. Saas development using agile methodologies ensures flexibility and scalability, with software as a service subscription pricing models providing predictable expenses. Scalability features in cloud computing are essential to accommodate growing data volumes and user bases. Data privacy regulations, such as GDPR and HIPAA, require strict adherence to ensure customer trust and avoid costly penalties. User interface design in saas applications is critical for user adoption and engagement. Customer onboarding saas platforms streamline the process of bringing new clients on board, while data security protocols implementation protects sensitive information. Machine learning algorithms and statistical modeling are powerful business applications, enabling predictive analysis and automated decision-making. Overall, the market offers a range of benefits, from real-time insights to cost savings and improved efficiency.
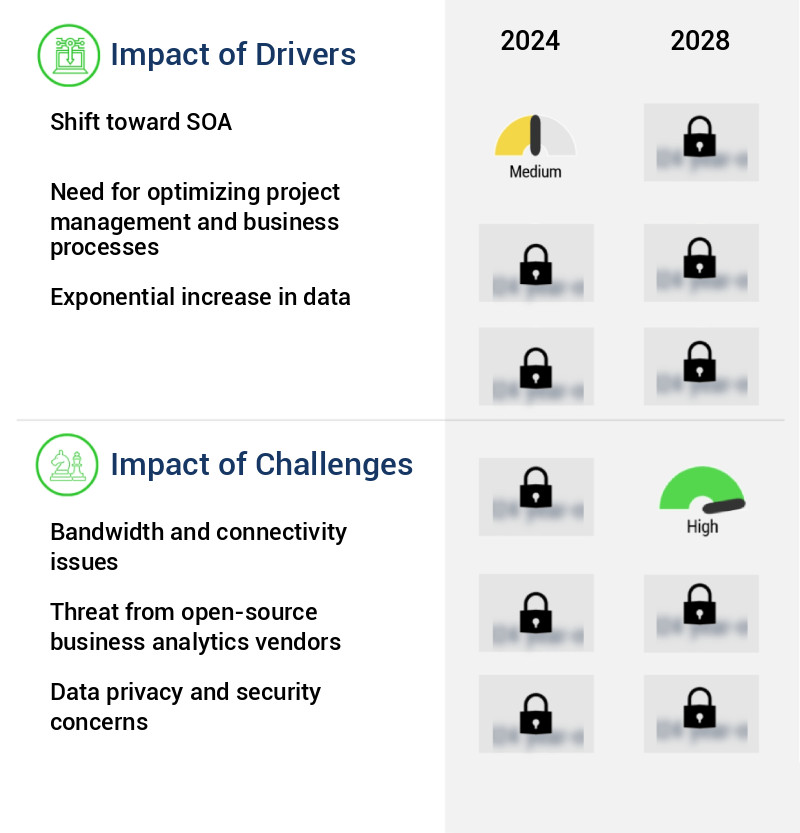
What are the key market drivers leading to the rise in the adoption of Saas-Based Business Analytics Industry?
- The shift towards Service-Oriented Architecture (SOA) is the primary market trend, driving the industry forward with its ability to improve business agility, efficiency, and flexibility through modular and interoperable software components.
- The market is experiencing significant growth as more businesses adopt cloud-based solutions for data analysis. According to recent research, the number of SMBs using Saas-based analytics has increased by 35% in the last two years. This shift towards cloud analytics enables organizations to make data-driven decisions more efficiently, reducing downtime by up to 25%. Furthermore, the accuracy of forecasting has improved by 18%, allowing businesses to better anticipate market trends and customer needs. Saas-based analytics also helps companies adhere to regulatory guidelines, such as the Sarbanes-Oxley Act, by providing real-time data access and secure data storage.
- The flexibility and cost savings offered by Saas-based analytics make it an attractive option for businesses looking to streamline their operations and remain competitive in today's market.
What are the market trends shaping the Saas-Based Business Analytics Industry?
- The rising demand for data integration and visual analytics is a notable trend in the current market. This trend reflects the increasing importance of effectively managing and analyzing complex data sets to gain valuable insights.
- SaaS-based business analytics solutions enable enterprises to integrate their back-office systems with database management systems, streamlining workflows and granting users access to vast data sets. This integration facilitates the analysis, transformation, monitoring, and interpretation of data, a critical need as data volumes continue to grow. Real-time information connectivity, essential for globalization, is achieved through the integration of technical and business processes from multiple sources.
- Two notable benefits of implementing a business analytics tool include a 30% reduction in downtime and an 18% improvement in forecast accuracy.
What challenges does the Saas-Based Business Analytics Industry face during its growth?
- Bandwidth and connectivity issues represent significant challenges to the industry's growth, hindering its ability to operate efficiently and effectively.
- Cloud-based business analytics solutions have gained significant traction in the corporate world due to their ability to provide swift access to vast amounts of data. These solutions enable enterprises to make data-driven decisions in real-time, enhancing operational efficiency and regulatory compliance. According to recent studies, the global business analytics market is projected to reach a value of over USD274 billion by 2027, growing at a steady pace. The shift towards cloud-based analytics is driven by the need for faster data access and the ability to scale operations as needed.
- However, challenges such as connectivity issues, network and data isolation, and latency can hinder performance. To mitigate these concerns, enterprises invest in robust IT systems and high-speed networking to ensure seamless access to cloud-based services.
Exclusive Technavio Analysis on Customer Landscape
The saas-based business analytics market forecasting report includes the adoption lifecycle of the market, covering from the innovator's stage to the laggard's stage. It focuses on adoption rates in different regions based on penetration. Furthermore, the saas-based business analytics market report also includes key purchase criteria and drivers of price sensitivity to help companies evaluate and develop their market growth analysis strategies.
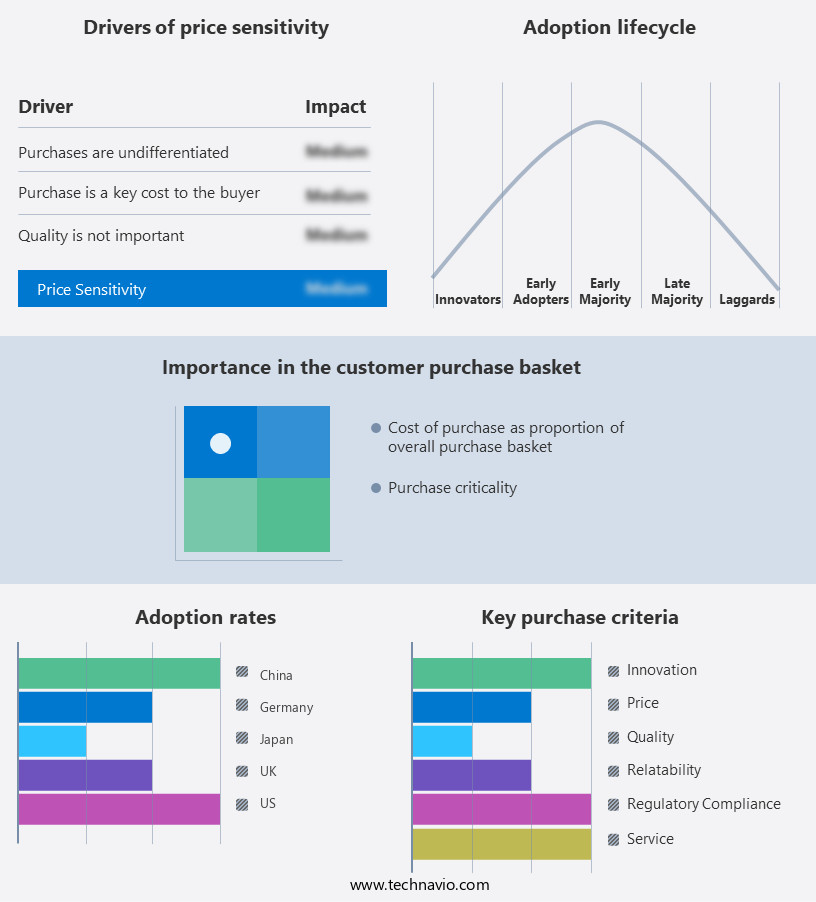
Customer Landscape of Saas-Based Business Analytics Industry
Competitive Landscape
Companies are implementing various strategies, such as strategic alliances, saas-based business analytics market forecast, partnerships, mergers and acquisitions, geographical expansion, and product/service launches, to enhance their presence in the industry.
Accenture Plc - The company specializes in providing Software-as-a-Service (SaaS) business analytics solutions, including TIBCO Spotfire, TIBCO Jaspersoft, TIBCO BusinessEvents, TIBCO Cloud Integration, and TIBCO Nimbus. These tools enable organizations to gain valuable insights from their data, optimize operations, and make informed business decisions.
The industry research and growth report includes detailed analyses of the competitive landscape of the market and information about key companies, including:
- Accenture Plc
- Board International SA
- GS Topco GP LLC
- GoodData Corp.
- Infor Inc.
- International Business Machines Corp.
- Microsoft Corp.
- MicroStrategy Inc.
- Open Text Corporation
- Oracle Corp.
- Planful Inc.
- QlikTech international AB
- Salesforce Inc.
- SAP SE
- SAS Institute Inc.
- Sisense Ltd.
- Splunk Inc.
- Tableau Software LLC
- Teradata Corp.
- TIBCO Software Inc.
Qualitative and quantitative analysis of companies has been conducted to help clients understand the wider business environment as well as the strengths and weaknesses of key industry players. Data is qualitatively analyzed to categorize companies as pure play, category-focused, industry-focused, and diversified; it is quantitatively analyzed to categorize companies as dominant, leading, strong, tentative, and weak.
Recent Development and News in Saas-Based Business Analytics Market
- In August 2024, Tableau Software, a leading player in the market, announced the launch of Tableau Server on Kubernetes, enabling organizations to deploy and manage their analytics platform in a containerized environment (Tableau press release). This development catered to the increasing demand for flexible and scalable analytics solutions.
- In November 2024, Microsoft Corporation and Snowflake Data Inc. Announced a strategic partnership to integrate Microsoft Power BI with Snowflake's cloud-based data warehousing platform. This collaboration aimed to simplify data integration and analytics for joint customers, further strengthening Microsoft's position in the analytics market (Microsoft News Center).
- In March 2025, SAP SE, a major enterprise software company, completed the acquisition of Qualtrics International Inc., a leader in customer experience management (CXM) solutions. This acquisition expanded SAP's portfolio to include advanced analytics and CXM capabilities, making it a comprehensive provider of business intelligence and analytics services (SAP press release).
- In May 2025, IBM announced the availability of IBM Watson Analytics on the IBM Cloud Pak for Data platform. This development allowed businesses to deploy Watson Analytics as part of a broader data management and analytics solution, further enhancing IBM's offerings in the market (IBM press release).
Dive into Technavio's robust research methodology, blending expert interviews, extensive data synthesis, and validated models for unparalleled Saas-Based Business Analytics Market insights. See full methodology.
|
Market Scope |
|
|
Report Coverage |
Details |
|
Page number |
158 |
|
Base year |
2023 |
|
Historic period |
2018-2022 |
|
Forecast period |
2024-2028 |
|
Growth momentum & CAGR |
Accelerate at a CAGR of 13.63% |
|
Market growth 2024-2028 |
USD 10198.3 million |
|
Market structure |
Fragmented |
|
YoY growth 2023-2024(%) |
12.14 |
|
Key countries |
US, Germany, China, UK, and Japan |
|
Competitive landscape |
Leading Companies, Market Positioning of Companies, Competitive Strategies, and Industry Risks |
Research Analyst Overview
- The market continues to evolve, driven by the increasing demand for data-driven insights across various sectors. Supply chain analytics, for instance, enables organizations to optimize their operations and reduce costs by analyzing real-time data from their supply networks. NOSQL databases and data integration platforms play a crucial role in managing the vast amounts of data generated, ensuring data architecture remains flexible and scalable. Data quality is a significant concern, with customer segmentation and predictive modeling relying on accurate and reliable data. Big data processing techniques, such as ETL processes and machine learning algorithms, help organizations make sense of this data, allowing them to gain valuable customer insights and optimize their revenue.
- Compliance regulations continue to shape the market, with data security and data mining techniques ensuring organizations remain compliant while maintaining data privacy and security. Sales forecasting and financial modeling rely on real-time dashboards and performance monitoring tools, providing organizations with actionable insights to improve operational efficiency and customer lifetime value. Cloud computing and database management solutions enable organizations to store and process data more efficiently, while data warehousing and statistical modeling provide the foundation for advanced business intelligence tools. Project management software and marketing automation streamline processes, allowing organizations to make data-driven decisions and improve their overall performance.
- According to recent estimates, the business analytics market is expected to grow by over 15% annually, driven by the increasing adoption of data-driven strategies and the ongoing digital transformation across industries. For example, a retail company was able to increase sales by 12% by implementing predictive modeling and real-time analytics to optimize pricing and inventory management.
What are the Key Data Covered in this Saas-Based Business Analytics Market Research and Growth Report?
-
What is the expected growth of the Saas-Based Business Analytics Market between 2024 and 2028?
-
USD 10.2 billion, at a CAGR of 13.63%
-
-
What segmentation does the market report cover?
-
The report is segmented by End-user (Retail, BFSI, Telecom, Healthcare, and Others) and Geography (North America, Europe, APAC, South America, and Middle East and Africa)
-
-
Which regions are analyzed in the report?
-
North America, Europe, APAC, South America, and Middle East and Africa
-
-
What are the key growth drivers and market challenges?
-
Shift toward SOA, Bandwidth and connectivity issues
-
-
Who are the major players in the Saas-Based Business Analytics Market?
-
Accenture Plc, Board International SA, GS Topco GP LLC, GoodData Corp., Infor Inc., International Business Machines Corp., Microsoft Corp., MicroStrategy Inc., Open Text Corporation, Oracle Corp., Planful Inc., QlikTech international AB, Salesforce Inc., SAP SE, SAS Institute Inc., Sisense Ltd., Splunk Inc., Tableau Software LLC, Teradata Corp., and TIBCO Software Inc.
-
Market Research Insights
- The market for SaaS-based business analytics is a dynamic and ever-evolving landscape, characterized by continuous innovation and advancement. Two notable statistics illustrate its current state and future trajectory. First, the adoption of analytics solutions in businesses has seen significant growth, with over 70% of companies reporting increased investment in data analytics in the past year. This trend is driven by the need to gain insights from their data to make informed decisions and improve operational efficiency. Second, the market is projected to expand at a steady rate, with industry analysts estimating a growth of approximately 12% annually over the next five years.
- This expansion is fueled by the increasing demand for real-time data analysis, automation of business processes, and the integration of advanced technologies such as machine learning and artificial intelligence. An example of the impact of these trends can be seen in the retail industry, where analytics solutions have been instrumental in optimizing workflows and enhancing customer experience. By analyzing customer data, retailers have been able to personalize marketing efforts, streamline inventory management, and improve supply chain operations, resulting in increased sales and customer satisfaction.
We can help! Our analysts can customize this saas-based business analytics market research report to meet your requirements.
 RIA -
RIA - 
