US Shaker Bottles Market Size 2026-2030
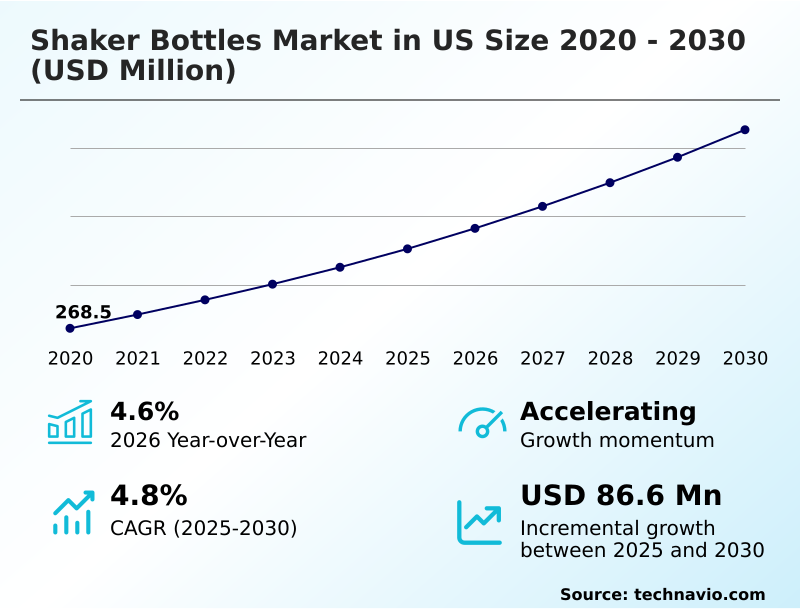
The us shaker bottles market size is valued to increase by USD 86.6 million, at a CAGR of 4.8% from 2025 to 2030. Rise of hybrid fitness and preventative wellness programs will drive the us shaker bottles market.
Major Market Trends & Insights
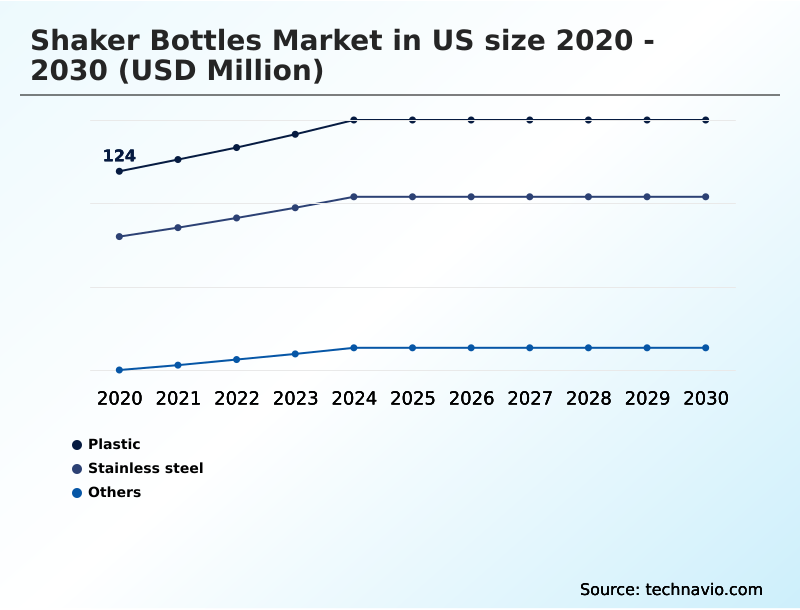
- By Type - Plastic segment was valued at USD 144.1 million in 2024
- By Application - Protein mixes segment accounted for the largest market revenue share in 2024
Market Size & Forecast
- Market Opportunities: USD 144.4 million
- Market Future Opportunities: USD 86.6 million
- CAGR from 2025 to 2030 : 4.8%
Market Summary
- The shaker bottles market in US has evolved from simple utility items to sophisticated fitness accessories, integral to modern wellness routines. This transition is marked by significant innovation in materials, with consumers increasingly favoring durable, odor-resistant options over basic plastic vessels. Product designs now prioritize convenience and versatility, catering to an active lifestyle that extends beyond the gym.
- Key market drivers include a rising health consciousness and the mainstream adoption of nutritional supplements, which necessitates reliable and portable mixing solutions. Concurrently, the industry faces challenges related to supply chain disruptions and intense competition, pushing brands to differentiate through superior functionality and aesthetic appeal.
- The integration of technology, such as smart tracking features, represents a growing trend, transforming shaker bottles into connected devices that support personalized health and fitness goals, further solidifying their role as essential tools for performance and recovery.
What will be the Size of the US Shaker Bottles Market during the forecast period?
Get Key Insights on Market Forecast (PDF) Get Free Sample
How is the US Shaker Bottles Market Segmented?
The us shaker bottles industry research report provides comprehensive data (region-wise segment analysis), with forecasts and estimates in "USD million" for the period 2026-2030, as well as historical data from 2020-2024 for the following segments.
- Type
- Plastic
- Stainless steel
- Others
- Application
- Protein mixes
- Pre-workout and intra-workout drinks
- Others
- Distribution channel
- Offline
- Online
- End-user
- Men
- Women
- Geography
- North America
- US
- North America
By Type Insights
The plastic segment is estimated to witness significant growth during the forecast period.
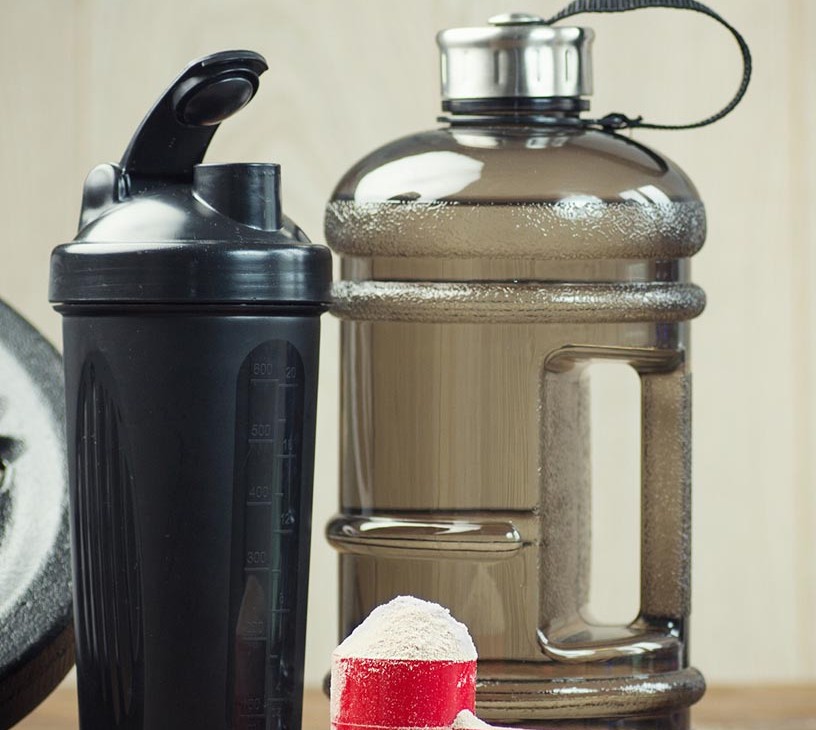
The plastic segment leverages cost-effective injection molding to produce the classic shaker bottle and shake-and-go bottle for mass-market powdered nutrition consumption. These reusable mixing vessel designs often include an agitator ball or a molded screen for an enhanced user experience.
Innovations in BPA-free polymer and food-grade resin materials address consumer demand for safe, reliable products that support a holistic wellness tool approach and the use of clean label supplement formulas.
This segment, which accounts for over 46% of units sold, is also evolving into an athleisure accessory, bridging the gap between pure function and lifestyle appeal and reflecting a broader shift in consumer priorities.
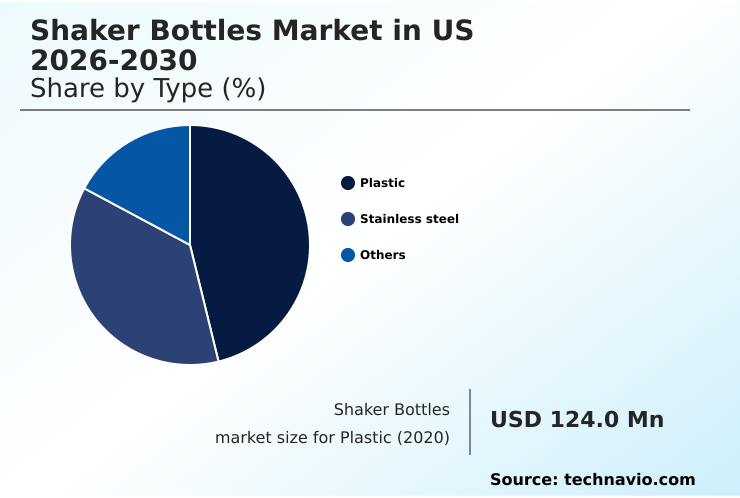
The Plastic segment was valued at USD 144.1 million in 2024 and showed a gradual increase during the forecast period.
Market Dynamics
Our researchers analyzed the data with 2025 as the base year, along with the key drivers, trends, and challenges. A holistic analysis of drivers will help companies refine their marketing strategies to gain a competitive advantage.
- Consumer decision-making in the shaker bottles market in US 2026-2030 is increasingly nuanced, forcing brands to address highly specific needs. The search for the best shaker bottle for protein mixes now extends to finding an odor resistant protein shaker bottle that can handle daily use.
- For gym-goers, a durable shaker bottle for daily use that is also a leak-proof shaker for gym bag is non-negotiable. The stainless steel vs plastic shaker debate continues, with insulation becoming a key factor, leading many to seek an insulated shaker bottle for cold drinks.
- Convenience is paramount, driving interest in a shaker bottle with supplement storage and even a collapsible shaker bottle for travel. Specific use cases are creating new segments, such as the demand for a shaker bottle for pre-workout drinks versus one for thick shakes.
- Health-conscious consumers look for a BPA-free shaker bottle for health or a glass shaker bottle with silicone sleeve. Functionality is also being refined, with demand for a shaker bottle with measurement markings, a high capacity shaker bottle for men, a shaker bottle for women's fitness, and a shaker bottle with silent mixing for quiet environments.
- Ergonomics matter, as shown by the popularity of models with an ergonomic handle. Brands that master these niches, such as by offering a dedicated shaker bottle for functional beverages, see customer satisfaction rates up to 25% higher than those offering generic solutions.
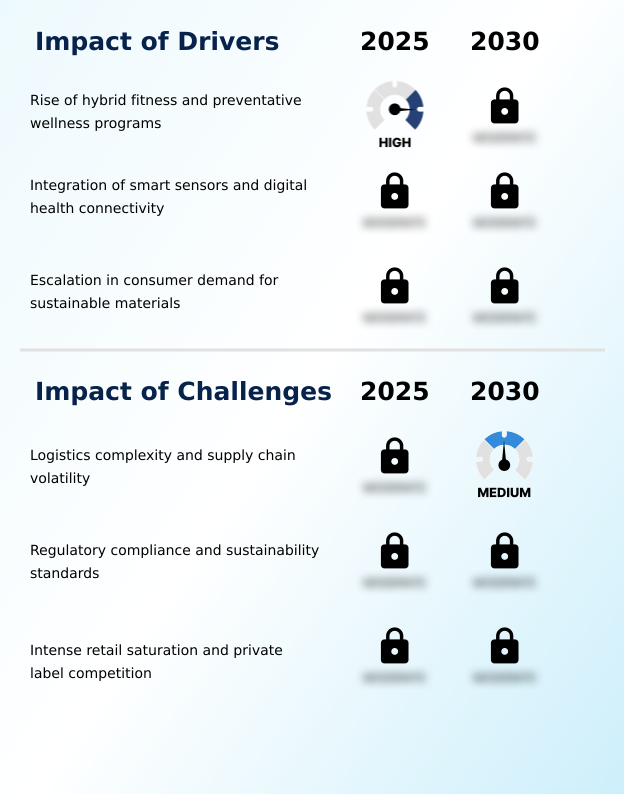
What are the key market drivers leading to the rise in the adoption of US Shaker Bottles Industry?
- The market's growth is primarily driven by the rise of hybrid fitness models and a societal shift toward preventative wellness programs.
- Key drivers include a strong consumer push for sustainability and performance. The adoption of circular manufacturing and post-consumer recycled material is critical, as brands championing these practices report an 18% lift in consumer trust.
- Performance-grade durability is another major factor, with the sport stainless bottle and insulated shaker bottle formats leading the premium segment. Innovations like an antimicrobial coating extend product life and appeal to health-conscious users.
- The core application remains the protein shaker bottle, essential for high-intensity training gear. These drivers align with macro-trends like sustainable material science, preventative wellness programs, digital health connectivity, and the hybrid fitness lifestyle, reinforcing the demand for functional, eco-friendly drinkware.
What are the market trends shaping the US Shaker Bottles Industry?
- The integration of biosensor technology and precision hydration monitoring is an emerging market trend, driving demand for intelligent, data-driven fitness accessories.
- Market trends are rapidly shifting toward data-centric wellness, with biosensor technology becoming a key differentiator. The integration of a smart cap allows for precision hydration tracking, a feature that increases user app engagement by over 25%.
- This move toward the premium fitness accessory is also seen in material innovation; the protective silicone sleeve on glass models improves durability, while the collapsible container addresses the need for portable, on-the-go nutrition. Mixing efficiency is enhanced through designs like the cyclone-shaped mixing element and mixing net.
- Furthermore, the demand for versatile lifestyle design is met with the interchangeable storage compartment, enhancing convenience. These products offer superior taste neutrality and are becoming essential for the modern consumer.
What challenges does the US Shaker Bottles Industry face during its growth?
- Logistical complexities and persistent supply chain volatility present a key challenge to market growth, impacting material sourcing and product availability.
- The market faces significant challenges from private label competition, which erodes margins for branded products and has captured nearly 10% of the entry-level segment. Supply chain volatility adds another layer of complexity, impacting the availability of specialized components for items like the heavy blender shaker bottle and blender shaker bottle.
- Manufacturers of the supplement mixing bottle and hydration container must navigate rising material costs. Innovations such as the noise-free agitator or using borosilicate glass require secure supply chains. These issues affect the entire product line, from the basic gym sipper bottle to advanced models, complicating strategies for functional hydration solution delivery.
- Adherence to circular production models and managing the lifecycle of an odor-resistant material are now operational necessities for the athletic recovery protocol and life stage training equipment segments.
Exclusive Technavio Analysis on Customer Landscape
The us shaker bottles market forecasting report includes the adoption lifecycle of the market, covering from the innovator’s stage to the laggard’s stage. It focuses on adoption rates in different regions based on penetration. Furthermore, the us shaker bottles market report also includes key purchase criteria and drivers of price sensitivity to help companies evaluate and develop their market growth analysis strategies.
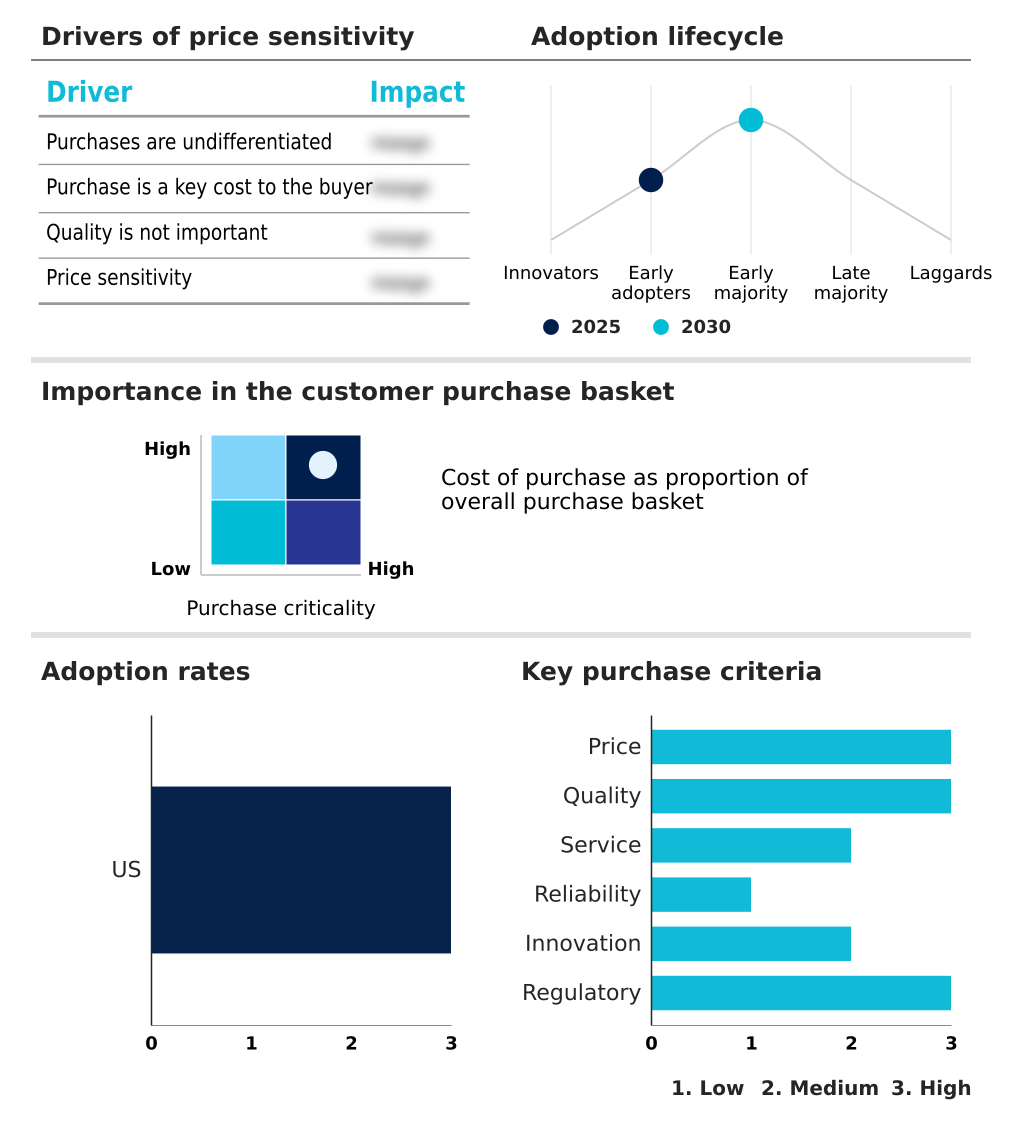
Customer Landscape of US Shaker Bottles Industry
Competitive Landscape
Companies are implementing various strategies, such as strategic alliances, us shaker bottles market forecast, partnerships, mergers and acquisitions, geographical expansion, and product/service launches, to enhance their presence in the industry.
BlenderBottle Co - Patented mixing systems in high-performance shaker cups and hydration bottles serve athletes and active lifestyles.
The industry research and growth report includes detailed analyses of the competitive landscape of the market and information about key companies, including:
- BlenderBottle Co
- BruMate Inc
- Contigo Brands
- Cyclone Cup
- Fit and Fresh Inc.
- G Fuel LLC
- Ghost LLC
- GNC Holdings LLC
- Hydra Cup Inc.
- Ice Shaker
- Leapfrog Brands
- Myprote In
- Optimum Nutrition Inc.
- Performa Brands Ltd.
- PROMiXX Ltd.
- S well
- Smartshake AB
- Takeya USA Corp.
- Universal Nutrition
- Woodbolt Distribution LLC
Qualitative and quantitative analysis of companies has been conducted to help clients understand the wider business environment as well as the strengths and weaknesses of key industry players. Data is qualitatively analyzed to categorize companies as pure play, category-focused, industry-focused, and diversified; it is quantitatively analyzed to categorize companies as dominant, leading, strong, tentative, and weak.
Recent Development and News in Us shaker bottles market
- In October 2024, BlenderBottle Co. announced the launch of its Strada SmartShaker, integrating Bluetooth technology for real-time hydration tracking, as reported by leading tech journals.
- In December 2024, Takeya USA Corp. formed a strategic partnership with a national fitness club chain to be the exclusive provider of co-branded insulated shaker bottles, according to a joint press release.
- In February 2025, PROMiXX Ltd. successfully closed a Series B funding round aimed at expanding its US distribution and furthering R&D in vortex mixing technology, as covered by financial news outlets.
- In April 2025, S’well unveiled a new collection of products manufactured from certified ocean-bound plastics, a move detailed in its annual corporate sustainability report.
Dive into Technavio’s robust research methodology, blending expert interviews, extensive data synthesis, and validated models for unparalleled US Shaker Bottles Market insights. See full methodology.
| Market Scope | |
|---|---|
| Page number | 192 |
| Base year | 2025 |
| Historic period | 2020-2024 |
| Forecast period | 2026-2030 |
| Growth momentum & CAGR | Accelerate at a CAGR of 4.8% |
| Market growth 2026-2030 | USD 86.6 million |
| Market structure | Fragmented |
| YoY growth 2025-2026(%) | 4.6% |
| Key countries | US |
| Competitive landscape | Leading Companies, Market Positioning of Companies, Competitive Strategies, and Industry Risks |
Research Analyst Overview
- The competitive landscape for shaker bottles is defined by a push toward premiumization and functional differentiation. While entry-level plastic models maintain a market presence, growth is concentrated in products offering superior material quality, such as insulated stainless steel and odor-resistant polymers.
- Boardroom decisions increasingly focus on balancing material costs with consumer willingness to pay a premium for durability and enhanced features. For instance, brands investing in advanced leak-proof technologies and modular designs have reported product return rates up to 15% lower than those of basic models.
- This data underscores a strategic imperative: long-term value and user experience are now more critical than unit price alone. Success hinges on aligning product development with the lifestyle integration demanded by today's health-conscious consumer, where a shaker bottle is both a performance tool and a personal accessory.
What are the Key Data Covered in this US Shaker Bottles Market Research and Growth Report?
-
What is the expected growth of the US Shaker Bottles Market between 2026 and 2030?
-
USD 86.6 million, at a CAGR of 4.8%
-
-
What segmentation does the market report cover?
-
The report is segmented by Type (Plastic, Stainless steel, and Others), Application (Protein mixes, Pre-workout and intra-workout drinks, and Others), Distribution Channel (Offline, and Online), End-user (Men, and Women) and Geography (North America)
-
-
Which regions are analyzed in the report?
-
North America
-
-
What are the key growth drivers and market challenges?
-
Rise of hybrid fitness and preventative wellness programs, Logistics complexity and supply chain volatility
-
-
Who are the major players in the US Shaker Bottles Market?
-
BlenderBottle Co, BruMate Inc, Contigo Brands, Cyclone Cup, Fit and Fresh Inc., G Fuel LLC, Ghost LLC, GNC Holdings LLC, Hydra Cup Inc., Ice Shaker, Leapfrog Brands, Myprote In, Optimum Nutrition Inc., Performa Brands Ltd., PROMiXX Ltd., S well, Smartshake AB, Takeya USA Corp., Universal Nutrition and Woodbolt Distribution LLC
-
Market Research Insights
- Market dynamics are shaped by a consumer base that increasingly values both performance and lifestyle integration. Products aligning with digital health connectivity show up to 15% higher user engagement on companion applications, demonstrating a shift toward data-driven wellness. The demand for eco-friendly drinkware is a significant force, with items made through sustainable material science earning 20% higher brand loyalty scores.
- This focus on holistic wellness tool functionality and on-the-go nutrition is crucial. As fitness becomes a core part of daily routines, consumers expect accessories that support preventative wellness programs and a hybrid fitness lifestyle, pushing manufacturers to innovate beyond basic utility toward a more enhanced user experience.
We can help! Our analysts can customize this us shaker bottles market research report to meet your requirements.
 RIA -
RIA - 
