Software Defined Everything (SDE) Market Analysis, Size, and Forecast 2024-2028: North America (Mexico), Europe (France, Germany, Italy, Spain, and UK), Middle East and Africa (UAE), APAC (Australia, China, India, Japan, and South Korea), South America (Brazil), and Rest of World (ROW)

Software Defined Everything (SDE) Market Analysis, Size, and Forecast 2024-2028:
North America (Mexico), Europe (France, Germany, Italy, Spain, and UK), Middle East and Africa (UAE), APAC (Australia, China, India, Japan, and South Korea), South America (Brazil), and Rest of World (ROW)

Published: Oct 2024 148 Pages SKU: IRTNTR74544

Market Overview at a Glance

$162.8 B
Market Opportunity
34.2%
CAGR
25.7
YoY growth 2023-2024(%)

Software Defined Everything (SDE) Market Size 2024-2028

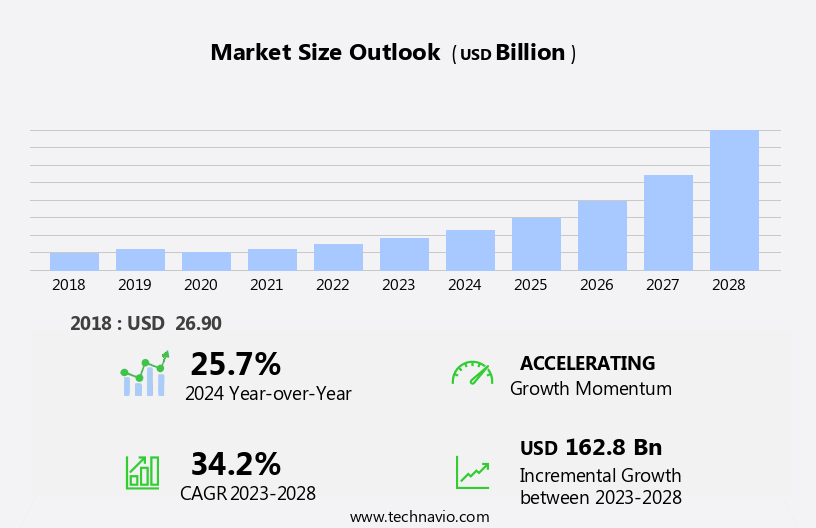
The software defined everything market size is forecast to increase by USD 162.8 billion at a CAGR of 34.2% between 2023 and 2028.

  • The market is experiencing significant growth due to the increasing adoption of cloud services among enterprises and the rising demand for cloud-based applications.The software businesses are increasingly turning to SDE solutions to enhance their infrastructure flexibility and agility, enabling them to respond more effectively to market demands and customer needs. However, the high cost associated with the installation of SaaS technology poses a significant challenge for market expansion.
  • Despite this obstacle, opportunities exist for companies to capitalize on the market's momentum by offering cost-effective solutions and collaborating with cloud service providers to offer integrated offerings.By focusing on these opportunities and addressing the installation cost challenge, market players can effectively navigate the competitive landscape and capture a larger share of the growing SDE market.

What will be the Size of the Software Defined Everything (SDE) Market during the forecast period?

Software Defined Everything (SDE) Market Size

 Request Free Sample

  • The market continues to evolve, with security hardening and infrastructure automation at its core. Automation platforms enable seamless integration of self-service portals, machine learning, and configuration management, driving business agility and operational efficiency. Network programmability and virtualization platforms underpin network virtualization and software-defined networking, enabling network slicing and service mesh for telecom operators. Enterprise IT and data center modernization are major applications, with cost optimization and policy-based management key considerations. Cloud-native applications, open standards, and open source solutions further fuel innovation.
  • The ongoing unfolding of market activities shapes the landscape, with digital transformation and cloud orchestration shaping the future. Financial services and various sectors adopt SDE for enhanced security and agility, as artificial intelligence and agile development continue to redefine business models.

How is this Software Defined Everything (SDE) Industry segmented?

The software defined everything (sde) industry research report provides comprehensive data (region-wise segment analysis), with forecasts and estimates in "USD billion" for the period 2024-2028, as well as historical data from 2018-2022 for the following segments.

  • End-user
    • IT and telecom
    • BFSI
    • Government and defense
    • Others
  • Application
    • IT Infrastructure
    • Cloud Computing
    • Network Security
  • Deployment Type
    • Cloud
    • On-Premises
  • Component
    • Software Defined Networking (SDN)
    • Software Defined Storage (SDS)
    • Software Defined Data Center (SDDC)
  • Geography
    • North America
      • US
      • Mexico
    • Europe
      • France
      • Germany
      • Italy
      • Spain
      • UK
    • Middle East and Africa
      • UAE
    • APAC
      • Australia
      • China
      • India
      • Japan
      • South Korea
    • South America
      • Brazil
    • Rest of World (ROW)

By End-user Insights

The it and telecom segment is estimated to witness significant growth during the forecast period.

The market is experiencing significant growth as communication service providers (CSPs) seek to scale their operations across physical, virtual, and cloud resources without the need for hardware modifications. In the telecom sector, this shift is primarily driven by the increasing volume of data being generated, collected, and managed. Traditional storage solutions offer limited visibility, hinder integration, and restrict tool choices to proprietary options. As a result, the global SDE market is experiencing increased demand from telecom and IT enterprises in search of enhanced storage solutions. Telecom service providers are undergoing digital transformation to deliver advanced services, such as 5G Internet of Things (IoT), and edge computing solutions, to businesses and consumers.

Infrastructure automation, software-defined security (SDS), and orchestration tools are essential components of this transformation. SDS enables policy-based management and cost optimization, while network programmability and network virtualization facilitate network slicing and improved operational efficiency. Cloud orchestration and cloud-native applications are also driving the adoption of SDE, as they allow for self-service portals and agile development. Open standards and open source solutions are increasingly popular, as they offer flexibility and reduce company lock-in. Machine learning (ML) and artificial intelligence (AI) are playing a crucial role in network optimization and improving business agility. The financial services industry is another significant contributor to the SDE market, as they seek to enhance security and improve operational efficiency.

Service mesh and configuration management are essential tools for managing complex microservices architectures. Edge computing and virtualization platforms are also gaining traction, as they enable faster data processing and reduce latency. In conclusion, the SDE market is witnessing substantial growth due to the increasing demand for advanced services and the need for more efficient, flexible, and cost-effective solutions. The integration of automation platforms, SDS, orchestration tools, and open standards is transforming the telecom and IT industries, enabling businesses to adapt to the evolving digital landscape.

Software Defined Everything (SDE) Market Size

Request Free Sample

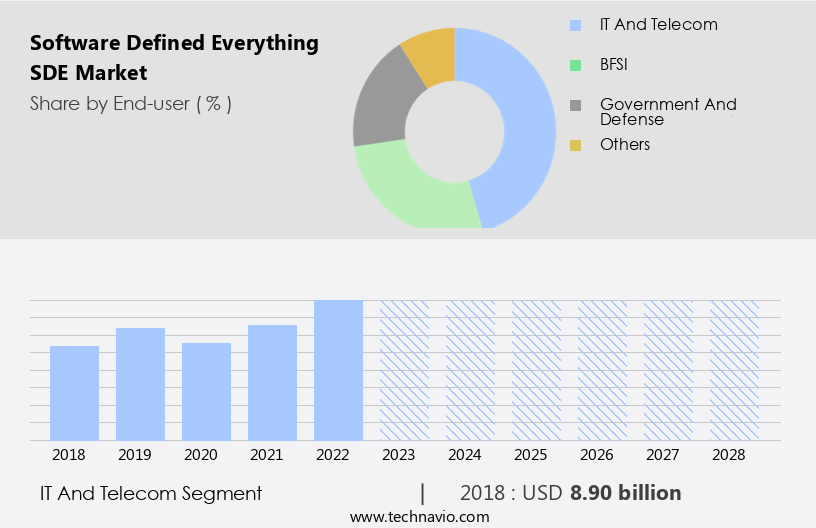
The IT and telecom segment was valued at USD 8.90 billion in 2018 and showed a gradual increase during the forecast period.

Regional Analysis

North America is estimated to contribute 53% to the growth of the global market during the forecast period.Technavio's analysts have elaborately explained the regional trends and drivers that shape the market during the forecast period.

Software Defined Everything (SDE) Market Share by Geography

 Request Free Sample

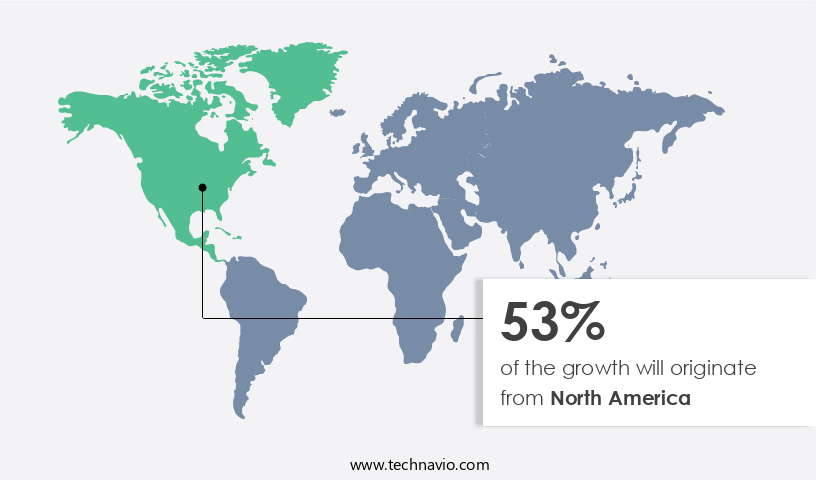
The market is experiencing significant growth, particularly in North America, which holds a prominent position in the global landscape. This region's dominance can be attributed to the increasing demand for cloud computing services, leading to the expansion of data centers and storage spaces. The Software-Defined Security (SDS) module is a key component of SDE, enabling users to scale resources on demand, making it an attractive solution for startups, SMEs, and enterprises alike. Its flexibility caters to temporary workloads and those subject to unexpected changes. The adoption of SDE is driven by the benefits of virtualization, automation of administrative tasks, and dynamic scaling.

Infrastructure automation and orchestration tools are essential components of SDE, ensuring operational efficiency and business agility. Open standards and open source solutions are integral to the SDE ecosystem, fostering innovation and collaboration. Machine learning and artificial intelligence are also playing a pivotal role in enhancing network programmability and network virtualization. Software-Defined Networking (SDN) and Software-Defined Storage (SDS) are critical technologies that enable policy-based management and cost optimization. Edge computing and service mesh further extend the reach of SDE, while digital transformation initiatives in telecom operators, financial services, and other industries are fueling the adoption of SDE for network slicing and cloud orchestration.

Market Dynamics

Our researchers analyzed the data with 2023 as the base year, along with the key drivers, trends, and challenges. A holistic analysis of drivers will help companies refine their marketing strategies to gain a competitive advantage.

The Global Software Defined Everything (SDE) Market is reshaping IT infrastructure through virtualization, automation, and intelligent control. Software-defined networking for IT companies enables agile, programmable networks that reduce complexity and cost. SD-WAN platforms for telecom operators offer scalable, high-performance connectivity for distributed networks. Software-defined storage for data centers improves flexibility and resource utilization across hybrid environments. The rise of AI-driven SDE for cloud infrastructure supports predictive automation and intelligent workload distribution. Security is reinforced with zero-trust security for SDE systems and blockchain integration for SDE security, ensuring robust data protection. Enterprises benefit from multi-cloud management for enterprises, optimizing performance and compliance across diverse cloud platforms. Edge SDE solutions for IoT bring real-time processing to connected devices, while real-time analytics for network management enhances visibility and operational efficiency. Additionally, containerized SDE for cybersecurity enables secure, scalable deployments critical to modern enterprise defense strategies

What are the key market drivers leading to the rise in the adoption of Software Defined Everything (SDE) Industry?

  • The significant rise in the adoption of cloud services by enterprises serves as the primary market driver. The market is experiencing significant growth due to the increasing adoption of cloud-based managed services. SDE offers organizations centralized administration and control over all resources, including edge computing and virtualization platforms, through company-managed infrastructure and SLAs. Cloud computing eliminates the need for businesses to update and maintain IT infrastructure, allowing them to focus on their core competencies. Open standards and open source solutions are driving innovation in SDE, enabling cost optimization and policy-based management. Digital transformation is a key factor propelling the adoption of SDE, as it offers immersive and harmonious experiences for end-users.
  • Configuration management and cost savings are additional benefits, making SDE an attractive option for organizations seeking to streamline their IT operations. Overall, the shift to cloud-based managed services is enabling businesses to reduce costs, improve efficiency, and enhance their digital capabilities.

What are the market trends shaping the Software Defined Everything (SDE) Industry?

  • The increasing demand for cloud-based applications represents a significant market trend in the technology industry. Cloud solutions offer numerous benefits, including scalability, cost savings, and increased efficiency, making them an attractive option for businesses and individuals alike.
  • The market is experiencing significant growth due to the increasing adoption of cloud computing by organizations worldwide. This shift is driven by the cost savings and flexibility offered by cloud services, enabling businesses to reduce capital expenditures (CAPEX) and focus on low-cost, agile development. Cloud orchestration, network slicing, artificial intelligence (AI), and service mesh are among the key technologies driving this trend. Cloud solutions offer quick implementation as they are accessible through web browsers, allowing for easy configuration and implementation within a short timeframe. Telecom operators and financial services are among the major industries embracing cloud-based technologies to enhance their operations and provide better customer experiences.
  • AI is also playing a crucial role in driving innovation and automation in various industries. Moreover, the use of cloud-based solutions enables organizations to scale their workload as needed, eliminating the need for expensive data centers and reducing operating expenditure (OPEX). Agile development methodologies are also gaining popularity, allowing for faster time-to-market and increased efficiency. Overall, the adoption of cloud-based technologies is transforming the way businesses operate and providing them with a competitive edge.

What challenges does the Software Defined Everything (SDE) Industry face during its growth?

  • The high cost of installing software-defined technology poses a significant challenge to the industry's growth trajectory. The market encompasses various technologies that enable enterprises to modernize their data centers, including infrastructure automation, security hardening, and orchestration tools. companies offer software-defined security (SDS) solutions, automation platforms, and storage solutions to help businesses streamline operations and reduce costs. However, the complexity of managing multiple software-defined storage solutions can pose a challenge for enterprises, leading to increased costs and potential inefficiencies. One of the primary drivers of the SDE market is the need for data center modernization. Technologies such as virtualization, containerization, and hyper-converged infrastructure enable enterprises to consolidate their data center components, reducing capital expenditures and operational expenses.
  • companies provide software-defined storage solutions, including hyper-converged infrastructure, primary storage, secondary storage, object storage, and cloud storage, to address the diverse requirements of enterprises. Despite the benefits, there are challenges associated with software-defined storage solutions. Some companies require upfront licensing fees based on storage capacity requirements, while others may not fully utilize the existing storage infrastructure, leading to significant losses for enterprises. Effective management of these solutions is crucial to maximizing their value and ensuring a harmonious IT environment. In conclusion, the SDE market offers numerous opportunities for enterprises to optimize their data centers, but careful consideration of the challenges and benefits is essential for successful implementation.
  • Recent research indicates that the trend towards software-defined everything is accelerating, making it an exciting and dynamic area for enterprise IT.

Exclusive Customer Landscape

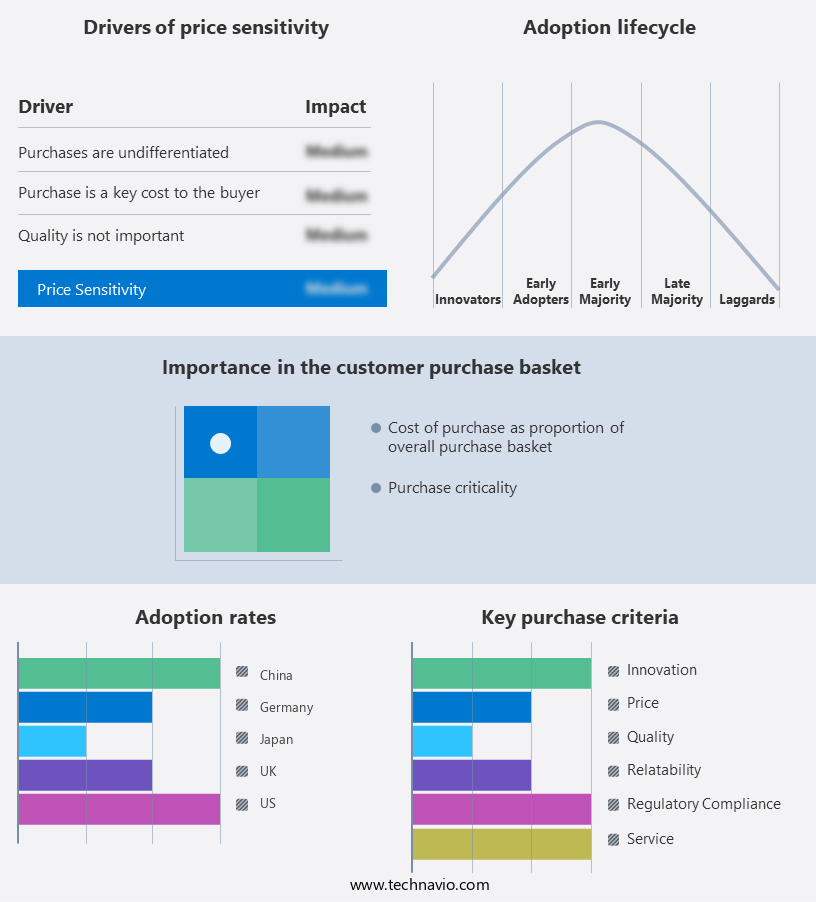
The software defined everything (sde) market forecasting report includes the adoption lifecycle of the market, covering from the innovator's stage to the laggard's stage. It focuses on adoption rates in different regions based on penetration. Furthermore, the software defined everything (sde) market report also includes key purchase criteria and drivers of price sensitivity to help companies evaluate and develop their market growth analysis strategies.

Software Defined Everything (SDE) Market Share by Geography

 Customer Landscape

Key Companies & Market Insights

Companies are implementing various strategies, such as strategic alliances, software defined everything (sde) market forecast, partnerships, mergers and acquisitions, geographical expansion, and product/service launches, to enhance their presence in the industry.

Arista Networks - The company specializes in Software-Defined Everything (SDE) solutions, specifically SD-WAN technology, which optimizes network and security services for branch offices. Our brand, Versa Networks, delivers advanced functionalities, enhancing business agility and performance. By leveraging SDE architecture, organizations can simplify branch office operations, improve application performance, and bolster security. This technology enables dynamic, automated network and application policies, ensuring business continuity and reducing IT complexity. Versa Networks' SD-WAN solution seamlessly integrates various connectivity options, including broadband and MPLS, ensuring optimal network performance and reliability.

The industry research and growth report includes detailed analyses of the competitive landscape of the market and information about key companies, including:

  • Arista Networks
  • AT&T
  • Cisco Systems
  • Citrix Systems
  • Dell Technologies
  • Ericsson
  • Hewlett Packard Enterprise
  • Huawei Technologies
  • IBM Corporation
  • Intel Corporation
  • Juniper Networks
  • Microsoft Corporation
  • Nokia Corporation
  • Nutanix
  • Oracle Corporation
  • Red Hat
  • VMware
  • Wind River Systems
  • Extreme Networks
  • Fortinet

Qualitative and quantitative analysis of companies has been conducted to help clients understand the wider business environment as well as the strengths and weaknesses of key industry players. Data is qualitatively analyzed to categorize companies as pure play, category-focused, industry-focused, and diversified; it is quantitatively analyzed to categorize companies as dominant, leading, strong, tentative, and weak.

Recent Development and News in Software Defined Everything (SDE) Market

  • In February 2024, IBM announced the launch of its new Software-Defined Manageability (SDM) solution, aimed at simplifying the management of complex IT environments using artificial intelligence and automation. This offering is expected to significantly enhance the market by streamlining the process of managing software-defined networks, storage, and applications (IBM Press Release, 2024).
  • In May 2025, Microsoft and Amazon Web Services (AWS) joined forces to expand their strategic collaboration, enabling seamless integration between Microsoft Azure and AWS Outposts. This partnership is anticipated to accelerate the adoption of Software-Defined Infrastructure (SDI) and Software-Defined Networking (SDN) solutions, as businesses increasingly adopt multi-cloud strategies (Microsoft News Center, 2025).
  • In August 2024, VMware, a leading player in the SDE market, secured a strategic investment of USD1.1 billion from Silver Lake Partners. The funds will be used to accelerate the company's innovation and growth in the areas of multi-cloud, edge computing, and artificial intelligence (VMware Investor Relations, 2024).

Research Analyst Overview

The market is experiencing significant growth and innovation, integrating various technologies to enhance business continuity and network security in a multi-cloud environment. Solutions for load balancing, network function virtualization, capacity planning, network analytics, edge orchestration, and container orchestration are essential for managing complex infrastructures. Service chaining, cloud bursting, and service assurance ensure seamless application delivery and scalability. Automation scripting, programmable infrastructure, hybrid cloud, predictive maintenance, data analytics, intent-based networking, performance monitoring, microservices architecture, disaster recovery, compliance frameworks, zero-trust security, serverless computing, dynamic routing, firewall management, and API management are key components driving market trends.

Network optimization is a critical focus area, enabling businesses to improve efficiency and reduce costs. These technologies enable businesses to adapt to changing demands, ensuring network security, enhancing application performance, and optimizing resource utilization. By leveraging the power of SDE, organizations can achieve greater agility, flexibility, and efficiency in their IT operations.

Dive into Technavio's robust research methodology, blending expert interviews, extensive data synthesis, and validated models for unparalleled Software Defined Everything (SDE) Market insights. See full methodology.

Market Scope

Report Coverage

Details

Page number

148

Base year

2023

Historic period

2018-2022

Forecast period

2024-2028

Growth momentum & CAGR

Accelerate at a CAGR of 34.2%

Market growth 2024-2028

USD 162.8 billion

Market structure

Fragmented

YoY growth 2023-2024(%)

25.7

Key countries

US, China, Germany, Japan, UK, Australia, India, France, Brazil, UAE, Rest of World (ROW), Saudi Arabia, France, South Korea, Mexico, Italy, and Spain

Competitive landscape

Leading Companies, Market Positioning of Companies, Competitive Strategies, and Industry Risks

Request Free Sample

What are the Key Data Covered in this Software Defined Everything (SDE) Market Research and Growth Report?

  • CAGR of the Software Defined Everything (SDE) industry during the forecast period
  • Detailed information on factors that will drive the growth and forecasting between 2024 and 2028
  • Precise estimation of the size of the market and its contribution of the industry in focus to the parent market
  • Accurate predictions about upcoming growth and trends and changes in consumer behaviour
  • Growth of the market across North America, APAC, Europe, South America, and Middle East and Africa
  • Thorough analysis of the market's competitive landscape and detailed information about companies
  • Comprehensive analysis of factors that will challenge the software defined everything (sde) market growth of industry companies

We can help! Our analysts can customize this software defined everything (sde) market research report to meet your requirements.

Get in touch

1 Executive Summary

  • 1.1 Market overview
    • Executive Summary - Chart on Market Overview
    • Executive Summary - Data Table on Market Overview
    • Executive Summary - Chart on Global Market Characteristics
    • Executive Summary - Chart on Market by Geography
    • Executive Summary - Chart on Market Segmentation by End-user
    • Executive Summary - Chart on Incremental Growth
    • Executive Summary - Data Table on Incremental Growth
    • Executive Summary - Chart on Company Market Positioning

2 Market Landscape

  • 2.1 Market ecosystem
    • Parent Market
    • Data Table on - Parent Market
  • 2.2 Market characteristics
    • Market characteristics analysis
  • 2.3 Value chain analysis
    • Value Chain Analysis

3 Market Sizing

  • 3.1 Market definition
    • Offerings of companies included in the market definition
  • 3.2 Market segment analysis
    • Market segments
  • 3.3 Market size 2023
    • 3.4 Market outlook: Forecast for 2023-2028
      • Chart on Global - Market size and forecast 2023-2028 ($ billion)
      • Data Table on Global - Market size and forecast 2023-2028 ($ billion)
      • Chart on Global Market: Year-over-year growth 2023-2028 (%)
      • Data Table on Global Market: Year-over-year growth 2023-2028 (%)

    4 Historic Market Size

    • 4.1 Global Software Defined Everything (SDE) Market 2018 - 2022
      • Historic Market Size - Data Table on Global Software Defined Everything (SDE) Market 2018 - 2022 ($ billion)
    • 4.2 End-user segment analysis 2018 - 2022
      • Historic Market Size - End-user Segment 2018 - 2022 ($ billion)
    • 4.3 Geography segment analysis 2018 - 2022
      • Historic Market Size - Geography Segment 2018 - 2022 ($ billion)
    • 4.4 Country segment analysis 2018 - 2022
      • Historic Market Size - Country Segment 2018 - 2022 ($ billion)

    5 Five Forces Analysis

    • 5.1 Five forces summary
      • Five forces analysis - Comparison between 2023 and 2028
    • 5.2 Bargaining power of buyers
      • Bargaining power of buyers - Impact of key factors 2023 and 2028
    • 5.3 Bargaining power of suppliers
      • Bargaining power of suppliers - Impact of key factors in 2023 and 2028
    • 5.4 Threat of new entrants
      • Threat of new entrants - Impact of key factors in 2023 and 2028
    • 5.5 Threat of substitutes
      • Threat of substitutes - Impact of key factors in 2023 and 2028
    • 5.6 Threat of rivalry
      • Threat of rivalry - Impact of key factors in 2023 and 2028
    • 5.7 Market condition
      • Chart on Market condition - Five forces 2023 and 2028

    6 Market Segmentation by End-user

    • 6.1 Market segments
      • Chart on End-user - Market share (2023-2028) (%)
      • Data Table on End-user - Market share (2023-2028) (%)
    • 6.2 Comparison by End-user
      • Chart on Comparison by End-user
      • Data Table on Comparison by End-user
    • 6.3 IT and telecom - Market size and forecast (2023-2028)
      • Chart on IT and telecom - Market size and forecast (2023-2028) ($ billion)
      • Data Table on IT and telecom - Market size and forecast (2023-2028) ($ billion)
      • Chart on IT and telecom - Year-over-year growth (2023-2028) (%)
      • Data Table on IT and telecom - Year-over-year growth (2023-2028) (%)
    • 6.4 BFSI - Market size and forecast (2023-2028)
      • Chart on BFSI - Market size and forecast (2023-2028) ($ billion)
      • Data Table on BFSI - Market size and forecast (2023-2028) ($ billion)
      • Chart on BFSI - Year-over-year growth (2023-2028) (%)
      • Data Table on BFSI - Year-over-year growth (2023-2028) (%)
    • 6.5 Government and defense - Market size and forecast (2023-2028)
      • Chart on Government and defense - Market size and forecast (2023-2028) ($ billion)
      • Data Table on Government and defense - Market size and forecast (2023-2028) ($ billion)
      • Chart on Government and defense - Year-over-year growth (2023-2028) (%)
      • Data Table on Government and defense - Year-over-year growth (2023-2028) (%)
    • 6.6 Others - Market size and forecast (2023-2028)
      • Chart on Others - Market size and forecast (2023-2028) ($ billion)
      • Data Table on Others - Market size and forecast (2023-2028) ($ billion)
      • Chart on Others - Year-over-year growth (2023-2028) (%)
      • Data Table on Others - Year-over-year growth (2023-2028) (%)
    • 6.7 Market opportunity by End-user
      • Market opportunity by End-user ($ billion)
      • Data Table on Market opportunity by End-user ($ billion)

    7 Market Segmentation by Application

    • 7.1 Market segments
      • Chart on Application - Market share (2023-2028) (%)
      • Data Table on Application - Market share (2023-2028) (%)
    • 7.2 Comparison by Application
      • Chart on Comparison by Application
      • Data Table on Comparison by Application
    • 7.3 IT Infrastructure - Market size and forecast (2023-2028)
      • Chart on IT Infrastructure - Market size and forecast (2023-2028) ($ billion)
      • Data Table on IT Infrastructure - Market size and forecast (2023-2028) ($ billion)
      • Chart on IT Infrastructure - Year-over-year growth (2023-2028) (%)
      • Data Table on IT Infrastructure - Year-over-year growth (2023-2028) (%)
    • 7.4 Cloud Computing - Market size and forecast (2023-2028)
      • Chart on Cloud Computing - Market size and forecast (2023-2028) ($ billion)
      • Data Table on Cloud Computing - Market size and forecast (2023-2028) ($ billion)
      • Chart on Cloud Computing - Year-over-year growth (2023-2028) (%)
      • Data Table on Cloud Computing - Year-over-year growth (2023-2028) (%)
    • 7.5 Network Security - Market size and forecast (2023-2028)
      • Chart on Network Security - Market size and forecast (2023-2028) ($ billion)
      • Data Table on Network Security - Market size and forecast (2023-2028) ($ billion)
      • Chart on Network Security - Year-over-year growth (2023-2028) (%)
      • Data Table on Network Security - Year-over-year growth (2023-2028) (%)
    • 7.6 Market opportunity by Application
      • Market opportunity by Application ($ billion)
      • Data Table on Market opportunity by Application ($ billion)

    8 Market Segmentation by Deployment Type

    • 8.1 Market segments
      • Chart on Deployment Type - Market share (2023-2028) (%)
      • Data Table on Deployment Type - Market share (2023-2028) (%)
    • 8.2 Comparison by Deployment Type
      • Chart on Comparison by Deployment Type
      • Data Table on Comparison by Deployment Type
    • 8.3 Cloud - Market size and forecast (2023-2028)
      • Chart on Cloud - Market size and forecast (2023-2028) ($ billion)
      • Data Table on Cloud - Market size and forecast (2023-2028) ($ billion)
      • Chart on Cloud - Year-over-year growth (2023-2028) (%)
      • Data Table on Cloud - Year-over-year growth (2023-2028) (%)
    • 8.4 On-Premises - Market size and forecast (2023-2028)
      • Chart on On-Premises - Market size and forecast (2023-2028) ($ billion)
      • Data Table on On-Premises - Market size and forecast (2023-2028) ($ billion)
      • Chart on On-Premises - Year-over-year growth (2023-2028) (%)
      • Data Table on On-Premises - Year-over-year growth (2023-2028) (%)
    • 8.5 Market opportunity by Deployment Type
      • Market opportunity by Deployment Type ($ billion)
      • Data Table on Market opportunity by Deployment Type ($ billion)

    9 Market Segmentation by Component

    • 9.1 Market segments
      • Chart on Component - Market share (2023-2028) (%)
      • Data Table on Component - Market share (2023-2028) (%)
    • 9.2 Comparison by Component
      • Chart on Comparison by Component
      • Data Table on Comparison by Component
    • 9.3 Software Defined Networking (SDN) - Market size and forecast (2023-2028)
      • Chart on Software Defined Networking (SDN) - Market size and forecast (2023-2028) ($ billion)
      • Data Table on Software Defined Networking (SDN) - Market size and forecast (2023-2028) ($ billion)
      • Chart on Software Defined Networking (SDN) - Year-over-year growth (2023-2028) (%)
      • Data Table on Software Defined Networking (SDN) - Year-over-year growth (2023-2028) (%)
    • 9.4 Software Defined Storage (SDS) - Market size and forecast (2023-2028)
      • Chart on Software Defined Storage (SDS) - Market size and forecast (2023-2028) ($ billion)
      • Data Table on Software Defined Storage (SDS) - Market size and forecast (2023-2028) ($ billion)
      • Chart on Software Defined Storage (SDS) - Year-over-year growth (2023-2028) (%)
      • Data Table on Software Defined Storage (SDS) - Year-over-year growth (2023-2028) (%)
    • 9.5 Software Defined Data Center (SDDC) - Market size and forecast (2023-2028)
      • Chart on Software Defined Data Center (SDDC) - Market size and forecast (2023-2028) ($ billion)
      • Data Table on Software Defined Data Center (SDDC) - Market size and forecast (2023-2028) ($ billion)
      • Chart on Software Defined Data Center (SDDC) - Year-over-year growth (2023-2028) (%)
      • Data Table on Software Defined Data Center (SDDC) - Year-over-year growth (2023-2028) (%)
    • 9.6 Market opportunity by Component
      • Market opportunity by Component ($ billion)
      • Data Table on Market opportunity by Component ($ billion)

    10 Customer Landscape

    • 10.1 Customer landscape overview
      • Analysis of price sensitivity, lifecycle, customer purchase basket, adoption rates, and purchase criteria

    11 Geographic Landscape

    • 11.1 Geographic segmentation
      • Chart on Market share by geography 2023-2028 (%)
      • Data Table on Market share by geography 2023-2028 (%)
    • 11.2 Geographic comparison
      • Chart on Geographic comparison
      • Data Table on Geographic comparison
    • 11.3 North America - Market size and forecast 2023-2028
      • Chart on North America - Market size and forecast 2023-2028 ($ billion)
      • Data Table on North America - Market size and forecast 2023-2028 ($ billion)
      • Chart on North America - Year-over-year growth 2023-2028 (%)
      • Data Table on North America - Year-over-year growth 2023-2028 (%)
    • 11.4 APAC - Market size and forecast 2023-2028
      • Chart on APAC - Market size and forecast 2023-2028 ($ billion)
      • Data Table on APAC - Market size and forecast 2023-2028 ($ billion)
      • Chart on APAC - Year-over-year growth 2023-2028 (%)
      • Data Table on APAC - Year-over-year growth 2023-2028 (%)
    • 11.5 Europe - Market size and forecast 2023-2028
      • Chart on Europe - Market size and forecast 2023-2028 ($ billion)
      • Data Table on Europe - Market size and forecast 2023-2028 ($ billion)
      • Chart on Europe - Year-over-year growth 2023-2028 (%)
      • Data Table on Europe - Year-over-year growth 2023-2028 (%)
    • 11.6 South America - Market size and forecast 2023-2028
      • Chart on South America - Market size and forecast 2023-2028 ($ billion)
      • Data Table on South America - Market size and forecast 2023-2028 ($ billion)
      • Chart on South America - Year-over-year growth 2023-2028 (%)
      • Data Table on South America - Year-over-year growth 2023-2028 (%)
    • 11.7 Middle East and Africa - Market size and forecast 2023-2028
      • Chart on Middle East and Africa - Market size and forecast 2023-2028 ($ billion)
      • Data Table on Middle East and Africa - Market size and forecast 2023-2028 ($ billion)
      • Chart on Middle East and Africa - Year-over-year growth 2023-2028 (%)
      • Data Table on Middle East and Africa - Year-over-year growth 2023-2028 (%)
    • 11.8 US - Market size and forecast 2023-2028
      • Chart on US - Market size and forecast 2023-2028 ($ billion)
      • Data Table on US - Market size and forecast 2023-2028 ($ billion)
      • Chart on US - Year-over-year growth 2023-2028 (%)
      • Data Table on US - Year-over-year growth 2023-2028 (%)
    • 11.9 China - Market size and forecast 2023-2028
      • Chart on China - Market size and forecast 2023-2028 ($ billion)
      • Data Table on China - Market size and forecast 2023-2028 ($ billion)
      • Chart on China - Year-over-year growth 2023-2028 (%)
      • Data Table on China - Year-over-year growth 2023-2028 (%)
    • 11.10 Japan - Market size and forecast 2023-2028
      • Chart on Japan - Market size and forecast 2023-2028 ($ billion)
      • Data Table on Japan - Market size and forecast 2023-2028 ($ billion)
      • Chart on Japan - Year-over-year growth 2023-2028 (%)
      • Data Table on Japan - Year-over-year growth 2023-2028 (%)
    • 11.11 UK - Market size and forecast 2023-2028
      • Chart on UK - Market size and forecast 2023-2028 ($ billion)
      • Data Table on UK - Market size and forecast 2023-2028 ($ billion)
      • Chart on UK - Year-over-year growth 2023-2028 (%)
      • Data Table on UK - Year-over-year growth 2023-2028 (%)
    • 11.12 Germany - Market size and forecast 2023-2028
      • Chart on Germany - Market size and forecast 2023-2028 ($ billion)
      • Data Table on Germany - Market size and forecast 2023-2028 ($ billion)
      • Chart on Germany - Year-over-year growth 2023-2028 (%)
      • Data Table on Germany - Year-over-year growth 2023-2028 (%)
    • 11.13 Market opportunity by geography
      • Market opportunity by geography ($ billion)
      • Data Tables on Market opportunity by geography ($ billion)
    • 11.14 US - Market size and forecast (2023-2028)
      • Chart on US - Market size and forecast (2023-2028) ($ billion)
      • Data Table on US - Market size and forecast (2023-2028) ($ billion)
      • Chart on US - Year-over-year growth (2023-2028) (%)
      • Data Table on US - Year-over-year growth (2023-2028) (%)
    • 11.15 Australia - Market size and forecast (2023-2028)
      • Chart on Australia - Market size and forecast (2023-2028) ($ billion)
      • Data Table on Australia - Market size and forecast (2023-2028) ($ billion)
      • Chart on Australia - Year-over-year growth (2023-2028) (%)
      • Data Table on Australia - Year-over-year growth (2023-2028) (%)
    • 11.16 India - Market size and forecast (2023-2028)
      • Chart on India - Market size and forecast (2023-2028) ($ billion)
      • Data Table on India - Market size and forecast (2023-2028) ($ billion)
      • Chart on India - Year-over-year growth (2023-2028) (%)
      • Data Table on India - Year-over-year growth (2023-2028) (%)
    • 11.17 France - Market size and forecast (2023-2028)
      • Chart on France - Market size and forecast (2023-2028) ($ billion)
      • Data Table on France - Market size and forecast (2023-2028) ($ billion)
      • Chart on France - Year-over-year growth (2023-2028) (%)
      • Data Table on France - Year-over-year growth (2023-2028) (%)
    • 11.18 Brazil - Market size and forecast (2023-2028)
      • Chart on Brazil - Market size and forecast (2023-2028) ($ billion)
      • Data Table on Brazil - Market size and forecast (2023-2028) ($ billion)
      • Chart on Brazil - Year-over-year growth (2023-2028) (%)
      • Data Table on Brazil - Year-over-year growth (2023-2028) (%)
    • 11.19 UAE - Market size and forecast (2023-2028)
      • Chart on UAE - Market size and forecast (2023-2028) ($ billion)
      • Data Table on UAE - Market size and forecast (2023-2028) ($ billion)
      • Chart on UAE - Year-over-year growth (2023-2028) (%)
      • Data Table on UAE - Year-over-year growth (2023-2028) (%)
    • 11.20 Rest of World (ROW) - Market size and forecast (2023-2028)
      • Chart on Rest of World (ROW) - Market size and forecast (2023-2028) ($ billion)
      • Data Table on Rest of World (ROW) - Market size and forecast (2023-2028) ($ billion)
      • Chart on Rest of World (ROW) - Year-over-year growth (2023-2028) (%)
      • Data Table on Rest of World (ROW) - Year-over-year growth (2023-2028) (%)
    • 11.21 Saudi Arabia - Market size and forecast (2023-2028)
      • Chart on Saudi Arabia - Market size and forecast (2023-2028) ($ billion)
      • Data Table on Saudi Arabia - Market size and forecast (2023-2028) ($ billion)
      • Chart on Saudi Arabia - Year-over-year growth (2023-2028) (%)
      • Data Table on Saudi Arabia - Year-over-year growth (2023-2028) (%)
    • 11.22 South Korea - Market size and forecast (2023-2028)
      • Chart on South Korea - Market size and forecast (2023-2028) ($ billion)
      • Data Table on South Korea - Market size and forecast (2023-2028) ($ billion)
      • Chart on South Korea - Year-over-year growth (2023-2028) (%)
      • Data Table on South Korea - Year-over-year growth (2023-2028) (%)
    • 11.23 Mexico - Market size and forecast (2023-2028)
      • Chart on Mexico - Market size and forecast (2023-2028) ($ billion)
      • Data Table on Mexico - Market size and forecast (2023-2028) ($ billion)
      • Chart on Mexico - Year-over-year growth (2023-2028) (%)
      • Data Table on Mexico - Year-over-year growth (2023-2028) (%)
    • 11.24 Italy - Market size and forecast (2023-2028)
      • Chart on Italy - Market size and forecast (2023-2028) ($ billion)
      • Data Table on Italy - Market size and forecast (2023-2028) ($ billion)
      • Chart on Italy - Year-over-year growth (2023-2028) (%)
      • Data Table on Italy - Year-over-year growth (2023-2028) (%)
    • 11.25 Spain - Market size and forecast (2023-2028)
      • Chart on Spain - Market size and forecast (2023-2028) ($ billion)
      • Data Table on Spain - Market size and forecast (2023-2028) ($ billion)
      • Chart on Spain - Year-over-year growth (2023-2028) (%)
      • Data Table on Spain - Year-over-year growth (2023-2028) (%)

    12 Drivers, Challenges, and Opportunity/Restraints

    • 12.1 Market drivers
      • 12.2 Market challenges
        • 12.3 Impact of drivers and challenges
          • Impact of drivers and challenges in 2023 and 2028
        • 12.4 Market opportunities/restraints

          13 Competitive Landscape

          • 13.1 Overview
            • 13.2 Competitive Landscape
              • Overview on criticality of inputs and factors of differentiation
            • 13.3 Landscape disruption
              • Overview on factors of disruption
            • 13.4 Industry risks
              • Impact of key risks on business

            14 Competitive Analysis

            • 14.1 Companies profiled
              • Companies covered
            • 14.2 Market positioning of companies
              • Matrix on companies position and classification
            • 14.3 Arista Networks
              • Arista Networks - Overview
              • Arista Networks - Product / Service
              • Arista Networks - Key offerings
            • 14.4 AT&T
              • AT&T - Overview
              • AT&T - Product / Service
              • AT&T - Key offerings
            • 14.5 Cisco Systems
              • Cisco Systems - Overview
              • Cisco Systems - Product / Service
              • Cisco Systems - Key offerings
            • 14.6 Citrix Systems
              • Citrix Systems - Overview
              • Citrix Systems - Product / Service
              • Citrix Systems - Key offerings
            • 14.7 Dell Technologies
              • Dell Technologies - Overview
              • Dell Technologies - Product / Service
              • Dell Technologies - Key offerings
            • 14.8 Ericsson
              • Ericsson - Overview
              • Ericsson - Product / Service
              • Ericsson - Key offerings
            • 14.9 Hewlett Packard Enterprise
              • Hewlett Packard Enterprise - Overview
              • Hewlett Packard Enterprise - Product / Service
              • Hewlett Packard Enterprise - Key offerings
            • 14.10 Huawei Technologies
              • Huawei Technologies - Overview
              • Huawei Technologies - Product / Service
              • Huawei Technologies - Key offerings
            • 14.11 IBM Corporation
              • IBM Corporation - Overview
              • IBM Corporation - Product / Service
              • IBM Corporation - Key offerings
            • 14.12 Intel Corporation
              • Intel Corporation - Overview
              • Intel Corporation - Product / Service
              • Intel Corporation - Key offerings
            • 14.13 Juniper Networks
              • Juniper Networks - Overview
              • Juniper Networks - Product / Service
              • Juniper Networks - Key offerings
            • 14.14 Microsoft Corporation
              • Microsoft Corporation - Overview
              • Microsoft Corporation - Product / Service
              • Microsoft Corporation - Key offerings
            • 14.15 Nokia Corporation
              • Nokia Corporation - Overview
              • Nokia Corporation - Product / Service
              • Nokia Corporation - Key offerings
            • 14.16 Nutanix
              • Nutanix - Overview
              • Nutanix - Product / Service
              • Nutanix - Key offerings
            • 14.17 Oracle Corporation
              • Oracle Corporation - Overview
              • Oracle Corporation - Product / Service
              • Oracle Corporation - Key offerings
            • 14.18 Red Hat
              • Red Hat - Overview
              • Red Hat - Product / Service
              • Red Hat - Key offerings
            • 14.19 VMware
              • VMware - Overview
              • VMware - Product / Service
              • VMware - Key offerings
            • 14.20 Wind River Systems
              • Wind River Systems - Overview
              • Wind River Systems - Product / Service
              • Wind River Systems - Key offerings
            • 14.21 Extreme Networks
              • Extreme Networks - Overview
              • Extreme Networks - Product / Service
              • Extreme Networks - Key offerings
            • 14.22 Fortinet
              • Fortinet - Overview
              • Fortinet - Product / Service
              • Fortinet - Key offerings
            • 14.23 China Huaxin Post and Telecom Technologies Co. Ltd.
              • China Huaxin Post and Telecom Technologies Co. Ltd. - Overview
              • China Huaxin Post and Telecom Technologies Co. Ltd. - Product / Service
              • China Huaxin Post and Telecom Technologies Co. Ltd. - Key offerings
            • 14.24 Cisco Systems Inc.
              • Cisco Systems Inc. - Overview
              • Cisco Systems Inc. - Product / Service
              • Cisco Systems Inc. - Key offerings
            • 14.25 Citrix Systems Inc.
              • Citrix Systems Inc. - Overview
              • Citrix Systems Inc. - Product / Service
              • Citrix Systems Inc. - Key offerings
            • 14.26 Dell Technologies Inc.
              • Dell Technologies Inc. - Overview
              • Dell Technologies Inc. - Product / Service
              • Dell Technologies Inc. - Key offerings
            • 14.27 Extreme Networks Inc.
              • Extreme Networks Inc. - Overview
              • Extreme Networks Inc. - Product / Service
              • Extreme Networks Inc. - Key offerings
            • 14.28 Fujitsu Ltd.
              • Fujitsu Ltd. - Overview
              • Fujitsu Ltd. - Product / Service
              • Fujitsu Ltd. - Key offerings
            • 14.29 HCL Technologies Ltd.
              • HCL Technologies Ltd. - Overview
              • HCL Technologies Ltd. - Product / Service
              • HCL Technologies Ltd. - Key offerings
            • 14.30 Hewlett Packard Enterprise Co.
              • Hewlett Packard Enterprise Co. - Overview
              • Hewlett Packard Enterprise Co. - Product / Service
              • Hewlett Packard Enterprise Co. - Key offerings
            • 14.31 Huawei Technologies Co. Ltd.
              • Huawei Technologies Co. Ltd. - Overview
              • Huawei Technologies Co. Ltd. - Product / Service
              • Huawei Technologies Co. Ltd. - Key offerings
            • 14.32 Intel Corp.
              • Intel Corp. - Overview
              • Intel Corp. - Product / Service
              • Intel Corp. - Key offerings
            • 14.33 Juniper Networks Inc.
              • Juniper Networks Inc. - Overview
              • Juniper Networks Inc. - Product / Service
              • Juniper Networks Inc. - Key offerings
            • 14.34 Microsoft Corp.
              • Microsoft Corp. - Overview
              • Microsoft Corp. - Product / Service
              • Microsoft Corp. - Key offerings
            • 14.35 NEC Corp.
              • NEC Corp. - Overview
              • NEC Corp. - Product / Service
              • NEC Corp. - Key offerings
            • 14.36 Nokia Corp.
              • Nokia Corp. - Overview
              • Nokia Corp. - Product / Service
              • Nokia Corp. - Key offerings
            • 14.37 Pivot3 Inc.
              • Pivot3 Inc. - Overview
              • Pivot3 Inc. - Product / Service
              • Pivot3 Inc. - Key offerings
            • 14.38 Verizon Communications Inc.
              • Verizon Communications Inc. - Overview
              • Verizon Communications Inc. - Product / Service
              • Verizon Communications Inc. - Key offerings
            • 14.39 Vista Equity Partners Management LLC
              • Vista Equity Partners Management LLC - Overview
              • Vista Equity Partners Management LLC - Product / Service
              • Vista Equity Partners Management LLC - Key offerings
            • 14.40 VMware Inc.
              • VMware Inc. - Overview
              • VMware Inc. - Product / Service
              • VMware Inc. - Key offerings
            • 14.41 Western Digital Corp.
              • Western Digital Corp. - Overview
              • Western Digital Corp. - Product / Service
              • Western Digital Corp. - Key offerings

            15 Appendix

            • 15.1 Scope of the report
              • 15.2 Inclusions and exclusions checklist
                • Inclusions checklist
                • Exclusions checklist
              • 15.3 Currency conversion rates for US$
                • Currency conversion rates for US$
              • 15.4 Research methodology
                • Research methodology
              • 15.5 Data procurement
                • Information sources
              • 15.6 Data validation
                • Data validation
              • 15.7 Validation techniques employed for market sizing
                • Validation techniques employed for market sizing
              • 15.8 Data synthesis
                • Data synthesis
              • 15.9 360 degree market analysis
                • 360 degree market analysis
              • 15.10 List of abbreviations
                • List of abbreviations

              Research Methodology

              Technavio presents a detailed picture of the market by way of study, synthesis, and summation of data from multiple sources. The analysts have presented the various facets of the market with a particular focus on identifying the key industry influencers. The data thus presented is comprehensive, reliable, and the result of extensive research, both primary and secondary.

              INFORMATION SOURCES

              Primary sources

              • Manufacturers and suppliers
              • Channel partners
              • Industry experts
              • Strategic decision makers

              Secondary sources

              • Industry journals and periodicals
              • Government data
              • Financial reports of key industry players
              • Historical data
              • Press releases

              DATA ANALYSIS

              Data Synthesis

              • Collation of data
              • Estimation of key figures
              • Analysis of derived insights

              Data Validation

              • Triangulation with data models
              • Reference against proprietary databases
              • Corroboration with industry experts

              REPORT WRITING

              Qualitative

              • Market drivers
              • Market challenges
              • Market trends
              • Five forces analysis

              Quantitative

              • Market size and forecast
              • Market segmentation
              • Geographical insights
              • Competitive landscape

              Interested in this report?

              Get your sample now to see our research methodology and insights!

              Download Now

              Frequently Asked Questions

              Software Defined Everything (SDE) market growth will increase by $ 162.8 bn during 2024-2028.

              The Software Defined Everything (SDE) market is expected to grow at a CAGR of 34.2% during 2024-2028.

              Software Defined Everything (SDE) market is segmented by End-user( IT and telecom, BFSI, Government and defense, Others) Application( IT Infrastructure, Cloud Computing, Network Security)

              Arista Networks, AT&T, Cisco Systems, Citrix Systems, Dell Technologies, Ericsson, Hewlett Packard Enterprise, Huawei Technologies, IBM Corporation, Intel Corporation, Juniper Networks, Microsoft Corporation, Nokia Corporation, Nutanix, Oracle Corporation, Red Hat, VMware, Wind River Systems, Extreme Networks, Fortinet are a few of the key vendors in the Software Defined Everything (SDE) market.

              North America will register the highest growth rate of 53% among the other regions. Therefore, the Software Defined Everything (SDE) market in North America is expected to garner significant business opportunities for the vendors during the forecast period.

              US, China, Germany, Japan, UK, Australia, India, France, Brazil, UAE, Rest of World (ROW), Saudi Arabia, France, South Korea, Mexico, Italy, Spain

              • Increase in adoption of cloud services among enterprisesThe introduction of cloud computing has enhanced and simplified IT management and maintenance capabilities. The adoption of SDE services is on the rise. It provides a central administration and control for all resources is the driving factor this market.
              • vendor-managed infrastructure and service-level agreement (SLA)-backed agreements. Cloud computing eliminates the need for users to update and maintain IT infrastructure. The maintenance of all services is taken care of by the service provider. Users need not install any additional software for accessing applications and services. SLA ensures reliable delivery is the driving factor this market.
              • management is the driving factor this market.
              • and maintenance of IT service to end-users. Organizations worldwide are adopting cloud-based managed services to cut costs associated with managing enterprise IT infrastructure. Also is the driving factor this market.
              • with cloud computing services is the driving factor this market.
              • end-users can concentrate more on core organizational activities rather than on managing applications. Furthermore is the driving factor this market.
              • enterprises can establish a rapid deployment model that enables applications to be scaled quickly to match changing requirements. The cloud computing model helps enterprises in easy integration with third-party applications is the driving factor this market.
              • which are hosted outside the enterprise firewall. Hence is the driving factor this market.
              • the cloud has evolved as an ideal model platform and integration fabric for many enterprise applications with configuration flexibility is the driving factor this market.
              • choice of access mechanisms is the driving factor this market.
              • and integrated security. In addition is the driving factor this market.
              • the cloud computing model provides security at all levels of enterprise IT architecture so that these applications can be accessed even from a remote location. The adoption of cloud-based managed services for cost reduction is expected to be high during the forecast period. The requirements for the maximum segment size (MSS) from cloud computing service providers are high due to cloud computing as it is prone to cyber-attacks. Such factors are expected to increase the adoption of cloud computing services by enterprises is the driving factor this market.
              • which is expected to propel the growth of the global SDE market during the forecast period. is the driving factor this market.

              The Software Defined Everything (SDE) market vendors should focus on grabbing business opportunities from the IT and telecom segment as it accounted for the largest market share in the base year.
              RIA - Research AI Assistant
              Ask RIA