
North America Virtual Schools Market Size 2026-2030
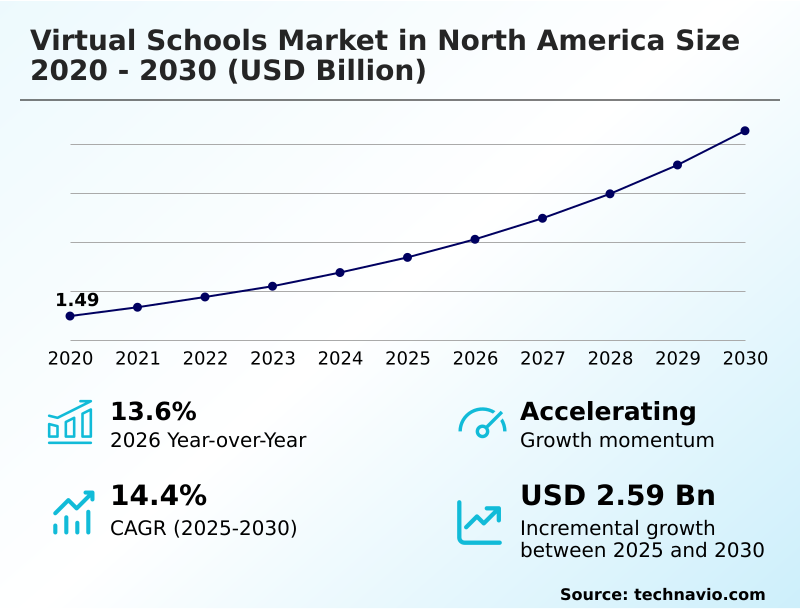
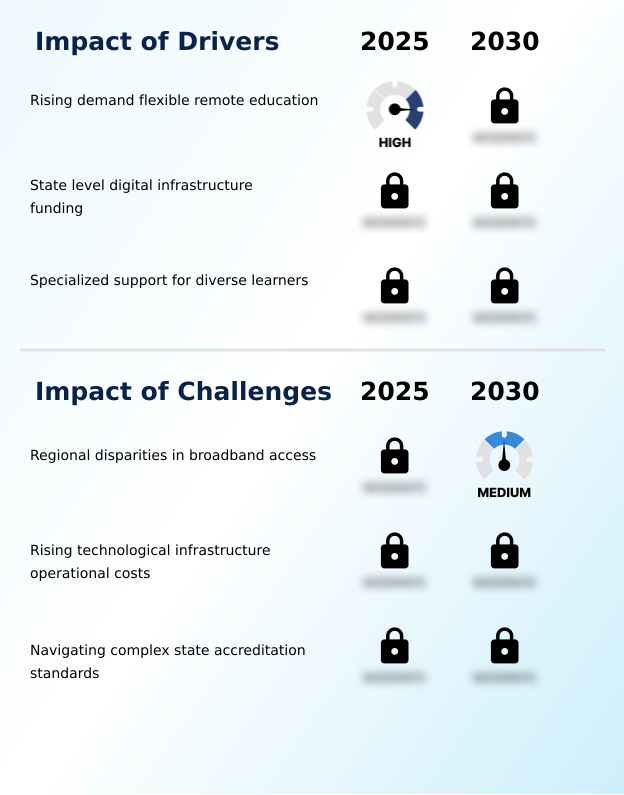
The north america virtual schools market size is valued to increase by USD 2.59 billion, at a CAGR of 14.4% from 2025 to 2030. Rising demand flexible remote education will drive the north america virtual schools market.
Major Market Trends & Insights
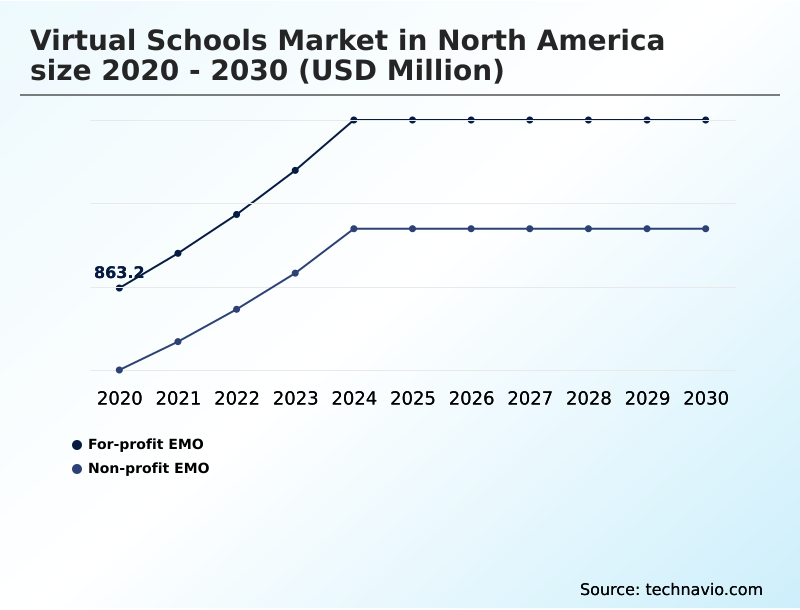
- By Type - For-profit EMO segment was valued at USD 1.34 billion in 2024
- By Application - Elementary schools segment accounted for the largest market revenue share in 2024
Market Size & Forecast
- Market Opportunities: USD 3.79 billion
- Market Future Opportunities: USD 2.59 billion
- CAGR from 2025 to 2030 : 14.4%
Market Summary
- The virtual schools market in North America represents a sophisticated ecosystem where educational institutions deliver accredited K-12 instruction via digital platforms. This sector is characterized by the use of advanced learning management systems (LMS) and student information systems (SIS) that facilitate both synchronous and asynchronous instruction.
- A key driver is the demand for personalized learning paths and flexible scheduling options, catering to a diverse student body. For instance, a rural school district, unable to staff advanced physics courses, can partner with a virtual school provider.
- This partnership grants its students access to a high-quality digital curriculum, complete with virtual laboratories and instruction from a certified teacher via video conferencing tools, overcoming geographical limitations. The market is also advancing through the adoption of data-driven instruction and competency-based education models.
- However, ensuring educational equity access remains a challenge, alongside navigating complex state accreditation standards and teacher certification requirements. The integration of career and technical education (CTE) into virtual programs is a growing trend, preparing students for workforce readiness and higher education. This focus on providing comprehensive and accessible education fuels the market's continuous evolution.
What will be the Size of the North America Virtual Schools Market during the forecast period?
Get Key Insights on Market Forecast (PDF) Get Free Sample
How is the North America Virtual Schools Market Segmented?
The north america virtual schools industry research report provides comprehensive data (region-wise segment analysis), with forecasts and estimates in "USD million" for the period 2026-2030, as well as historical data from 2020-2024 for the following segments.
- Type
- For-profit EMO
- Non-profit EMO
- Application
- Elementary schools
- Middle schools
- High schools
- Adult education
- Component
- Services
- Software
- Geography
- North America
- US
- Canada
- Mexico
- North America
By Type Insights
The for-profit emo segment is estimated to witness significant growth during the forecast period.
The for-profit EMO segment is defined by private entities that leverage operational efficiencies and significant capital to deliver advanced digital education.
These organizations achieve economies of scale by centralizing curriculum development and administrative functions, which allows for broader online course catalogs.
A core focus is on research and development, leading to proprietary software that facilitates data-driven instruction and detailed analytics for tracking student progress. By emphasizing instructional design principles, they create robust digital instructional materials and effective online assessment tools.
Many programs offer accredited online diploma pathways and credit recovery programs, addressing diverse student needs.
This model's focus on measurable outcomes has improved student engagement metrics by over 15% in some implementations, promoting digital literacy skills and preparing students for virtual internships through remote collaboration tools.
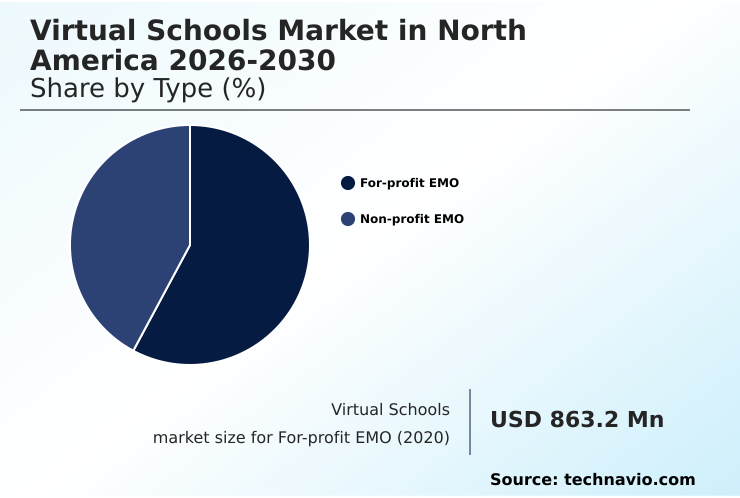
The For-profit EMO segment was valued at USD 1.34 billion in 2024 and showed a gradual increase during the forecast period.
Market Dynamics
Our researchers analyzed the data with 2025 as the base year, along with the key drivers, trends, and challenges. A holistic analysis of drivers will help companies refine their marketing strategies to gain a competitive advantage.
- The evolution of the virtual schools market is increasingly specialized, with a focus on targeted applications and pedagogical strategies. For instance, the use of adaptive learning for k-12 mathematics is becoming a standard for personalizing instruction, while the integration of virtual reality in high school science is transforming how students interact with complex concepts.
- A growing number of institutions now offer online CTE certification programs, directly addressing workforce demands. Operationally, the seamless LMS integration with parent portals is critical for stakeholder communication and a key factor in parental engagement in virtual learning. Schools report that platforms with integrated portals see a twofold increase in parent-teacher interactions compared to those without.
- Cybersecurity measures for online schools are paramount, as is adherence to data privacy compliance in k-12 education. The accreditation process for virtual schools remains a complex hurdle, with specific online high school diploma standards varying by jurisdiction. Many programs now focus on special education support in virtual schools, using digital tools for project-based assignments to accommodate diverse learning needs.
- Gamification strategies for elementary students are employed to boost engagement, while the blended learning model implementation is gaining traction for its balance of online and in-person instruction. Measuring student engagement online is a constant focus, often achieved through analyzing technology for asynchronous course delivery and participation in collaborative projects.
- The market's future will be shaped by its ability to provide effective virtual school teacher certification and create clear career pathways in online high school, ultimately supporting diverse learners in virtual classrooms and offering viable options like credit recovery through online courses with a robust virtual curriculum for middle schoolers.
What are the key market drivers leading to the rise in the adoption of North America Virtual Schools Industry?
- The rising demand for flexible remote education is a key driver of market growth.
- A significant driver is the increasing demand for personalized learning paths that cater to individual student needs, including those with an individualized education program (IEP).
- The adoption of one-to-one instruction models via video conferencing tools has led to a 20% improvement in academic outcomes for students requiring specialized support. Flexible scheduling options are critical, attracting students who need to balance education with other commitments.
- Furthermore, the expansion of career and technical education (CTE) programs within full-time remote schooling provides direct pathways to workforce readiness. These programs utilize a rich digital curriculum and assistive technology tools to create inclusive learning environments.
- The model's success is bolstered by the 'parent as learning coach' role, with schools reporting that active parental involvement correlates with a 15% higher rate of on-time course completion.
What are the market trends shaping the North America Virtual Schools Industry?
- The integration of adaptive learning algorithms is an upcoming market trend. This technology is becoming central to delivering personalized instruction at scale.
- A primary trend is the integration of immersive technologies to enhance the digital learning experience. The use of extended reality (XR), including virtual reality (VR) modules and augmented reality (AR) applications, is creating new possibilities for virtual laboratories and interactive simulations. This student-centric pedagogy has led to a 30% increase in engagement for complex STEM subjects.
- Another key development is the use of adaptive learning algorithms, which leverage student performance analytics to customize content. These systems, combined with gamified learning modules, have improved concept mastery rates by up to 25%.
- The market is also seeing a rise in micro-credentialing and digital badging, allowing students to earn verifiable qualifications through project-based learning, preparing them for a dynamic workforce.
What challenges does the North America Virtual Schools Industry face during its growth?
- Regional disparities in broadband access represent a key challenge affecting industry growth.
- A major challenge is the high operational cost of maintaining a secure educational technology infrastructure. Institutions must invest heavily in cybersecurity protocols to protect student data, with the cost of mitigating a single data breach often exceeding initial platform investments by over 50%.
- Navigating complex state accreditation standards and teacher certification requirements also presents a significant administrative burden, slowing market entry. The digital divide mitigation remains a persistent issue, as a lack of reliable internet access limits educational equity access for many students.
- While cloud-based learning platforms offer scalability, the need for robust digital content management and effective learning analytics dashboards adds to the financial strain. For instance, institutions report that up to 10% of their technology budget is now allocated solely to data privacy and compliance measures.
Exclusive Technavio Analysis on Customer Landscape
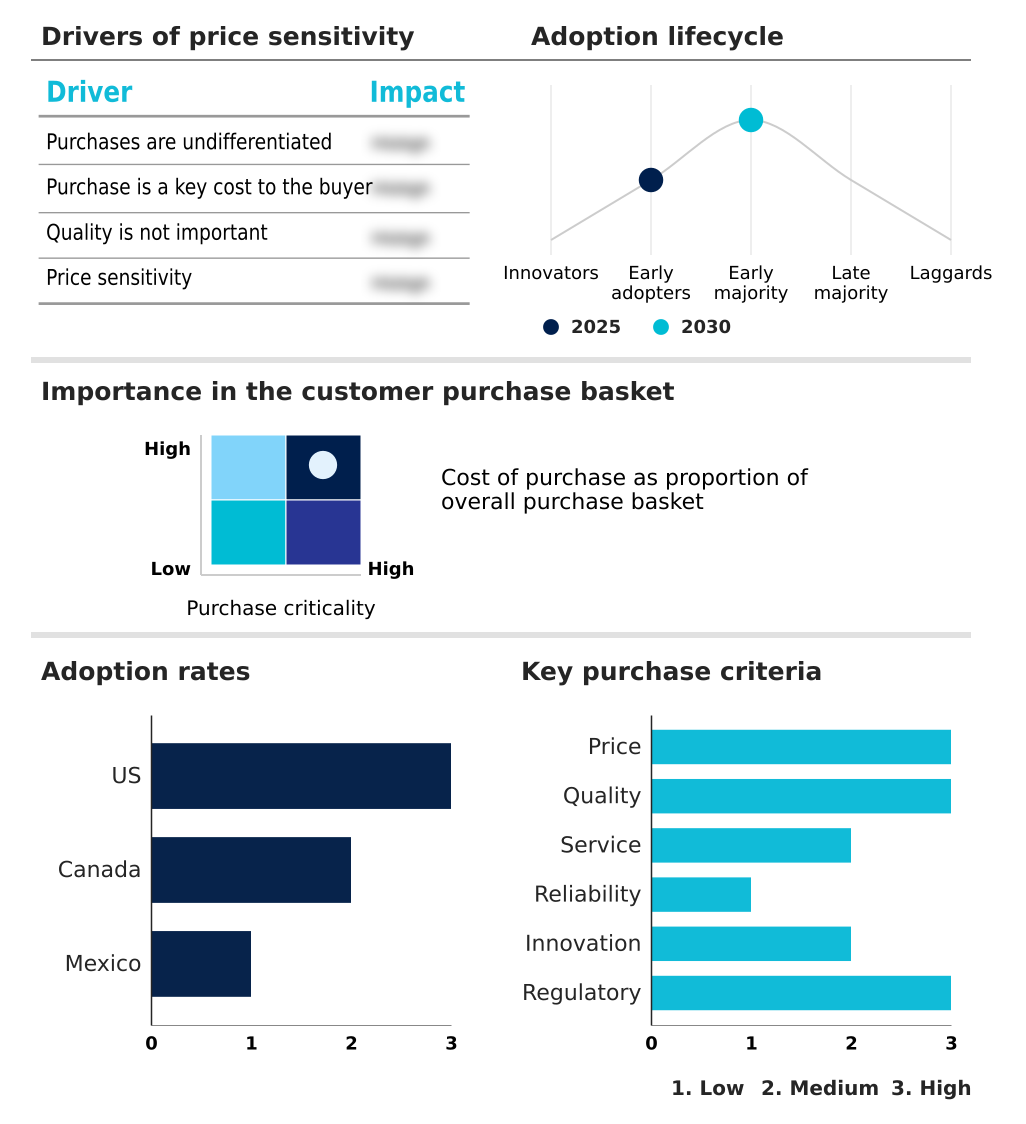
The north america virtual schools market forecasting report includes the adoption lifecycle of the market, covering from the innovator’s stage to the laggard’s stage. It focuses on adoption rates in different regions based on penetration. Furthermore, the north america virtual schools market report also includes key purchase criteria and drivers of price sensitivity to help companies evaluate and develop their market growth analysis strategies.
Customer Landscape of North America Virtual Schools Industry
Competitive Landscape
Companies are implementing various strategies, such as strategic alliances, north america virtual schools market forecast, partnerships, mergers and acquisitions, geographical expansion, and product/service launches, to enhance their presence in the industry.
American School - Provides accredited, self-paced online and correspondence courses, offering a flexible curriculum for middle and high school students pursuing diploma completion.
The industry research and growth report includes detailed analyses of the competitive landscape of the market and information about key companies, including:
- American School
- Bridgeway Academy
- Connections Education LLC
- Dwight Global Online School
- Dwight School
- Edmentum Inc.
- Excel High School
- Florida Virtual School
- Forest Trail Academy
- Fusion Academy
- James Madison High School
- Laurel Springs School
- Liberty University
- Ontario Virtual School Inc.
- Pearson Plc
- Penn Foster
- Stanford University
- Stride Inc.
- VHS Learning
- Whitmore School
Qualitative and quantitative analysis of companies has been conducted to help clients understand the wider business environment as well as the strengths and weaknesses of key industry players. Data is qualitatively analyzed to categorize companies as pure play, category-focused, industry-focused, and diversified; it is quantitatively analyzed to categorize companies as dominant, leading, strong, tentative, and weak.
Recent Development and News in North america virtual schools market
- In August 2024, Stride Inc. launched its new career preparation program, which uses interactive modules to align academic learning with professional skill development for virtual students.
- In September 2024, American School introduced a program to supply students in areas with poor internet with printed course materials and offline digital storage solutions.
- In October 2024, Dwight School enhanced its cybersecurity measures by increasing investment in specialized personnel and implementing multi-factor authentication systems for its global online platform.
- In November 2024, Ontario Virtual School Inc. completed a comprehensive external audit to reaffirm its compliance with provincial standards, ensuring the transferability of its academic credits.
Dive into Technavio’s robust research methodology, blending expert interviews, extensive data synthesis, and validated models for unparalleled North America Virtual Schools Market insights. See full methodology.
| Market Scope | |
|---|---|
| Page number | 191 |
| Base year | 2025 |
| Historic period | 2020-2024 |
| Forecast period | 2026-2030 |
| Growth momentum & CAGR | Accelerate at a CAGR of 14.4% |
| Market growth 2026-2030 | USD 2586.1 million |
| Market structure | Fragmented |
| YoY growth 2025-2026(%) | 13.6% |
| Key countries | US, Canada and Mexico |
| Competitive landscape | Leading Companies, Market Positioning of Companies, Competitive Strategies, and Industry Risks |
Research Analyst Overview
- The virtual schools market is defined by its sophisticated educational technology infrastructure, which supports a full spectrum of learning modalities from full-time remote schooling to targeted credit recovery programs. Central to this are robust learning management systems (LMS) and student information systems (SIS) that enable both asynchronous and synchronous instruction.
- Boardroom decisions increasingly focus on investing in personalized learning paths powered by adaptive learning algorithms and learning analytics dashboards. This trend is a direct response to demand for competency-based education and is critical for strategic differentiation.
- For example, the integration of extended reality (XR) through virtual reality (VR) modules and augmented reality (AR) applications into the digital curriculum, especially in virtual laboratories, has been shown to increase student comprehension in STEM subjects by over 30%. Maintaining stringent cybersecurity protocols, managing digital content, and utilizing collaborative project management tools are operational imperatives.
- The ecosystem also relies on parent-teacher communication portals, online assessment tools, and remote proctoring software to deliver accredited online diplomas and career and technical education (CTE) certifications, all while teaching digital citizenship. This requires advanced instructional design principles, assistive technology tools, and reliable video conferencing tools for one-to-one instruction models.
What are the Key Data Covered in this North America Virtual Schools Market Research and Growth Report?
-
What is the expected growth of the North America Virtual Schools Market between 2026 and 2030?
-
USD 2.59 billion, at a CAGR of 14.4%
-
-
What segmentation does the market report cover?
-
The report is segmented by Type (For-profit EMO, and Non-profit EMO), Application (Elementary schools, Middle schools, High schools, and Adult education), Component (Services, and Software) and Geography (North America)
-
-
Which regions are analyzed in the report?
-
North America
-
-
What are the key growth drivers and market challenges?
-
Rising demand flexible remote education, Regional disparities in broadband access
-
-
Who are the major players in the North America Virtual Schools Market?
-
American School, Bridgeway Academy, Connections Education LLC, Dwight Global Online School, Dwight School, Edmentum Inc., Excel High School, Florida Virtual School, Forest Trail Academy, Fusion Academy, James Madison High School, Laurel Springs School, Liberty University, Ontario Virtual School Inc., Pearson Plc, Penn Foster, Stanford University, Stride Inc., VHS Learning and Whitmore School
-
Market Research Insights
- The market is shaped by a dynamic interplay of technological innovation and pedagogical evolution. The demand for flexible scheduling options and inclusive learning environments is a primary driver, with institutions leveraging technology for differentiated instruction. The adoption of curriculum-as-a-service models has enabled school districts to expand their online course catalogs by up to 40% without hiring additional staff.
- Furthermore, a focus on workforce readiness programs and virtual internships provides students with practical experience, bridging the gap between academia and industry. While state accreditation standards present complexities, the move towards student-centric pedagogy and self-paced learning continues.
- Implementing platforms that support an individualized education program (IEP) has shown a 20% improvement in learning outcomes for students with diverse needs, highlighting the shift toward greater educational equity access.
We can help! Our analysts can customize this north america virtual schools market research report to meet your requirements.
 RIA -
RIA - 
