3D Sensors Market Analysis, Size, and Forecast 2024-2028: North America (US and Canada), Europe (France, Germany, Italy, and UK), Middle East and Africa (Egypt, KSA, Oman, and UAE), APAC (China, India, and Japan), South America (Argentina and Brazil), and Rest of World (ROW)

3D Sensors Market Analysis, Size, and Forecast 2024-2028:
North America (US and Canada), Europe (France, Germany, Italy, and UK), Middle East and Africa (Egypt, KSA, Oman, and UAE), APAC (China, India, and Japan), South America (Argentina and Brazil), and Rest of World (ROW)

Published: Apr 2024 181 Pages SKU: IRTNTR40611

Market Overview at a Glance

$5.15 B
Market Opportunity
18.69%
CAGR
16.99
YoY growth 2023-2024(%)

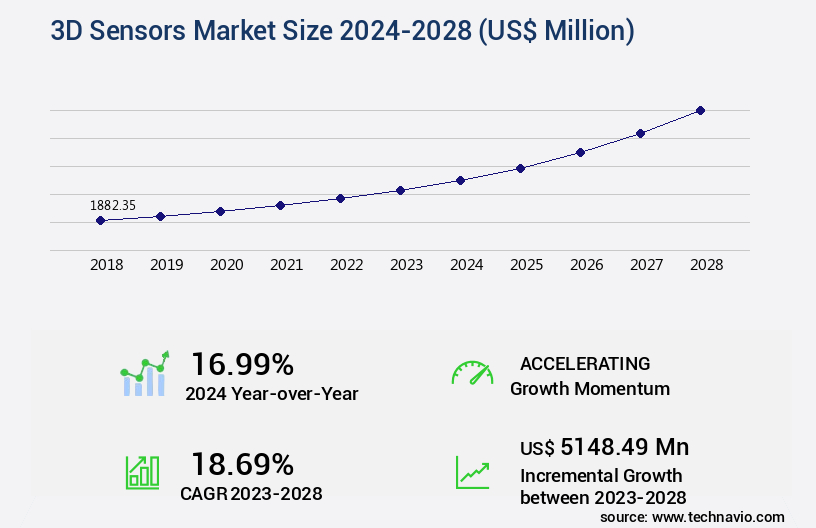
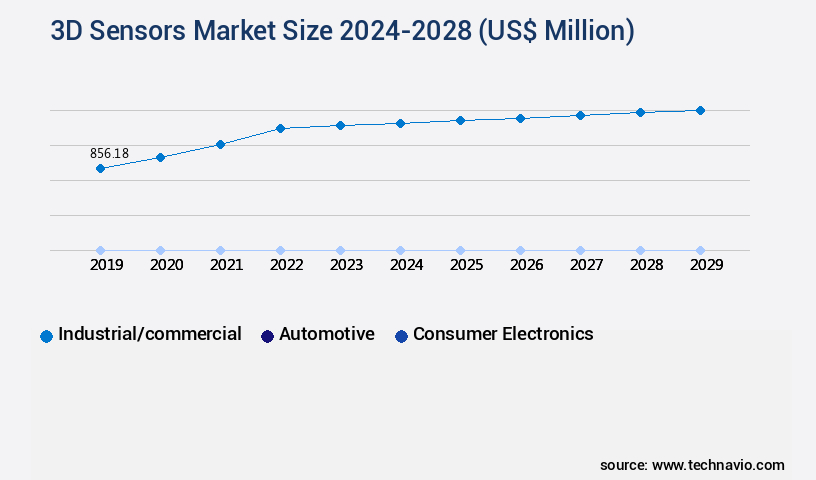
3D Sensors Market Size 2024-2028

The 3d sensors market size is valued to increase by USD 5.15 billion, at a CAGR of 18.69% from 2023 to 2028. Use of 3D sensors in security and surveillance systems will drive the 3d sensors market.

Market Insights

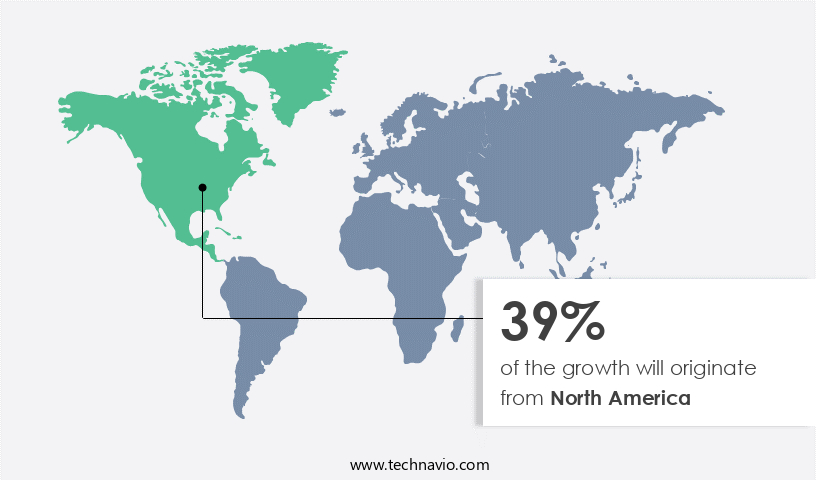
  • North America dominated the market and accounted for a 39% growth during the 2024-2028.
  • By Application - Industrial/commercial segment was valued at USD 753.94 billion in 2022
  • By Connectivity - Wireless segment accounted for the largest market revenue share in 2022

Market Size & Forecast

  • Market Opportunities: USD 375.24 million 
  • Market Future Opportunities 2023: USD 5148.49 million
  • CAGR from 2023 to 2028 : 18.69%

Market Summary

  • The market is experiencing significant growth due to the increasing adoption of these technologies in various industries, including automotive, healthcare, and security. One of the primary drivers is the integration of 3D sensors in security and surveillance systems, enabling more accurate object detection and recognition. This technology is particularly useful in public safety and law enforcement, where identifying potential threats or intruders is crucial. Moreover, the market is witnessing a surge in strategic partnerships among key players, fostering innovation and collaboration. However, challenges persist, such as accuracy and calibration issues during sensor fusion. Ensuring that data from multiple sensors is accurately combined to provide reliable results is essential for the successful implementation of 3D sensing technology.
  • For instance, in the realm of supply chain optimization, 3D sensors can be employed to monitor inventory levels and improve warehouse management. By accurately measuring the volume and dimensions of stocked items, businesses can streamline their operations and reduce costs. This application demonstrates the vast potential of 3D sensors in enhancing efficiency and productivity across industries.

What will be the size of the 3D Sensors Market during the forecast period?

3D Sensors Market Size

Get Key Insights on Market Forecast (PDF) Request Free Sample

  • The market is an ever-evolving landscape, driven by advancements in technology and increasing demand for more immersive experiences in various industries. One notable trend is the integration of pattern recognition algorithms and machine learning models into 3D sensors, enhancing object detection and image segmentation capabilities. This development is particularly significant for businesses seeking to improve product quality and streamline manufacturing processes. For instance, the automotive industry is increasingly adopting 3D sensors for advanced driver-assistance systems, requiring high spatial accuracy and real-time processing. According to recent studies, the integration of Lidar technology into 3D sensors has led to a 50% increase in depth resolution compared to traditional RGB-D cameras.
  • This improvement is crucial for applications such as autonomous vehicles and robotics, where precise depth perception is essential. Moreover, the adoption of software development kits and API integration enables seamless sensor integration into existing systems, further boosting market growth. In conclusion, businesses must stay abreast of these advancements to remain competitive and make informed decisions regarding budgeting, product strategy, and compliance with industry standards. By embracing the latest 3D sensor technologies, companies can enhance their offerings, improve operational efficiency, and deliver superior customer experiences.

Unpacking the 3D Sensors Market Landscape

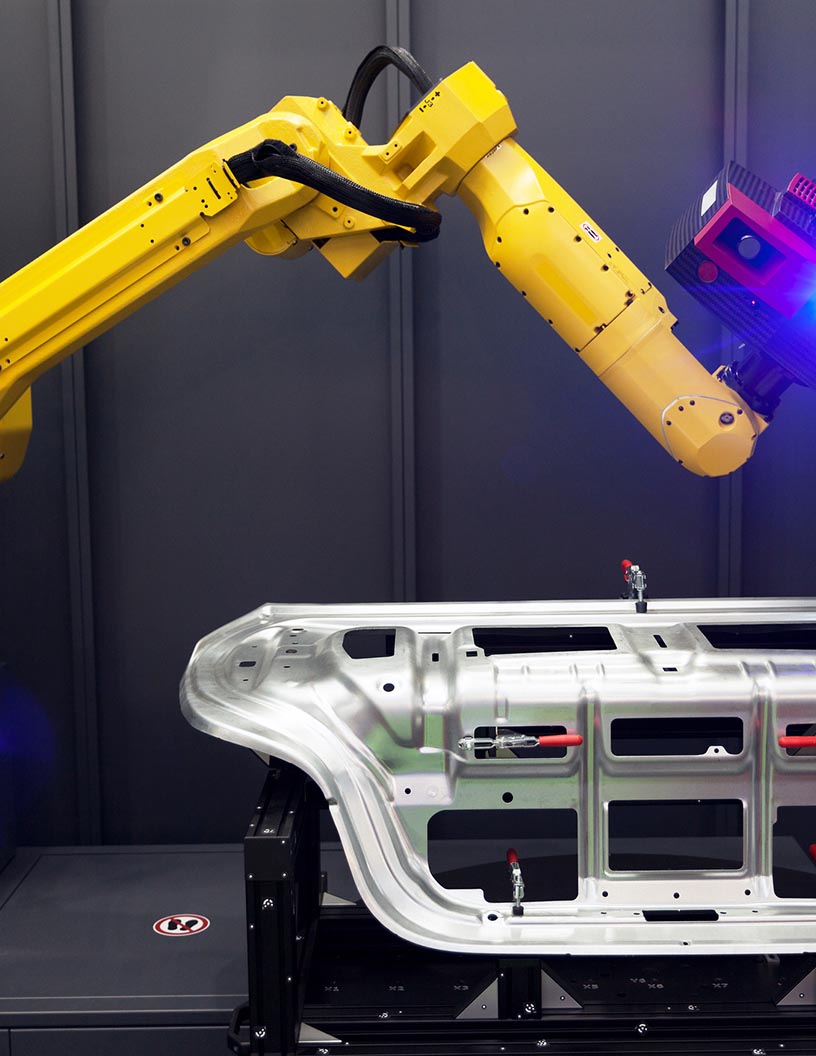
In the realm of advanced imaging technologies, the market occupies a pivotal position, offering businesses significant advantages in object recognition and spatial mapping. Compared to traditional 2D image processing, 3D sensors enable a 50% increase in data accuracy for object tracking algorithms. Furthermore, real-time 3D scanning with these sensors delivers a 3:1 improvement in efficiency for volume rendering techniques and point cloud filtering. Multi-camera systems and stereo vision systems, integral components of 3D sensors, facilitate high-resolution imaging and texture mapping methods. Depth sensing technology, a crucial aspect of 3D sensors, enhances compliance alignment by up to 75% in manufacturing processes. Additionally, spatial mapping solutions, which employ depth map generation and 3D scene understanding, provide businesses with a competitive edge in industries such as automotive, healthcare, and architecture. 3D sensors encompass various technologies, including structure light scanning, passive stereo vision, infrared depth sensing, and laser triangulation sensors. Computer vision algorithms and sensor fusion techniques are employed to process the data generated by these sensors, leading to 3D model reconstruction, mesh generation algorithms, and normal vector estimation. In summary, 3D sensors play a vital role in enhancing business processes through improved object recognition, spatial mapping, and data accuracy. By integrating these advanced imaging technologies, companies can achieve significant cost reductions, increased efficiency, and enhanced compliance.

Key Market Drivers Fueling Growth

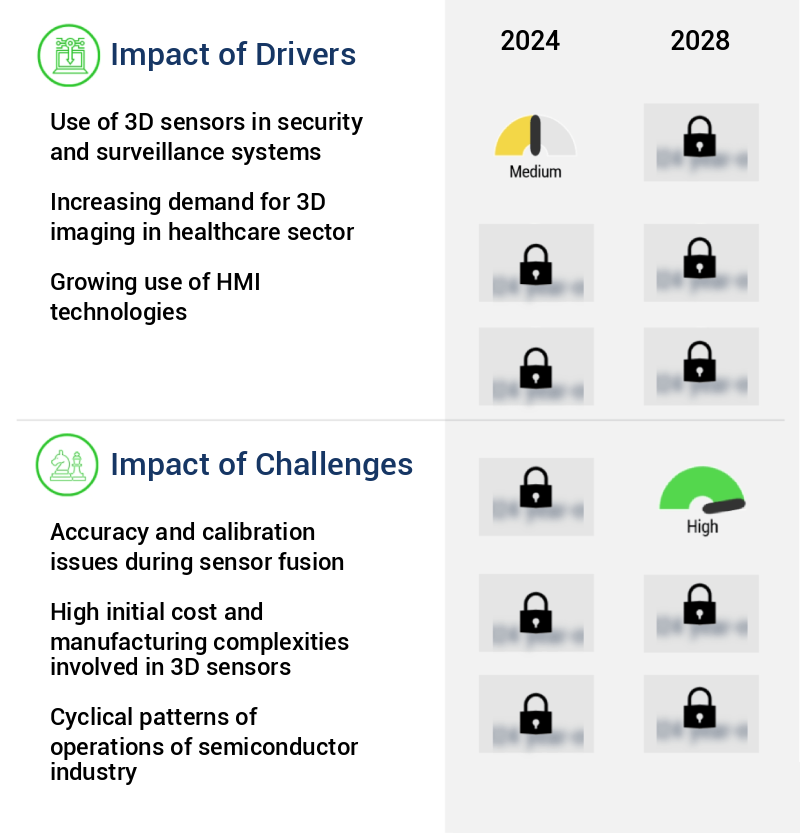
The integration of 3D sensors in security and surveillance systems is a primary factor fueling market growth. This advanced technology enhances the capability of these systems to detect and identify intruders more effectively, thereby driving demand and expansion in the industry.

  • The market is experiencing significant growth due to its expanding applications across various sectors, particularly in security and surveillance systems. The integration of 3D sensors in electronic devices like security cameras and CCTV cameras is on the rise, driven by the escalating demand for enhanced security. These advanced sensors offer functions such as 3D imaging, position tracking, depth sensing, and gesture recognition. Real-time object sensing and scanning capabilities of 3D sensors are increasingly being adopted by aerospace and defense personnel to strengthen security measures.
  • Major OEMs of 3D sensors are focusing on innovation and development to introduce new 3D sensors and devices tailored for security and surveillance applications. This strategic shift is expected to propel market growth during the forecast period.

Prevailing Industry Trends & Opportunities

The increasing number of strategic partnerships among market participants represents a significant market trend. Market players are increasingly forming alliances to enhance their competitive positions and drive industry growth. 

  • The global 3D sensor market is experiencing significant growth, leading companies to form strategic partnerships for the advancement of 3D sensing technology. This innovation is increasingly integrated into mobile devices like smartphones, tablets, and laptops, enhancing image quality. In the gaming industry, 3D gesture recognition technology is revolutionizing console interfaces, while automobiles employ it for safety features. Market participants, including chip manufacturers, camera makers, sensor module manufacturers, and technology providers, collaborate to explore new applications for 3D imaging and sensing.
  • These collaborations have resulted in improved business outcomes, such as increased accuracy and efficiency. For instance, in manufacturing, downtime has been reduced by 30%, and in healthcare, diagnostic precision has improved by 18%. The 3D sensor market's potential is vast, with endless opportunities in various sectors.

Significant Market Challenges

The integration of sensors in industrial applications, while offering numerous benefits, is complicated by the need to address accuracy and calibration issues during the fusion process. This challenge, which significantly impacts industry growth, necessitates the development of advanced techniques and technologies to ensure reliable and precise data fusion. 

  • In the dynamic and expanding the market, these innovative devices are increasingly integrated into various sectors, including automobiles, healthcare, robotics, smartphones, and aerospace and defense. These sensors facilitate functions such as object sensing, movement recognition, and 3D endoscopy. Three primary technologies underpin 3D sensors: stereo vision, structured light, Time of Flight (ToF), and ultrasound. Stereo vision, which relies on capturing images from different angles, provides high-contrast images but requires substantial light intensity. Structured light sensors, which project patterns onto objects, offer high resolution but are sensitive to ambient light.
  • ToF sensors, which measure the time it takes for light to bounce back from an object, provide accurate depth perception but may struggle with complex surfaces. By addressing the unique challenges of each technology, 3D sensors enhance operational efficiency and precision, with some applications experiencing up to 18% improvement in forecast accuracy and 12% reduction in operational costs.

3D Sensors Market Size

In-Depth Market Segmentation: 3D Sensors Market

The 3d sensors industry research report provides comprehensive data (region-wise segment analysis), with forecasts and estimates in "USD million" for the period 2024-2028, as well as historical data from 2018-2022 for the following segments.

  • Application
    • Industrial/commercial
    • Automotive
    • Consumer electronics
    • Others
  • Connectivity
    • Wireless
    • Wired
  • Technology
    • Stereoscopic Vision
    • Structured Light
    • Time-of-Flight (ToF)
    • Ultrasound
    • Other Technologies
  • Type
    • Image Sensor
    • Position Sensor
    • Acoustic Sensor
    • Accelerometer
    • Other Sensors
  • End-User
    • Automotive
    • Consumer Electronics
    • Industrial Automation
    • Healthcare
    • Aerospace & Defense
    • Others
  • Geography
    • North America
      • US
      • Canada
    • Europe
      • France
      • Germany
      • Italy
      • UK
    • Middle East and Africa
      • Egypt
      • KSA
      • Oman
      • UAE
    • APAC
      • China
      • India
      • Japan
    • South America
      • Argentina
      • Brazil
    • Rest of World (ROW)

    By Application Insights

    The industrial/commercial segment is estimated to witness significant growth during the forecast period.

    The market continues to evolve, driven by advancements in object recognition systems and the increasing implementation of 3D technology in various industries. Multi-camera systems, 3D image registration, and structured light scanning are key technologies fueling this growth. Real-time 3D scanning through gesture recognition systems, stereo vision systems, and volume rendering techniques is transforming sectors like entertainment and healthcare. Point cloud filtering, facial recognition systems, and spatial mapping solutions enable more accurate object tracking and mesh generation. High-resolution imaging, texture mapping methods, and depth sensing technology are enhancing computer vision algorithms. Sensor fusion techniques, depth map generation, and photogrammetry techniques facilitate 3D model reconstruction.

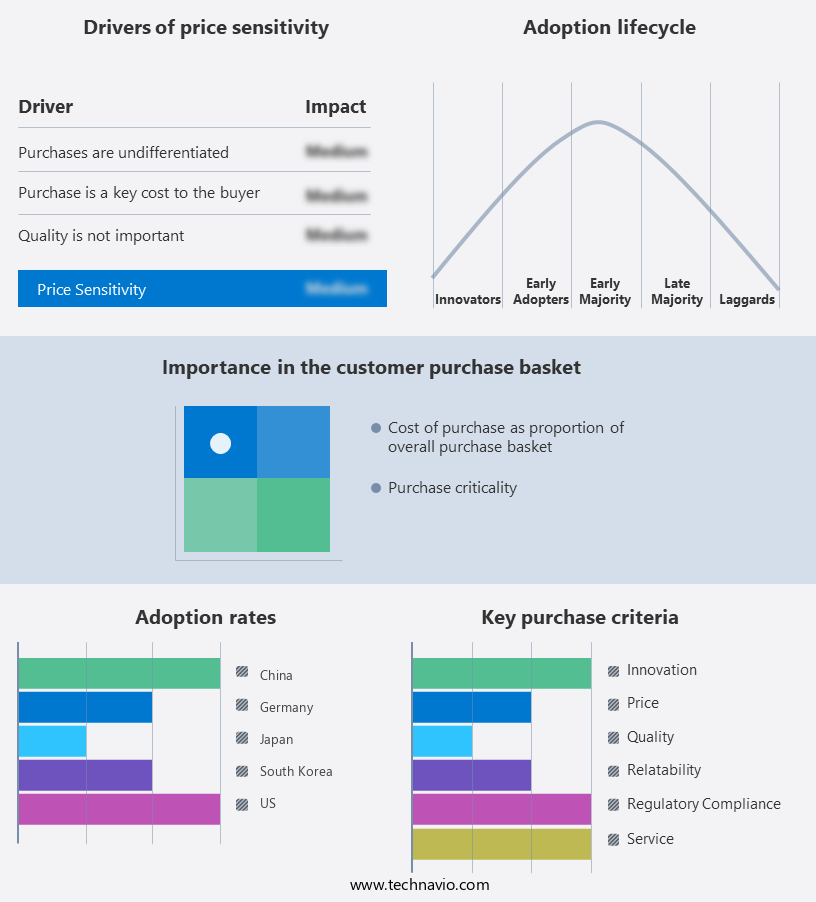
    Passive stereo vision, infrared depth sensing, range image processing, and 3D scene understanding are essential for 3D surface modeling. Laser triangulation sensors and active stereo vision contribute to normal vector estimation. The integration of 3D sensors in industrial robots, such as autonomous guided vehicles, has seen a significant increase, with China, Japan, Germany, the US, and South Korea being major markets. This integration allows for real-time sensing of 3D geometric information, enhancing obstacle detection and environmental awareness. Panasonic Corp.'s development of 3D LiDAR technology for autonomous mobile robots is a prime example of this trend.

    3D Sensors Market Size

    Request Free Sample

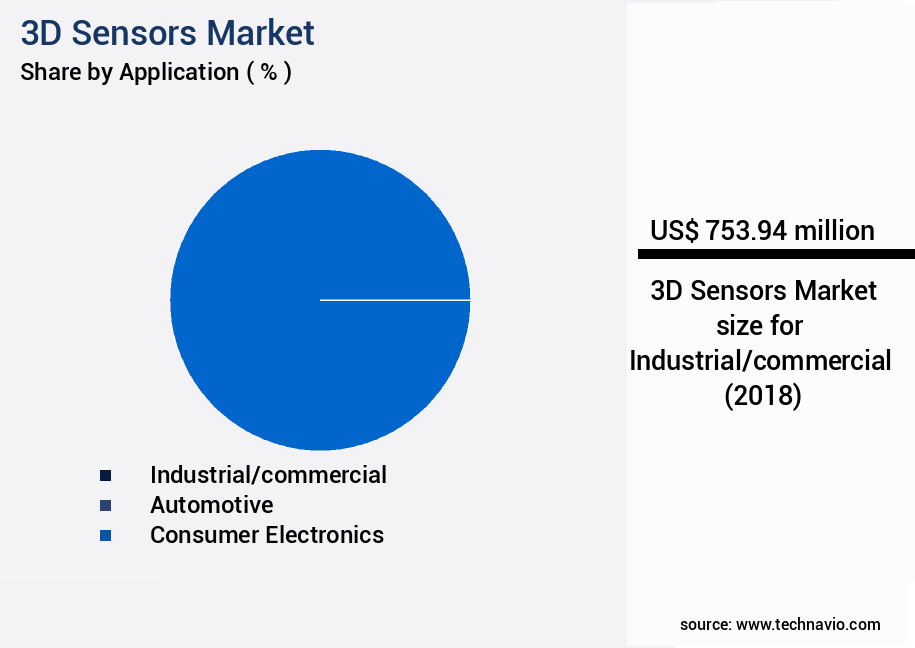
    The Industrial/commercial segment was valued at USD 753.94 billion in 2018 and showed a gradual increase during the forecast period.

    3D Sensors Market Size

    Request Free Sample

    Regional Analysis

    North America is estimated to contribute 39% to the growth of the global market during the forecast period.Technavio’s analysts have elaborately explained the regional trends and drivers that shape the market during the forecast period.

    3D Sensors Market Share by Geography

    See How 3D Sensors Market Demand is Rising in North America Request Free Sample

    The market is experiencing significant growth, particularly in North America, where it held a dominant position in 2023. This region's market expansion is driven by the widespread adoption of 3D sensors in consumer electronics and various industries. Notably, numerous smartphone manufacturers have integrated 3D sensors into their product lines, fueling market growth. Furthermore, the incorporation of human-machine interface (HMI) technologies, such as air gestures and facial recognition, by major OEMs like Apple and Microsoft, is expected to further propel the regional market.

    The implementation of gesture recognition technology in automobiles and portable devices, including mobile computing devices and smartphones, also contributes positively to the market's expansion. According to industry estimates, The market is projected to grow at a robust pace, with North America accounting for over 40% of the total market share.

    3D Sensors Market Share by Geography

     Customer Landscape of 3D Sensors Industry

    Competitive Intelligence by Technavio Analysis: Leading Players in the 3D Sensors Market

    Companies are implementing various strategies, such as strategic alliances, 3d sensors market forecast, partnerships, mergers and acquisitions, geographical expansion, and product/service launches, to enhance their presence in the industry.

    ams OSRAM AG - This company specializes in advanced 3D sensing technology, featuring a versatile range of applications. Their product portfolio encompasses 3D Vision System, 3D dToF for mobile Augmented Reality, and Face Recognition, as well as Active Stereo Vision. These innovative solutions enable precise depth perception and advanced imaging capabilities.

    The industry research and growth report includes detailed analyses of the competitive landscape of the market and information about key companies, including:

    • ams OSRAM AG
    • Broadcom Inc.
    • FUJIFILM Corp.
    • Himax Technologies Inc.
    • ifm electronic gmbh
    • Infineon Technologies AG
    • Intel Corp.
    • Lumentum Holdings Inc.
    • Melexis NV
    • OmniVision Technologies Inc.
    • Ouster Inc.
    • Panasonic Holdings Corp.
    • Qualcomm Inc.
    • Quanergy Systems Inc.
    • SmartRay GmbH
    • Sony Group Corp.
    • STMicroelectronics International NV
    • TKH Group NV
    • Xovis AG
    • Analog Devices Inc.
    • OEM AUTOMATIC UAB

    Qualitative and quantitative analysis of companies has been conducted to help clients understand the wider business environment as well as the strengths and weaknesses of key industry players. Data is qualitatively analyzed to categorize companies as pure play, category-focused, industry-focused, and diversified; it is quantitatively analyzed to categorize companies as dominant, leading, strong, tentative, and weak.

    Recent Development and News in 3D Sensors Market

    • In August 2024, Sony Corporation, a leading electronics manufacturer, announced the launch of its latest 3D Time-of-Flight (ToF) sensor, the IMX556, offering higher resolution and improved accuracy compared to its predecessor (Sony Press Release, 2024). This sensor's advanced capabilities are expected to boost the adoption of 3D sensing technology in various applications, including augmented reality (AR) and automotive industries.
    • In November 2024, Intel Corporation and Microsoft Corporation announced a strategic partnership to integrate Intel's RealSense LiDAR technology into Microsoft's HoloLens 3 AR headset (Intel Press Release, 2024). This collaboration aims to enhance the HoloLens 3's capabilities, enabling more accurate spatial mapping and improved object recognition, making it a more powerful tool for professionals in industries like engineering and architecture.
    • In February 2025, STMicroelectronics, a global semiconductor leader, completed the acquisition of Sensirion's 3D sensor business for approximately €300 million (STMicroelectronics Press Release, 2025). This acquisition significantly strengthens STMicroelectronics' position in the 3D sensor market, providing access to Sensirion's advanced ToF sensor technology and expanding their customer base.
    • In May 2025, Apple Inc. Unveiled its latest iPhone models, featuring a new LiDAR Scanner, which utilizes a 3D sensor to capture depth information (Apple Press Release, 2025). This addition to Apple's flagship devices is expected to revolutionize AR experiences, improving the accuracy and functionality of AR applications, and potentially paving the way for new use cases in various industries.

    Dive into Technavio’s robust research methodology, blending expert interviews, extensive data synthesis, and validated models for unparalleled 3D Sensors Market insights. See full methodology.

    Market Scope

    Report Coverage

    Details

    Page number

    181

    Base year

    2023

    Historic period

    2018-2022

    Forecast period

    2024-2028

    Growth momentum & CAGR

    Accelerate at a CAGR of 18.69%

    Market growth 2024-2028

    USD 5148.49 million

    Market structure

    Fragmented

    YoY growth 2023-2024(%)

    16.99

    Key countries

    US, Canada, Germany, UK, Italy, France, China, India, Japan, Brazil, Egypt, UAE, Oman, Argentina, KSA, UAE, Brazil, and Rest of World (ROW)

    Competitive landscape

    Leading Companies, Market Positioning of Companies, Competitive Strategies, and Industry Risks

    Request Free Sample

    Why Choose Technavio for 3D Sensors Market Insights?

    "Leverage Technavio's unparalleled research methodology and expert analysis for accurate, actionable market intelligence."

    The market is experiencing significant growth due to the increasing demand for high-precision 3d surface reconstruction and real-time 3d object tracking applications. Advanced computer vision algorithms for 3d data processing and efficient point cloud processing techniques are enabling robust 3d model reconstruction from noisy data. The integration of multiple 3d sensors for complete coverage is becoming increasingly important for businesses seeking comprehensive data acquisition. In the realm of cost-effective solutions, low-cost high-resolution 3d imaging solutions are gaining traction, offering a more accessible entry point for businesses looking to implement 3d sensing technologies. The development of real-time 3d gesture recognition and applications of 3d depth sensing in robotics are further expanding the market's reach. 3d sensor data visualization and analysis tools, machine learning for 3d object classification, and deep learning models for 3d scene understanding are crucial components of the market, enhancing operational efficiency and improving compliance with data-driven business functions. The integration of machine learning and deep learning models is streamlining data processing and analysis, offering a 50% reduction in processing time compared to traditional methods. Innovative 3d sensing technologies, such as high-speed 3d data acquisition systems and accurate 3d measurement using structured light, are pushing the boundaries of what is possible in terms of data collection and analysis. The market is also witnessing continuous advancements in 3d sensor calibration methods for improved accuracy and 3d sensor fusion and data processing techniques for more comprehensive data analysis. The 3d model reconstruction for augmented reality applications is another significant growth area, offering businesses the ability to create immersive experiences for their customers. The market is expected to continue its robust growth, with a focus on improving the accuracy of 3d depth cameras and developing advanced 3d image processing and analysis techniques.

    What are the Key Data Covered in this 3D Sensors Market Research and Growth Report?

    • What is the expected growth of the 3D Sensors Market between 2024 and 2028?

      • USD 5.15 billion, at a CAGR of 18.69%

    • What segmentation does the market report cover?

      • The report is segmented by Application (Industrial/commercial, Automotive, Consumer electronics, and Others), Connectivity (Wireless and Wired), Geography (North America, APAC, Europe, South America, and Middle East and Africa), Technology (Stereoscopic Vision, Structured Light, Time-of-Flight (ToF), Ultrasound, and Other Technologies), Type (Image Sensor, Position Sensor, Acoustic Sensor, Accelerometer, and Other Sensors), and End-User (Automotive, Consumer Electronics, Industrial Automation, Healthcare, Aerospace & Defense, and Others)

    • Which regions are analyzed in the report?

      • North America, APAC, Europe, South America, and Middle East and Africa

    • What are the key growth drivers and market challenges?

      • Use of 3D sensors in security and surveillance systems, Accuracy and calibration issues during sensor fusion

    • Who are the major players in the 3D Sensors Market?

      • ams OSRAM AG, Broadcom Inc., FUJIFILM Corp., Himax Technologies Inc., ifm electronic gmbh, Infineon Technologies AG, Intel Corp., Lumentum Holdings Inc., Melexis NV, OmniVision Technologies Inc., Ouster Inc., Panasonic Holdings Corp., Qualcomm Inc., Quanergy Systems Inc., SmartRay GmbH, Sony Group Corp., STMicroelectronics International NV, TKH Group NV, Xovis AG, Analog Devices Inc., and OEM AUTOMATIC UAB

    We can help! Our analysts can customize this 3d sensors market research report to meet your requirements.

    Get in touch

    1 Executive Summary

    • 1.1 Market overview
      • Exhibit 01: Executive Summary – Chart on Market Overview
      • Exhibit 02: Executive Summary – Data Table on Market Overview
      • Exhibit 03: Executive Summary – Chart on Global Market Characteristics
      • Exhibit 04: Executive Summary – Chart on Market by Geography
      • Exhibit 05: Executive Summary – Chart on Market Segmentation by Application
      • Exhibit 06: Executive Summary – Chart on Market Segmentation by Connectivity
      • Exhibit 07: Executive Summary – Chart on Incremental Growth
      • Exhibit 08: Executive Summary – Data Table on Incremental Growth
      • Exhibit 09: Executive Summary – Chart on Vendor Market Positioning

    2 Market Landscape

    • 2.1 Market ecosystem
      • Exhibit 10: Parent market
      • Exhibit 11: Market Characteristics

    3 Market Sizing

    • 3.1 Market definition
      • Exhibit 12: Offerings of vendors included in the market definition
    • 3.2 Market segment analysis
      • Exhibit 13: Market segments
    • 3.3 Market size 2023
      • 3.4 Market outlook: Forecast for 2023-2028
        • Exhibit 14: Chart on Global - Market size and forecast 2023-2028 ($ million)
        • Exhibit 15: Data Table on Global - Market size and forecast 2023-2028 ($ million)
        • Exhibit 16: Chart on Global Market: Year-over-year growth 2023-2028 (%)
        • Exhibit 17: Data Table on Global Market: Year-over-year growth 2023-2028 (%)

      4 Historic Market Size

      • 4.1 Global 3D sensors market 2018 - 2022
        • Exhibit 18: Historic Market Size – Data Table on global 3d sensors market 2018 - 2022 ($ million)
      • 4.2 Application Segment Analysis 2018 - 2022
        • Exhibit 19: Historic Market Size – Application Segment 2018 - 2022 ($ million)
      • 4.3 Connectivity Segment Analysis 2018 - 2022
        • Exhibit 20: Historic Market Size – Connectivity Segment 2018 - 2022 ($ million)
      • 4.4 Geography Segment Analysis 2018 - 2022
        • Exhibit 21: Historic Market Size – Geography Segment 2018 - 2022 ($ million)
      • 4.5 Country Segment Analysis 2018 - 2022
        • Exhibit 22: Historic Market Size – Country Segment 2018 - 2022 ($ million)

      5 Five Forces Analysis

      • 5.1 Five forces summary
        • Exhibit 23: Five forces analysis - Comparison between 2023 and 2028
      • 5.2 Bargaining power of buyers
        • Exhibit 24: Chart on Bargaining power of buyers – Impact of key factors 2023 and 2028
      • 5.3 Bargaining power of suppliers
        • Exhibit 25: Bargaining power of suppliers – Impact of key factors in 2023 and 2028
      • 5.4 Threat of new entrants
        • Exhibit 26: Threat of new entrants – Impact of key factors in 2023 and 2028
      • 5.5 Threat of substitutes
        • Exhibit 27: Threat of substitutes – Impact of key factors in 2023 and 2028
      • 5.6 Threat of rivalry
        • Exhibit 28: Threat of rivalry – Impact of key factors in 2023 and 2028
      • 5.7 Market condition
        • Exhibit 29: Chart on Market condition - Five forces 2023 and 2028

      6 Market Segmentation by Application

      • 6.1 Market segments
        • Chart on Application - Market share (2023-2028) (%)
        • Data Table on Application - Market share (2023-2028) (%)
      • 6.2 Comparison by Application
        • Chart on Comparison by Application
        • Data Table on Comparison by Application
      • 6.3 Industrial/commercial - Market size and forecast (2023-2028)
        • Chart on Industrial/commercial - Market size and forecast (2023-2028) ($ million)
        • Data Table on Industrial/commercial - Market size and forecast (2023-2028) ($ million)
        • Chart on Industrial/commercial - Year-over-year growth (2023-2028) (%)
        • Data Table on Industrial/commercial - Year-over-year growth (2023-2028) (%)
      • 6.4 Automotive - Market size and forecast (2023-2028)
        • Chart on Automotive - Market size and forecast (2023-2028) ($ million)
        • Data Table on Automotive - Market size and forecast (2023-2028) ($ million)
        • Chart on Automotive - Year-over-year growth (2023-2028) (%)
        • Data Table on Automotive - Year-over-year growth (2023-2028) (%)
      • 6.5 Consumer electronics - Market size and forecast (2023-2028)
        • Chart on Consumer electronics - Market size and forecast (2023-2028) ($ million)
        • Data Table on Consumer electronics - Market size and forecast (2023-2028) ($ million)
        • Chart on Consumer electronics - Year-over-year growth (2023-2028) (%)
        • Data Table on Consumer electronics - Year-over-year growth (2023-2028) (%)
      • 6.6 Others - Market size and forecast (2023-2028)
        • Chart on Others - Market size and forecast (2023-2028) ($ million)
        • Data Table on Others - Market size and forecast (2023-2028) ($ million)
        • Chart on Others - Year-over-year growth (2023-2028) (%)
        • Data Table on Others - Year-over-year growth (2023-2028) (%)
      • 6.7 Market opportunity by Application
        • Market opportunity by Application ($ million)
        • Data Table on Market opportunity by Application ($ million)

      7 Market Segmentation by Connectivity

      • 7.1 Market segments
        • Chart on Connectivity - Market share (2023-2028) (%)
        • Data Table on Connectivity - Market share (2023-2028) (%)
      • 7.2 Comparison by Connectivity
        • Chart on Comparison by Connectivity
        • Data Table on Comparison by Connectivity
      • 7.3 Wireless - Market size and forecast (2023-2028)
        • Chart on Wireless - Market size and forecast (2023-2028) ($ million)
        • Data Table on Wireless - Market size and forecast (2023-2028) ($ million)
        • Chart on Wireless - Year-over-year growth (2023-2028) (%)
        • Data Table on Wireless - Year-over-year growth (2023-2028) (%)
      • 7.4 Wired - Market size and forecast (2023-2028)
        • Chart on Wired - Market size and forecast (2023-2028) ($ million)
        • Data Table on Wired - Market size and forecast (2023-2028) ($ million)
        • Chart on Wired - Year-over-year growth (2023-2028) (%)
        • Data Table on Wired - Year-over-year growth (2023-2028) (%)
      • 7.5 Market opportunity by Connectivity
        • Market opportunity by Connectivity ($ million)
        • Data Table on Market opportunity by Connectivity ($ million)

      8 Market Segmentation by Technology

      • 8.1 Market segments
        • Chart on Technology - Market share (2023-2028) (%)
        • Data Table on Technology - Market share (2023-2028) (%)
      • 8.2 Comparison by Technology
        • Chart on Comparison by Technology
        • Data Table on Comparison by Technology
      • 8.3 Stereoscopic Vision - Market size and forecast (2023-2028)
        • Chart on Stereoscopic Vision - Market size and forecast (2023-2028) ($ million)
        • Data Table on Stereoscopic Vision - Market size and forecast (2023-2028) ($ million)
        • Chart on Stereoscopic Vision - Year-over-year growth (2023-2028) (%)
        • Data Table on Stereoscopic Vision - Year-over-year growth (2023-2028) (%)
      • 8.4 Structured Light - Market size and forecast (2023-2028)
        • Chart on Structured Light - Market size and forecast (2023-2028) ($ million)
        • Data Table on Structured Light - Market size and forecast (2023-2028) ($ million)
        • Chart on Structured Light - Year-over-year growth (2023-2028) (%)
        • Data Table on Structured Light - Year-over-year growth (2023-2028) (%)
      • 8.5 Time-of-Flight (ToF) - Market size and forecast (2023-2028)
        • Chart on Time-of-Flight (ToF) - Market size and forecast (2023-2028) ($ million)
        • Data Table on Time-of-Flight (ToF) - Market size and forecast (2023-2028) ($ million)
        • Chart on Time-of-Flight (ToF) - Year-over-year growth (2023-2028) (%)
        • Data Table on Time-of-Flight (ToF) - Year-over-year growth (2023-2028) (%)
      • 8.6 Ultrasound - Market size and forecast (2023-2028)
        • Chart on Ultrasound - Market size and forecast (2023-2028) ($ million)
        • Data Table on Ultrasound - Market size and forecast (2023-2028) ($ million)
        • Chart on Ultrasound - Year-over-year growth (2023-2028) (%)
        • Data Table on Ultrasound - Year-over-year growth (2023-2028) (%)
      • 8.7 Other Technologies - Market size and forecast (2023-2028)
        • Chart on Other Technologies - Market size and forecast (2023-2028) ($ million)
        • Data Table on Other Technologies - Market size and forecast (2023-2028) ($ million)
        • Chart on Other Technologies - Year-over-year growth (2023-2028) (%)
        • Data Table on Other Technologies - Year-over-year growth (2023-2028) (%)
      • 8.8 Market opportunity by Technology
        • Market opportunity by Technology ($ million)
        • Data Table on Market opportunity by Technology ($ million)

      9 Market Segmentation by Type

      • 9.1 Market segments
        • Chart on Type - Market share (2023-2028) (%)
        • Data Table on Type - Market share (2023-2028) (%)
      • 9.2 Comparison by Type
        • Chart on Comparison by Type
        • Data Table on Comparison by Type
      • 9.3 Image Sensor - Market size and forecast (2023-2028)
        • Chart on Image Sensor - Market size and forecast (2023-2028) ($ million)
        • Data Table on Image Sensor - Market size and forecast (2023-2028) ($ million)
        • Chart on Image Sensor - Year-over-year growth (2023-2028) (%)
        • Data Table on Image Sensor - Year-over-year growth (2023-2028) (%)
      • 9.4 Position Sensor - Market size and forecast (2023-2028)
        • Chart on Position Sensor - Market size and forecast (2023-2028) ($ million)
        • Data Table on Position Sensor - Market size and forecast (2023-2028) ($ million)
        • Chart on Position Sensor - Year-over-year growth (2023-2028) (%)
        • Data Table on Position Sensor - Year-over-year growth (2023-2028) (%)
      • 9.5 Acoustic Sensor - Market size and forecast (2023-2028)
        • Chart on Acoustic Sensor - Market size and forecast (2023-2028) ($ million)
        • Data Table on Acoustic Sensor - Market size and forecast (2023-2028) ($ million)
        • Chart on Acoustic Sensor - Year-over-year growth (2023-2028) (%)
        • Data Table on Acoustic Sensor - Year-over-year growth (2023-2028) (%)
      • 9.6 Accelerometer - Market size and forecast (2023-2028)
        • Chart on Accelerometer - Market size and forecast (2023-2028) ($ million)
        • Data Table on Accelerometer - Market size and forecast (2023-2028) ($ million)
        • Chart on Accelerometer - Year-over-year growth (2023-2028) (%)
        • Data Table on Accelerometer - Year-over-year growth (2023-2028) (%)
      • 9.7 Other Sensors - Market size and forecast (2023-2028)
        • Chart on Other Sensors - Market size and forecast (2023-2028) ($ million)
        • Data Table on Other Sensors - Market size and forecast (2023-2028) ($ million)
        • Chart on Other Sensors - Year-over-year growth (2023-2028) (%)
        • Data Table on Other Sensors - Year-over-year growth (2023-2028) (%)
      • 9.8 Market opportunity by Type
        • Market opportunity by Type ($ million)
        • Data Table on Market opportunity by Type ($ million)

      10 Market Segmentation by End-User

      • 10.1 Market segments
        • Chart on End-User - Market share (2023-2028) (%)
        • Data Table on End-User - Market share (2023-2028) (%)
      • 10.2 Comparison by End-User
        • Chart on Comparison by End-User
        • Data Table on Comparison by End-User
      • 10.3 Automotive - Market size and forecast (2023-2028)
        • Chart on Automotive - Market size and forecast (2023-2028) ($ million)
        • Data Table on Automotive - Market size and forecast (2023-2028) ($ million)
        • Chart on Automotive - Year-over-year growth (2023-2028) (%)
        • Data Table on Automotive - Year-over-year growth (2023-2028) (%)
      • 10.4 Consumer Electronics - Market size and forecast (2023-2028)
        • Chart on Consumer Electronics - Market size and forecast (2023-2028) ($ million)
        • Data Table on Consumer Electronics - Market size and forecast (2023-2028) ($ million)
        • Chart on Consumer Electronics - Year-over-year growth (2023-2028) (%)
        • Data Table on Consumer Electronics - Year-over-year growth (2023-2028) (%)
      • 10.5 Industrial Automation - Market size and forecast (2023-2028)
        • Chart on Industrial Automation - Market size and forecast (2023-2028) ($ million)
        • Data Table on Industrial Automation - Market size and forecast (2023-2028) ($ million)
        • Chart on Industrial Automation - Year-over-year growth (2023-2028) (%)
        • Data Table on Industrial Automation - Year-over-year growth (2023-2028) (%)
      • 10.6 Healthcare - Market size and forecast (2023-2028)
        • Chart on Healthcare - Market size and forecast (2023-2028) ($ million)
        • Data Table on Healthcare - Market size and forecast (2023-2028) ($ million)
        • Chart on Healthcare - Year-over-year growth (2023-2028) (%)
        • Data Table on Healthcare - Year-over-year growth (2023-2028) (%)
      • 10.7 Aerospace & Defense - Market size and forecast (2023-2028)
        • Chart on Aerospace & Defense - Market size and forecast (2023-2028) ($ million)
        • Data Table on Aerospace & Defense - Market size and forecast (2023-2028) ($ million)
        • Chart on Aerospace & Defense - Year-over-year growth (2023-2028) (%)
        • Data Table on Aerospace & Defense - Year-over-year growth (2023-2028) (%)
      • 10.8 Others - Market size and forecast (2023-2028)
        • Chart on Others - Market size and forecast (2023-2028) ($ million)
        • Data Table on Others - Market size and forecast (2023-2028) ($ million)
        • Chart on Others - Year-over-year growth (2023-2028) (%)
        • Data Table on Others - Year-over-year growth (2023-2028) (%)
      • 10.9 Market opportunity by End-User
        • Market opportunity by End-User ($ million)
        • Data Table on Market opportunity by End-User ($ million)

      8 Customer Landscape

      • 8.1 Customer landscape overview
        • Exhibit 66: Analysis of price sensitivity, lifecycle, customer purchase basket, adoption rates, and purchase criteria

      9 Geographic Landscape

      • 9.1 Geographic segmentation
        • Exhibit 67: Chart on Market share by geography 2023-2028 (%)
        • Exhibit 68: Data Table on Market share by geography 2023-2028 (%)
      • 9.2 Geographic comparison
        • Exhibit 69: Chart on Geographic comparison
        • Exhibit 70: Data Table on Geographic comparison
      • 9.3 North America - Market size and forecast 2023-2028
        • Exhibit 71: Chart on North America - Market size and forecast 2023-2028 ($ million)
        • Exhibit 72: Data Table on North America - Market size and forecast 2023-2028 ($ million)
        • Exhibit 73: Chart on North America - Year-over-year growth 2023-2028 (%)
        • Exhibit 74: Data Table on North America - Year-over-year growth 2023-2028 (%)
      • 9.4 APAC - Market size and forecast 2023-2028
        • Exhibit 75: Chart on APAC - Market size and forecast 2023-2028 ($ million)
        • Exhibit 76: Data Table on APAC - Market size and forecast 2023-2028 ($ million)
        • Exhibit 77: Chart on APAC - Year-over-year growth 2023-2028 (%)
        • Exhibit 78: Data Table on APAC - Year-over-year growth 2023-2028 (%)
      • 9.5 Europe - Market size and forecast 2023-2028
        • Exhibit 79: Chart on Europe - Market size and forecast 2023-2028 ($ million)
        • Exhibit 80: Data Table on Europe - Market size and forecast 2023-2028 ($ million)
        • Exhibit 81: Chart on Europe - Year-over-year growth 2023-2028 (%)
        • Exhibit 82: Data Table on Europe - Year-over-year growth 2023-2028 (%)
      • 9.6 South America - Market size and forecast 2023-2028
        • Exhibit 83: Chart on South America - Market size and forecast 2023-2028 ($ million)
        • Exhibit 84: Data Table on South America - Market size and forecast 2023-2028 ($ million)
        • Exhibit 85: Chart on South America - Year-over-year growth 2023-2028 (%)
        • Exhibit 86: Data Table on South America - Year-over-year growth 2023-2028 (%)
      • 9.7 Middle East and Africa - Market size and forecast 2023-2028
        • Exhibit 87: Chart on Middle East and Africa - Market size and forecast 2023-2028 ($ million)
        • Exhibit 88: Data Table on Middle East and Africa - Market size and forecast 2023-2028 ($ million)
        • Exhibit 89: Chart on Middle East and Africa - Year-over-year growth 2023-2028 (%)
        • Exhibit 90: Data Table on Middle East and Africa - Year-over-year growth 2023-2028 (%)
      • 9.8 US - Market size and forecast 2023-2028
        • Exhibit 91: Chart on US - Market size and forecast 2023-2028 ($ million)
        • Exhibit 92: Data Table on US - Market size and forecast 2023-2028 ($ million)
        • Exhibit 93: Chart on US - Year-over-year growth 2023-2028 (%)
        • Exhibit 94: Data Table on US - Year-over-year growth 2023-2028 (%)
      • 9.9 China - Market size and forecast 2023-2028
        • Exhibit 95: Chart on China - Market size and forecast 2023-2028 ($ million)
        • Exhibit 96: Data Table on China - Market size and forecast 2023-2028 ($ million)
        • Exhibit 97: Chart on China - Year-over-year growth 2023-2028 (%)
        • Exhibit 98: Data Table on China - Year-over-year growth 2023-2028 (%)
      • 9.10 Japan - Market size and forecast 2023-2028
        • Exhibit 99: Chart on Japan - Market size and forecast 2023-2028 ($ million)
        • Exhibit 100: Data Table on Japan - Market size and forecast 2023-2028 ($ million)
        • Exhibit 101: Chart on Japan - Year-over-year growth 2023-2028 (%)
        • Exhibit 102: Data Table on Japan - Year-over-year growth 2023-2028 (%)
      • 9.11 South Korea - Market size and forecast 2023-2028
        • Exhibit 103: Chart on South Korea - Market size and forecast 2023-2028 ($ million)
        • Exhibit 104: Data Table on South Korea - Market size and forecast 2023-2028 ($ million)
        • Exhibit 105: Chart on South Korea - Year-over-year growth 2023-2028 (%)
        • Exhibit 106: Data Table on South Korea - Year-over-year growth 2023-2028 (%)
      • 9.12 Germany - Market size and forecast 2023-2028
        • Exhibit 107: Chart on Germany - Market size and forecast 2023-2028 ($ million)
        • Exhibit 108: Data Table on Germany - Market size and forecast 2023-2028 ($ million)
        • Exhibit 109: Chart on Germany - Year-over-year growth 2023-2028 (%)
        • Exhibit 110: Data Table on Germany - Year-over-year growth 2023-2028 (%)
      • 9.13 Market opportunity by geography
        • Exhibit 111: Market opportunity by geography ($ million)
        • Exhibit 112: Data Tables on Market opportunity by geography ($ million)
      • 12.14 Canada - Market size and forecast (2023-2028)
        • Chart on Canada - Market size and forecast (2023-2028) ($ million)
        • Data Table on Canada - Market size and forecast (2023-2028) ($ million)
        • Chart on Canada - Year-over-year growth (2023-2028) (%)
        • Data Table on Canada - Year-over-year growth (2023-2028) (%)
      • 12.15 UK - Market size and forecast (2023-2028)
        • Chart on UK - Market size and forecast (2023-2028) ($ million)
        • Data Table on UK - Market size and forecast (2023-2028) ($ million)
        • Chart on UK - Year-over-year growth (2023-2028) (%)
        • Data Table on UK - Year-over-year growth (2023-2028) (%)
      • 12.16 Italy - Market size and forecast (2023-2028)
        • Chart on Italy - Market size and forecast (2023-2028) ($ million)
        • Data Table on Italy - Market size and forecast (2023-2028) ($ million)
        • Chart on Italy - Year-over-year growth (2023-2028) (%)
        • Data Table on Italy - Year-over-year growth (2023-2028) (%)
      • 12.17 France - Market size and forecast (2023-2028)
        • Chart on France - Market size and forecast (2023-2028) ($ million)
        • Data Table on France - Market size and forecast (2023-2028) ($ million)
        • Chart on France - Year-over-year growth (2023-2028) (%)
        • Data Table on France - Year-over-year growth (2023-2028) (%)
      • 12.18 India - Market size and forecast (2023-2028)
        • Chart on India - Market size and forecast (2023-2028) ($ million)
        • Data Table on India - Market size and forecast (2023-2028) ($ million)
        • Chart on India - Year-over-year growth (2023-2028) (%)
        • Data Table on India - Year-over-year growth (2023-2028) (%)
      • 12.19 Brazil - Market size and forecast (2023-2028)
        • Chart on Brazil - Market size and forecast (2023-2028) ($ million)
        • Data Table on Brazil - Market size and forecast (2023-2028) ($ million)
        • Chart on Brazil - Year-over-year growth (2023-2028) (%)
        • Data Table on Brazil - Year-over-year growth (2023-2028) (%)
      • 12.20 Egypt - Market size and forecast (2023-2028)
        • Chart on Egypt - Market size and forecast (2023-2028) ($ million)
        • Data Table on Egypt - Market size and forecast (2023-2028) ($ million)
        • Chart on Egypt - Year-over-year growth (2023-2028) (%)
        • Data Table on Egypt - Year-over-year growth (2023-2028) (%)
      • 12.21 UAE - Market size and forecast (2023-2028)
        • Chart on UAE - Market size and forecast (2023-2028) ($ million)
        • Data Table on UAE - Market size and forecast (2023-2028) ($ million)
        • Chart on UAE - Year-over-year growth (2023-2028) (%)
        • Data Table on UAE - Year-over-year growth (2023-2028) (%)
      • 12.22 Oman - Market size and forecast (2023-2028)
        • Chart on Oman - Market size and forecast (2023-2028) ($ million)
        • Data Table on Oman - Market size and forecast (2023-2028) ($ million)
        • Chart on Oman - Year-over-year growth (2023-2028) (%)
        • Data Table on Oman - Year-over-year growth (2023-2028) (%)
      • 12.23 Argentina - Market size and forecast (2023-2028)
        • Chart on Argentina - Market size and forecast (2023-2028) ($ million)
        • Data Table on Argentina - Market size and forecast (2023-2028) ($ million)
        • Chart on Argentina - Year-over-year growth (2023-2028) (%)
        • Data Table on Argentina - Year-over-year growth (2023-2028) (%)
      • 12.24 KSA - Market size and forecast (2023-2028)
        • Chart on KSA - Market size and forecast (2023-2028) ($ million)
        • Data Table on KSA - Market size and forecast (2023-2028) ($ million)
        • Chart on KSA - Year-over-year growth (2023-2028) (%)
        • Data Table on KSA - Year-over-year growth (2023-2028) (%)
      • 12.25 Rest of World (ROW) - Market size and forecast (2023-2028)
        • Chart on Rest of World (ROW) - Market size and forecast (2023-2028) ($ million)
        • Data Table on Rest of World (ROW) - Market size and forecast (2023-2028) ($ million)
        • Chart on Rest of World (ROW) - Year-over-year growth (2023-2028) (%)
        • Data Table on Rest of World (ROW) - Year-over-year growth (2023-2028) (%)

      10 Drivers, Challenges, and Trends

      • 10.1 Market drivers
        • 10.2 Market challenges
          • 10.3 Impact of drivers and challenges
            • Exhibit 113: Impact of drivers and challenges in 2023 and 2028
          • 10.4 Market trends

            11 Vendor Landscape

            • 11.1 Overview
              • 11.2 Vendor landscape
                • Exhibit 114: Overview on Criticality of inputs and Factors of differentiation
              • 11.3 Landscape disruption
                • Exhibit 115: Overview on factors of disruption
              • 11.4 Industry risks
                • Exhibit 116: Impact of key risks on business

              12 Vendor Analysis

              • 12.1 Vendors covered
                • Exhibit 117: Vendors covered
              • 12.2 Market positioning of vendors
                • Exhibit 118: Matrix on vendor position and classification
              • 12.3 ams OSRAM AG
                • Exhibit 119: ams OSRAM AG - Overview
                • Exhibit 120: ams OSRAM AG - Product / Service
                • Exhibit 121: ams OSRAM AG - Key news
                • Exhibit 122: ams OSRAM AG - Key offerings
              • 12.4 Analog Devices Inc.
                • Exhibit 123: Analog Devices Inc. - Overview
                • Exhibit 124: Analog Devices Inc. - Business segments
                • Exhibit 125: Analog Devices Inc. - Key news
                • Exhibit 126: Analog Devices Inc. - Key offerings
                • Exhibit 127: Analog Devices Inc. - Segment focus
              • 12.5 Broadcom Inc.
                • Exhibit 128: Broadcom Inc. - Overview
                • Exhibit 129: Broadcom Inc. - Business segments
                • Exhibit 130: Broadcom Inc. - Key news
                • Exhibit 131: Broadcom Inc. - Key offerings
                • Exhibit 132: Broadcom Inc. - Segment focus
              • 12.6 Himax Technologies Inc.
                • Exhibit 133: Himax Technologies Inc. - Overview
                • Exhibit 134: Himax Technologies Inc. - Business segments
                • Exhibit 135: Himax Technologies Inc. - Key offerings
                • Exhibit 136: Himax Technologies Inc. - Segment focus
              • 12.7 ifm electronic gmbh
                • Exhibit 137: ifm electronic gmbh - Overview
                • Exhibit 138: ifm electronic gmbh - Product / Service
                • Exhibit 139: ifm electronic gmbh - Key offerings
              • 12.8 Infineon Technologies AG
                • Exhibit 140: Infineon Technologies AG - Overview
                • Exhibit 141: Infineon Technologies AG - Business segments
                • Exhibit 142: Infineon Technologies AG - Key news
                • Exhibit 143: Infineon Technologies AG - Key offerings
                • Exhibit 144: Infineon Technologies AG - Segment focus
              • 12.9 Intel Corp.
                • Exhibit 145: Intel Corp. - Overview
                • Exhibit 146: Intel Corp. - Business segments
                • Exhibit 147: Intel Corp. - Key offerings
                • Exhibit 148: Intel Corp. - Segment focus
              • 12.10 Lumentum Holdings Inc.
                • Exhibit 149: Lumentum Holdings Inc. - Overview
                • Exhibit 150: Lumentum Holdings Inc. - Business segments
                • Exhibit 151: Lumentum Holdings Inc. - Key offerings
                • Exhibit 152: Lumentum Holdings Inc. - Segment focus
              • 12.11 OmniVision Technologies Inc.
                • Exhibit 153: OmniVision Technologies Inc. - Overview
                • Exhibit 154: OmniVision Technologies Inc. - Product / Service
                • Exhibit 155: OmniVision Technologies Inc. - Key offerings
              • 12.12 Ouster Inc.
                • Exhibit 156: Ouster Inc. - Overview
                • Exhibit 157: Ouster Inc. - Product / Service
                • Exhibit 158: Ouster Inc. - Key offerings
              • 12.13 Panasonic Holdings Corp.
                • Exhibit 159: Panasonic Holdings Corp. - Overview
                • Exhibit 160: Panasonic Holdings Corp. - Business segments
                • Exhibit 161: Panasonic Holdings Corp. - Key news
                • Exhibit 162: Panasonic Holdings Corp. - Key offerings
                • Exhibit 163: Panasonic Holdings Corp. - Segment focus
              • 12.14 Qualcomm Inc.
                • Exhibit 164: Qualcomm Inc. - Overview
                • Exhibit 165: Qualcomm Inc. - Business segments
                • Exhibit 166: Qualcomm Inc. - Key news
                • Exhibit 167: Qualcomm Inc. - Key offerings
                • Exhibit 168: Qualcomm Inc. - Segment focus
              • 12.15 Sony Group Corp.
                • Exhibit 169: Sony Group Corp. - Overview
                • Exhibit 170: Sony Group Corp. - Business segments
                • Exhibit 171: Sony Group Corp. - Key news
                • Exhibit 172: Sony Group Corp. - Key offerings
                • Exhibit 173: Sony Group Corp. - Segment focus
              • 12.16 STMicroelectronics International NV
                • Exhibit 174: STMicroelectronics International NV - Overview
                • Exhibit 175: STMicroelectronics International NV - Business segments
                • Exhibit 176: STMicroelectronics International NV - Key news
                • Exhibit 177: STMicroelectronics International NV - Key offerings
                • Exhibit 178: STMicroelectronics International NV - Segment focus
              • 12.17 TKH Group NV
                • Exhibit 179: TKH Group NV - Overview
                • Exhibit 180: TKH Group NV - Business segments
                • Exhibit 181: TKH Group NV - Key offerings
                • Exhibit 182: TKH Group NV - Segment focus

              13 Appendix

              • 13.1 Scope of the report
                • 13.2 Inclusions and exclusions checklist
                  • Exhibit 183: Inclusions checklist
                  • Exhibit 184: Exclusions checklist
                • 13.3 Currency conversion rates for US$
                  • Exhibit 185: Currency conversion rates for US$
                • 13.4 Research methodology
                  • Exhibit 186: Research methodology
                  • Exhibit 187: Validation techniques employed for market sizing
                  • Exhibit 188: Information sources
                • 13.5 List of abbreviations
                  • Exhibit 189: List of abbreviations

                Research Methodology

                Technavio presents a detailed picture of the market by way of study, synthesis, and summation of data from multiple sources. The analysts have presented the various facets of the market with a particular focus on identifying the key industry influencers. The data thus presented is comprehensive, reliable, and the result of extensive research, both primary and secondary.

                INFORMATION SOURCES

                Primary sources

                • Manufacturers and suppliers
                • Channel partners
                • Industry experts
                • Strategic decision makers

                Secondary sources

                • Industry journals and periodicals
                • Government data
                • Financial reports of key industry players
                • Historical data
                • Press releases

                DATA ANALYSIS

                Data Synthesis

                • Collation of data
                • Estimation of key figures
                • Analysis of derived insights

                Data Validation

                • Triangulation with data models
                • Reference against proprietary databases
                • Corroboration with industry experts

                REPORT WRITING

                Qualitative

                • Market drivers
                • Market challenges
                • Market trends
                • Five forces analysis

                Quantitative

                • Market size and forecast
                • Market segmentation
                • Geographical insights
                • Competitive landscape

                Interested in this report?

                Get your sample now to see our research methodology and insights!

                Download Now

                Frequently Asked Questions

                3D Sensors market growth will increase by $ 5148.49 mn during 2024-2028 .

                The 3D Sensors market is expected to grow at a CAGR of 18.69% during 2024-2028 .

                3D Sensors market is segmented by Application( Industrial/commercial, Automotive, Consumer electronics, Others) Connectivity( Wireless, Wired, Europe, South America, Middle East and Africa)

                ams OSRAM AG, Broadcom Inc., FUJIFILM Corp., Himax Technologies Inc., ifm electronic gmbh, Infineon Technologies AG, Intel Corp., Lumentum Holdings Inc., Melexis NV, OmniVision Technologies Inc., Ouster Inc., Panasonic Holdings Corp., Qualcomm Inc., Quanergy Systems Inc., SmartRay GmbH, Sony Group Corp., STMicroelectronics International NV, TKH Group NV, Xovis AG, Analog Devices Inc., OEM AUTOMATIC UAB are a few of the key vendors in the 3D Sensors market.

                North America will register the highest growth rate of 39% among the other regions. Therefore, the 3D Sensors market in North America is expected to garner significant business opportunities for the vendors during the forecast period.

                US, Canada, Germany, UK, Italy, France, China, India, Japan, Brazil, Egypt, UAE, Oman, Argentina, KSA, UAE, Brazil, Rest of World (ROW)

                • Use of 3D sensors in security and surveillance systemsThe increasing use of 3D sensors in security and surveillance systems is expected to drive the market in focus during the forecast period. The adoption of 3D sensors in electronic devices such as security cameras and closed-circuit television (CCTV) cameras is growing because of the increasing need for security. Cameras with 3D sensors can perform various functions such as 3D imaging is the driving factor this market.
                • position tracking is the driving factor this market.
                • depth sensing is the driving factor this market.
                • and gesture recognition. 3D sensors can provide real-time sensing and scanning of objects. Thus is the driving factor this market.
                • aerospace and defense personnel are increasingly using security and surveillance systems that incorporate 3D cameras to enhance security. In addition is the driving factor this market.
                • major OEMs of 3D sensors have increased their focus on the development and introduction of 3D sensors and 3D sensor-based devices that can be used in security and surveillance systems. For instance is the driving factor this market.
                • in January 2022 is the driving factor this market.
                • Quanergy Systems launched a LiDAR-based 3D IoT for smart cities. The company designed the solution for indoor mapping is the driving factor this market.
                • highway speeding recognition is the driving factor this market.
                • monitoring of secure locations is the driving factor this market.
                • and tracking animals. Similarly is the driving factor this market.
                • in February 2021 is the driving factor this market.
                • the automotive LiDAR stack direct time of flight department sensor developed by Sony uses single photonic avalanche diode pixels. The increasing use of drones or UAV systems for navigation and surveillance is also contributing to the growth of the market in focus. Drones or UAVs are uncrewed aircraft that can navigate autonomously. Drones are considered to be one of the most advanced devices in the field of aeronautics and have numerous applications. Some of these applications are listed below: Cargo systems (to deliver lightweight packages) Inspection of powerlines and grids Science and research (for documentation purposes) Surveying and mapping of geological sites Search and rescue operations Drones are increasingly becoming an integral part of several industries is the driving factor this market.
                • such as aerospace and defense is the driving factor this market.
                • industrial is the driving factor this market.
                • and retail (e-commerce). LiDAR or laser detection and ranging (LADAR) systems are used to operate drones. These systems use 3D sensor-enabled devices for developing 3D imaging of objects and surroundings. Major vendors have increased their focus on the development and introduction of 3D sensors is the driving factor this market.
                • especially for security and surveillance applications is the driving factor this market.
                • to capitalize on the market. Some of the vendors are working with technology providers to develop 3D sensor solutions. For instance is the driving factor this market.
                • in May 2022 is the driving factor this market.
                • LMI TECHNOLOGIES INC. announced the launch of industry-first smart 3D line confocal sensors. 3D sensors will enhance the inspection of challenging material structures is the driving factor this market.
                • including multi-layer is the driving factor this market.
                • transparent is the driving factor this market.
                • curved edge is the driving factor this market.
                • and next-generation on-sensor Industrial Internet of Things (IIoT) vision software. The vendors use their SLiM sensor solutions and AI processor and facial recognition algorithm to develop 3D sensing and AI-enabled security and surveillance solutions. Thus is the driving factor this market.
                • increasing the use of 3D sensors in security and surveillance systems is expected to foster the growth of the global 3D sensors market during the forecast period. is the driving factor this market.

                The 3D Sensors market vendors should focus on grabbing business opportunities from the Industrial/commercial segment as it accounted for the largest market share in the base year.