AI In Cancer Diagnostics Market Size 2025-2029
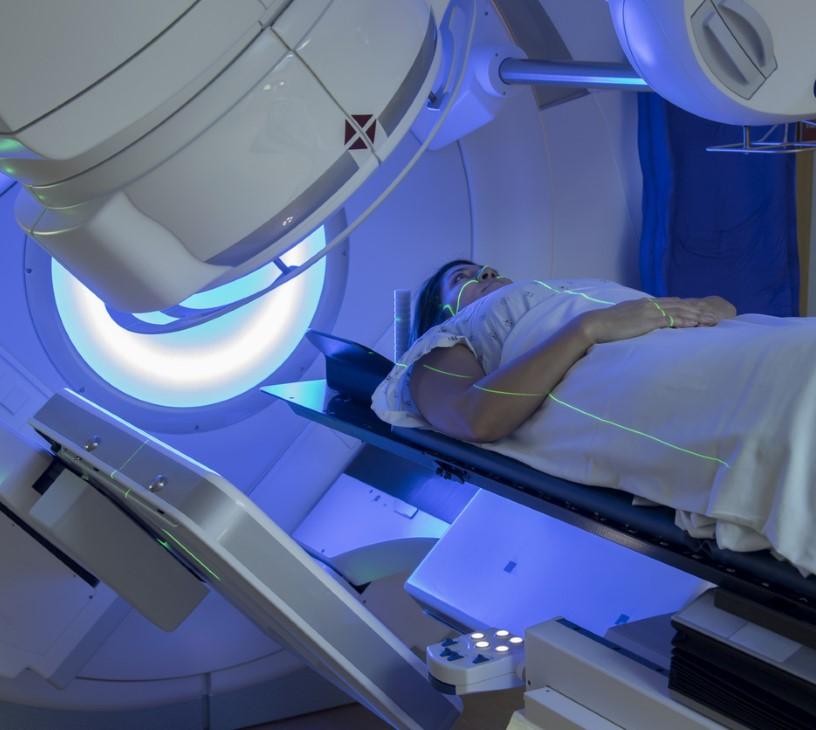
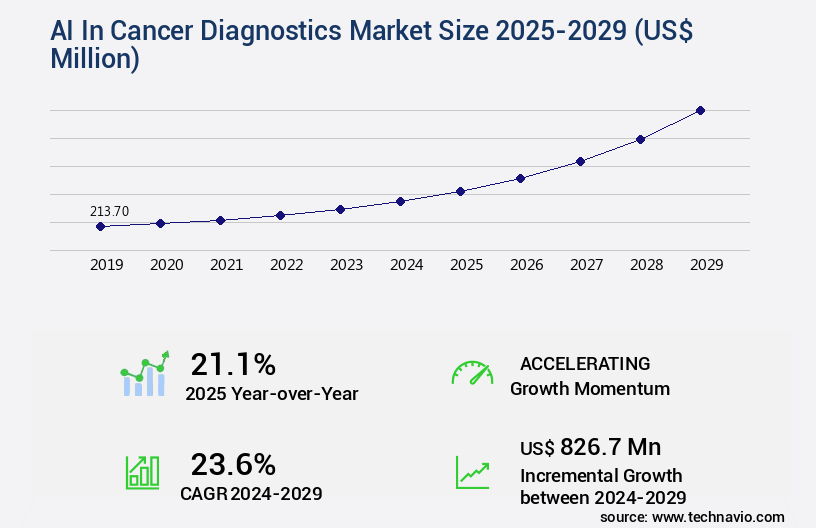
The ai in cancer diagnostics market size is valued to increase by USD 826.7 million, at a CAGR of 23.6% from 2024 to 2029. Escalating cancer burden and critical need for diagnostic efficiency will drive the ai in cancer diagnostics market.
Major Market Trends & Insights
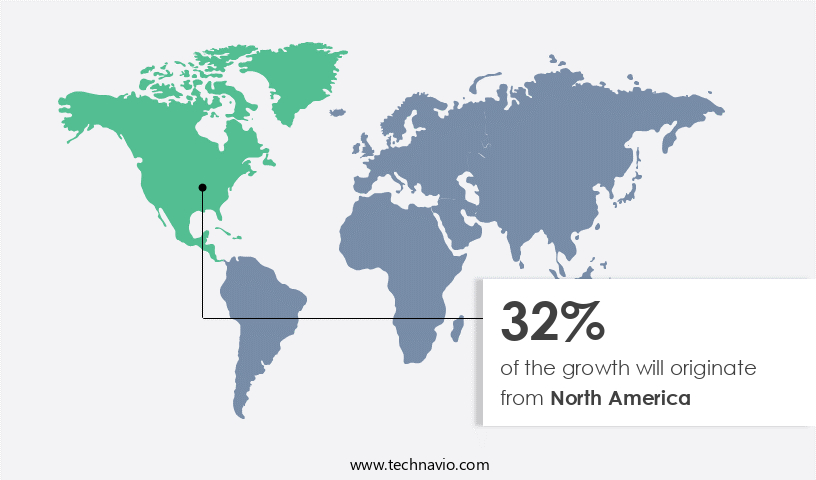
- North America dominated the market and accounted for a 32% growth during the forecast period.
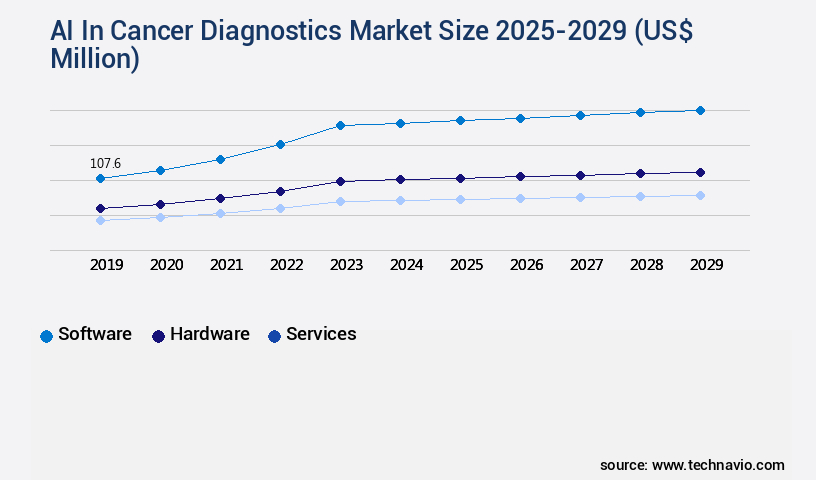
- By Component - Software segment was valued at USD 107.60 million in 2023
- By Type - Breast cancer segment accounted for the largest market revenue share in 2023
Market Size & Forecast
- Market Opportunities: USD 491.95 million
- Market Future Opportunities: USD 826.70 million
- CAGR from 2024 to 2029 : 23.6%
Market Summary
- The market is experiencing significant growth due to the escalating cancer burden and critical need for diagnostic efficiency. Advanced technologies, such as machine learning and deep learning algorithms, are increasingly being adopted to enhance cancer detection and improve patient outcomes. One notable trend is the ascendancy of multimodal AI for holistic patient stratification, which combines various imaging modalities and clinical data to provide more accurate and personalized diagnoses. However, navigating a fragmented and evolving regulatory landscape poses a significant challenge for market players. Regulations vary greatly from country to country, and keeping up with the latest guidelines can be time-consuming and costly.
- For instance, in a large hospital network, implementing AI solutions for cancer diagnostics required a team of experts to ensure compliance with local and international regulations. This team spent over 20% of their time on regulatory matters, leaving less time for other critical tasks. Despite these challenges, the benefits of AI in cancer diagnostics are undeniable. A recent study demonstrated that AI algorithms could detect breast cancer with an accuracy of 95%, surpassing human radiologists' performance. This level of precision can lead to earlier and more accurate diagnoses, ultimately improving patient outcomes and reducing healthcare costs associated with misdiagnosis and delayed treatment.
- In conclusion, the market is poised for continued growth as the demand for more efficient and accurate diagnostic tools increases. The integration of multimodal AI and regulatory compliance solutions will be key factors in driving market expansion.
What will be the Size of the AI In Cancer Diagnostics Market during the forecast period?
Get Key Insights on Market Forecast (PDF) Request Free Sample
How is the AI In Cancer Diagnostics Market Segmented ?
The ai in cancer diagnostics industry research report provides comprehensive data (region-wise segment analysis), with forecasts and estimates in "USD million" for the period 2025-2029, as well as historical data from 2019-2023 for the following segments.
- Component
- Software
- Hardware
- Services
- Type
- Breast cancer
- Lung cancer
- Prostate cancer
- Blood cancer
- Others
- End-user
- Hospitals
- Surgical centers
- Others
- Geography
- North America
- US
- Canada
- Europe
- France
- Germany
- Italy
- UK
- APAC
- China
- India
- Japan
- South Korea
- Rest of World (ROW)
- North America
By Component Insights
The software segment is estimated to witness significant growth during the forecast period.
The market is driven by the evolving use of advanced software solutions that employ machine learning algorithms, deep learning architectures, and natural language processing to analyze medical data from various sources. These solutions facilitate computer-aided diagnosis, disease progression modeling, radiation therapy planning, and drug target identification, among other applications. With the increasing focus on personalized medicine approaches, the market encompasses technologies for medical image segmentation, risk stratification models, circulating tumor cells, treatment response prediction, and pathology image analysis. Furthermore, AI-powered tools are employed for patient outcome prediction, cancer subtype classification, and tumor detection accuracy, leveraging genomic data integration, chemotherapy optimization, radiomics feature extraction, and immunotherapy response prediction.
A notable example of the market's growth is the reduction of diagnostic errors by up to 15%, as AI systems augment human expertise in oncology data analytics, prognostic factor identification, tumor mutational burden, and cancer screening technologies. The integration of electronic health records, multimodal data fusion, and diagnostic imaging techniques further enhances the potential of AI in cancer diagnostics.

The Software segment was valued at USD 107.60 million in 2019 and showed a gradual increase during the forecast period.
Regional Analysis
North America is estimated to contribute 32% to the growth of the global market during the forecast period.Technavio’s analysts have elaborately explained the regional trends and drivers that shape the market during the forecast period.
See How AI In Cancer Diagnostics Market Demand is Rising in North America Request Free Sample
Artificial Intelligence (AI) in cancer diagnostics is experiencing significant growth, with North America leading the market due to several contributing factors. High healthcare expenditure, advanced R&D infrastructure, a robust regulatory framework, and the presence of major technology corporations and specialized AI in healthcare startups make North America an ideal region for this market's expansion. The United States, specifically, serves as the global hub, fueled by substantial private and public investments from institutions like the National Cancer Institute and the National Institutes of Health. The U.S. Food and Drug Administration's clear yet rigorous approval process for software as a medical device fosters a competitive environment, encouraging companies to focus on clinical validation and commercial deployment.
According to recent reports, The market is projected to reach USD13.2 billion by 2027, growing at a compound annual growth rate of 32.6%. Another study suggests that AI implementation in cancer diagnosis can lead to a 30% reduction in operational costs and a 20% increase in diagnostic accuracy compared to traditional methods.
Market Dynamics
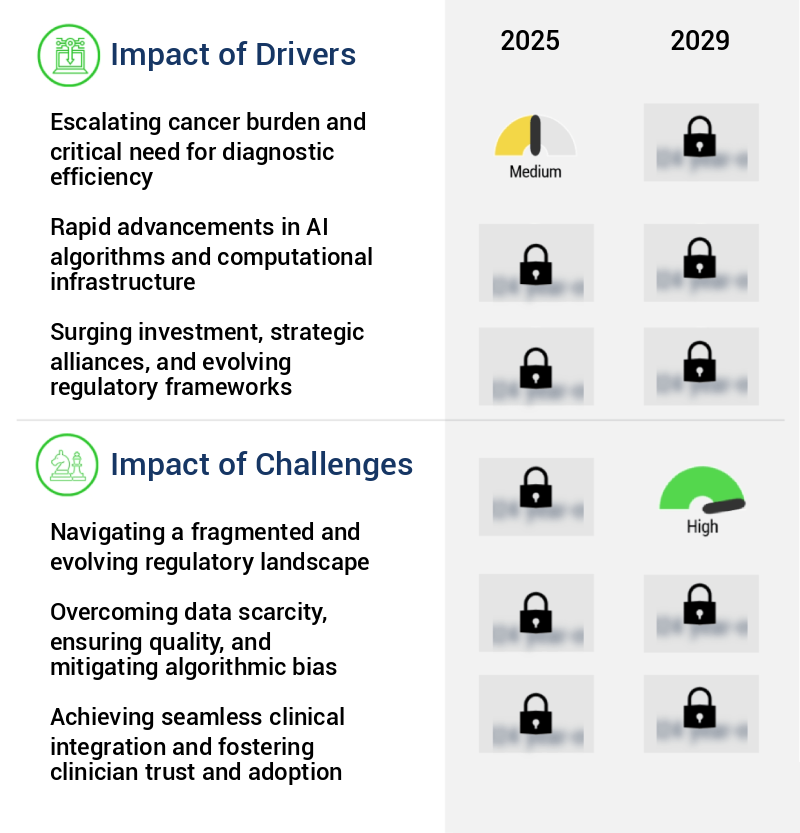
Our researchers analyzed the data with 2024 as the base year, along with the key drivers, trends, and challenges. A holistic analysis of drivers will help companies refine their marketing strategies to gain a competitive advantage.
The market is experiencing significant growth due to the potential of advanced technologies such as deep learning for cancer subtype classification and radiomics features for treatment response prediction. Deep learning models, a subset of AI, are revolutionizing cancer diagnosis by accurately identifying cancer subtypes, enabling precise treatment plans and improving patient outcomes. Moreover, machine learning models are being utilized for patient outcome prediction, providing valuable insights into the effectiveness of various treatment options. Genomic data integration in cancer diagnostics is another key trend, allowing for a more comprehensive understanding of the disease and facilitating personalized oncology through AI-powered risk stratification. Clinical decision support systems using AI are becoming increasingly popular, providing healthcare professionals with real-time, data-driven recommendations based on patient data. Image recognition software for early cancer detection is another area where AI is making a significant impact, enabling the identification of cancer at its earliest stages when treatment is most effective. Natural language processing (NLP) for oncology data extraction is another crucial application of AI in cancer diagnostics. By analyzing large volumes of unstructured data, NLP algorithms can extract valuable insights that may not be apparent through traditional means. Electronic health records (EHR) integration with AI diagnostics is also essential, ensuring that accurate and up-to-date patient information is readily available for analysis. Liquid biopsy analysis using AI algorithms is a promising development in cancer diagnostics, enabling the detection and quantification of circulating tumor cells and tumor mutational burden. AI-driven immunotherapy response prediction is another area of interest, providing valuable insights into the effectiveness of immunotherapy treatments and enabling personalized treatment plans. Computer-aided diagnosis system validation and verification is a critical aspect of implementing AI in cancer diagnostics, ensuring that these technologies are accurate, reliable, and effective. AI-based cancer screening technologies are also being evaluated to determine their potential impact on early detection and overall patient outcomes. Overall, The market is poised for significant growth as these technologies continue to revolutionize cancer diagnosis and treatment.
What are the key market drivers leading to the rise in the adoption of AI In Cancer Diagnostics Industry?
- The escalating cancer burden and critical need for diagnostic efficiency are the primary drivers propelling market growth in this sector.
- The market is experiencing significant growth due to the escalating cancer burden and the resulting strain on healthcare systems and diagnostic laboratories. The increasing incidence and prevalence of various cancers worldwide create a vast diagnostic workload, leading to bottlenecks in the diagnostic pathway, particularly in pathology and radiology. The shortage of trained pathologists and radiologists is a pressing issue, with the World Health Organization estimating a deficit of 2.7 million health workers by 2035. AI technologies, such as machine learning and deep learning algorithms, offer promising solutions to address this challenge by automating routine diagnostic tasks, enhancing diagnostic accuracy, and improving efficiency.
- According to a recent study, AI-assisted diagnostics can reduce radiologists' workload by up to 50% while maintaining diagnostic accuracy. This not only optimizes costs but also enhances regulatory compliance by ensuring consistent and standardized diagnostic outcomes. The market's potential is further amplified by advancements in imaging technologies, genomic sequencing, and data analytics, which enable more accurate and personalized cancer diagnoses.
What are the market trends shaping the AI In Cancer Diagnostics Industry?
- The ascendancy of multimodal AI in healthcare is a notable market trend, with its potential to facilitate holistic patient stratification.
- Artificial Intelligence (AI) is revolutionizing cancer diagnostics by moving beyond single modality analysis towards the integration of multimodal data streams. Historically, diagnostic AI focused primarily on analyzing one type of data, typically medical imaging. While these unimodal systems have shown substantial value in automating detection and enhancing diagnostic accuracy, they provide an incomplete understanding of complex and heterogeneous diseases like cancer. The industry trend now leans towards advanced AI platforms that can simultaneously process and synthesize information from diverse sources.
- According to recent studies, The market is projected to reach significant growth, with one report estimating a market size of over USD10 billion by 2025. This expansion reflects the increasing demand for more accurate, efficient, and cost-effective diagnostic solutions in the fight against cancer.
What challenges does the AI In Cancer Diagnostics Industry face during its growth?
- In the dynamic and intricately fragmented regulatory environment, the industry's growth is significantly impacted, necessitating continuous adaptation and expertise.
- Artificial intelligence (AI) is revolutionizing cancer diagnostics, offering enhanced accuracy and efficiency in identifying and treating various cancer types. The global market for AI in cancer diagnostics is evolving rapidly, with key applications including tumor segmentation, diagnosis, and prognosis. According to recent studies, the global market for AI in pathology is projected to reach USD2.1 billion by 2025, growing at a significant rate. Regulatory compliance is a critical challenge in this market, as AI solutions must meet rigorous safety and efficacy standards in various economic regions. For instance, the US Food and Drug Administration (FDA) has approved over 20 AI-based medical devices since 2017, demonstrating a progressive yet meticulous approach to regulatory oversight.
- This complex regulatory landscape necessitates substantial investment in development, extending time to market and introducing commercial uncertainty. Despite these challenges, the potential benefits of AI in cancer diagnostics are substantial, including improved accuracy, reduced turnaround time, and enhanced patient outcomes.
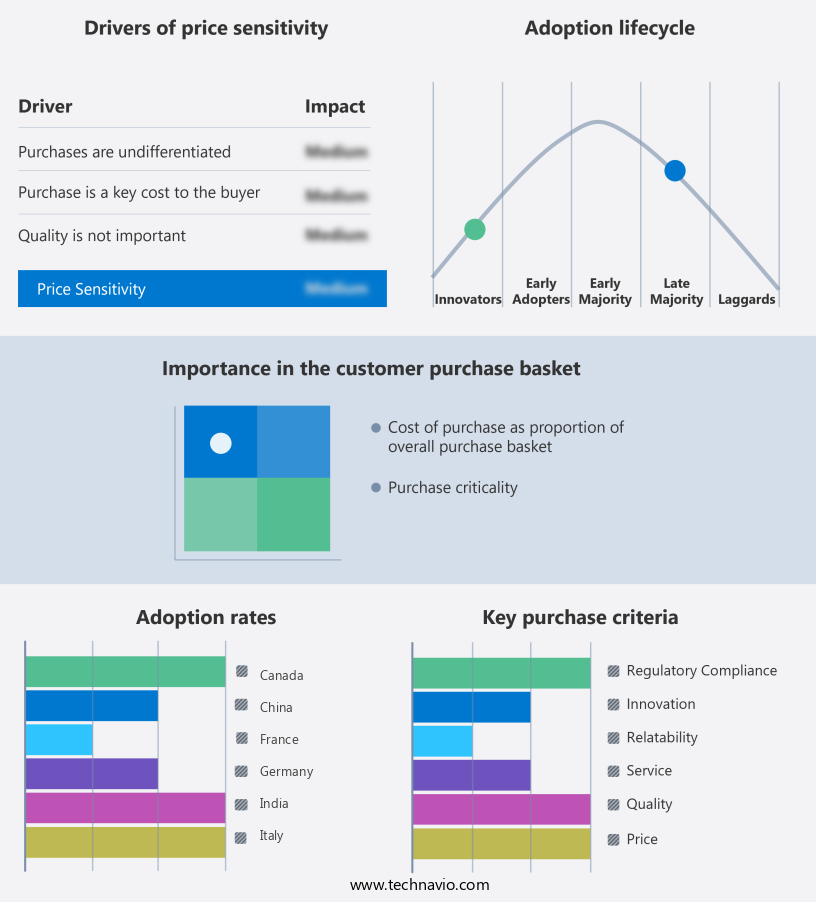
Exclusive Technavio Analysis on Customer Landscape
The ai in cancer diagnostics market forecasting report includes the adoption lifecycle of the market, covering from the innovator’s stage to the laggard’s stage. It focuses on adoption rates in different regions based on penetration. Furthermore, the ai in cancer diagnostics market report also includes key purchase criteria and drivers of price sensitivity to help companies evaluate and develop their market growth analysis strategies.
Customer Landscape of AI In Cancer Diagnostics Industry
Competitive Landscape
Companies are implementing various strategies, such as strategic alliances, ai in cancer diagnostics market forecast, partnerships, mergers and acquisitions, geographical expansion, and product/service launches, to enhance their presence in the industry.
Aidoc - The company's aiOS platform utilizes advanced AI applications in cancer diagnostics, featuring FDA-cleared algorithms for detecting pulmonary nodules, breast lesions, and incidental findings across CT and X-ray imaging modalities. This technology enhances diagnostic accuracy and efficiency in radiology.
The industry research and growth report includes detailed analyses of the competitive landscape of the market and information about key companies, including:
- Aidoc
- Concr Pty Ltd
- DELFI Diagnostics Inc.
- F. Hoffmann La Roche Ltd.
- Flatiron Health
- Freenome Holdings Inc.
- GE Healthcare Technologies Inc.
- GLEAMER
- Google DeepMind
- Ibex Medical Analytics
- Koninklijke Philips NV
- Microsoft Corp.
- Oncora Medical Inc.
- Paige AI Inc.
- PathAI Inc.
- Proscia Inc.
- Siemens Healthineers AG
- Tempus Labs Inc.
Qualitative and quantitative analysis of companies has been conducted to help clients understand the wider business environment as well as the strengths and weaknesses of key industry players. Data is qualitatively analyzed to categorize companies as pure play, category-focused, industry-focused, and diversified; it is quantitatively analyzed to categorize companies as dominant, leading, strong, tentative, and weak.
Recent Development and News in AI In Cancer Diagnostics Market
- In January 2025, IBM Watson Health announced the FDA clearance for its AI-powered oncology diagnostic tool, IBM Watson for Genomics, which can identify genetic mutations in cancer patients for personalized treatment recommendations (IBM Press Release). In March 2025, Google Health and Roche entered into a strategic partnership to integrate Google's DeepMind Health AI technology with Roche's diagnostic tools, aiming to improve accuracy and efficiency in cancer diagnosis (Google Blog Post). In May 2025, Grail, a leading AI-driven diagnostics company, raised a series D funding round of USD400 million, bringing its total funding to over USD1 billion, to expand its cancer screening tests and increase market penetration (Business Wire). In August 2025, the European Union's In Vitro Diagnostic Medical Devices Regulation (IVDR) came into effect, requiring AI-based cancer diagnostic tools to undergo stricter regulatory approval processes (EU Commission Press Release).
Dive into Technavio’s robust research methodology, blending expert interviews, extensive data synthesis, and validated models for unparalleled AI In Cancer Diagnostics Market insights. See full methodology.
|
Market Scope |
|
|
Report Coverage |
Details |
|
Page number |
243 |
|
Base year |
2024 |
|
Historic period |
2019-2023 |
|
Forecast period |
2025-2029 |
|
Growth momentum & CAGR |
Accelerate at a CAGR of 23.6% |
|
Market growth 2025-2029 |
USD 826.7 million |
|
Market structure |
Fragmented |
|
YoY growth 2024-2025(%) |
21.1 |
|
Key countries |
US, Germany, UK, France, China, Canada, Japan, Italy, South Korea, and India |
|
Competitive landscape |
Leading Companies, Market Positioning of Companies, Competitive Strategies, and Industry Risks |
Research Analyst Overview
- The computer-aided diagnosis (CAD) market in cancer diagnostics continues to evolve, driven by advancements in machine learning algorithms and the integration of various data sources. Disease progression modeling and radiation therapy planning are among the applications gaining traction, enabling more accurate and personalized treatment approaches. For instance, machine learning algorithms have been shown to improve treatment response prediction by analyzing circulating tumor cells and patient outcome prediction based on electronic health records. Moreover, the integration of genomic data and multimodal data fusion in oncology data analytics has led to the discovery of new biomarkers and cancer subtype classification, paving the way for personalized medicine approaches.
- The industry is expected to grow at a significant rate, with a recent study projecting a 20% annual increase in the adoption of AI technologies in cancer diagnostics. For example, a recent study using deep learning architectures for pathology image analysis achieved a tumor detection accuracy of 94%, outperforming traditional methods. Furthermore, precision oncology applications, such as chemotherapy optimization and immunotherapy response prediction, are revolutionizing cancer care by providing healthcare professionals with valuable insights for patient treatment. In addition, the integration of natural language processing and radiomics feature extraction from diagnostic imaging techniques has led to the development of early detection algorithms and oncogenomic profiling, enabling oncologists to make more informed decisions and improve patient outcomes.
- The ongoing unfolding of these market activities and evolving patterns underscores the transformative potential of AI in cancer diagnostics.
What are the Key Data Covered in this AI In Cancer Diagnostics Market Research and Growth Report?
-
What is the expected growth of the AI In Cancer Diagnostics Market between 2025 and 2029?
-
USD 826.7 million, at a CAGR of 23.6%
-
-
What segmentation does the market report cover?
-
The report is segmented by Component (Software, Hardware, and Services), Type (Breast cancer, Lung cancer, Prostate cancer, Blood cancer, and Others), End-user (Hospitals, Surgical centers, and Others), and Geography (North America, Europe, APAC, South America, and Middle East and Africa)
-
-
Which regions are analyzed in the report?
-
North America, Europe, APAC, South America, and Middle East and Africa
-
-
What are the key growth drivers and market challenges?
-
Escalating cancer burden and critical need for diagnostic efficiency, Navigating a fragmented and evolving regulatory landscape
-
-
Who are the major players in the AI In Cancer Diagnostics Market?
-
Aidoc, Concr Pty Ltd, DELFI Diagnostics Inc., F. Hoffmann La Roche Ltd., Flatiron Health, Freenome Holdings Inc., GE Healthcare Technologies Inc., GLEAMER, Google DeepMind, Ibex Medical Analytics, Koninklijke Philips NV, Microsoft Corp., Oncora Medical Inc., Paige AI Inc., PathAI Inc., Proscia Inc., Siemens Healthineers AG, and Tempus Labs Inc.
-
Market Research Insights
- The market is a continually advancing field, with significant strides made in improving diagnostic accuracy and efficiency. Image quality assessment plays a crucial role in this evolution, with negative predictive value and sensitivity and specificity being key performance metrics. For instance, AI-powered diagnostics have been shown to reduce false negative rates by up to 50% in certain applications. Furthermore, industry growth is anticipated to exceed 20% annually, as software validation protocols and regulatory approval pathways enable wider adoption. Data security and privacy regulations are essential considerations, as are false positive rates and bias mitigation techniques.
- AI-driven tumor staging tools and treatment efficacy monitoring systems are revolutionizing healthcare workflows, while explainable AI methods and ethical considerations are essential components of model interpretability and clinical utility evaluation. Cloud computing platforms facilitate model training pipelines and data annotation processes, contributing to drug development acceleration and algorithm validation methods.
We can help! Our analysts can customize this ai in cancer diagnostics market research report to meet your requirements.
 RIA -
RIA - 
