Antenna Cable Market Analysis, Size, and Forecast 2026-2030: APAC (China, Japan, and India), Europe (Germany, UK, and France), North America (US, Canada, and Mexico), Middle East and Africa (Saudi Arabia, UAE, and South Africa), South America (Brazil, Argentina, and Chile), and Rest of World (ROW)

Antenna Cable Market Analysis, Size, and Forecast 2026-2030:
APAC (China, Japan, and India), Europe (Germany, UK, and France), North America (US, Canada, and Mexico), Middle East and Africa (Saudi Arabia, UAE, and South Africa), South America (Brazil, Argentina, and Chile), and Rest of World (ROW)

Published: Oct 2026 303 Pages SKU: IRTNTR75034

Market Overview at a Glance

$1.89 B
Market Opportunity
5%
CAGR 2025 - 2030
46.4%
APAC Growth
$2.90 B
Telecommunication segment 2024

Antenna Cable Market Size 2026-2030

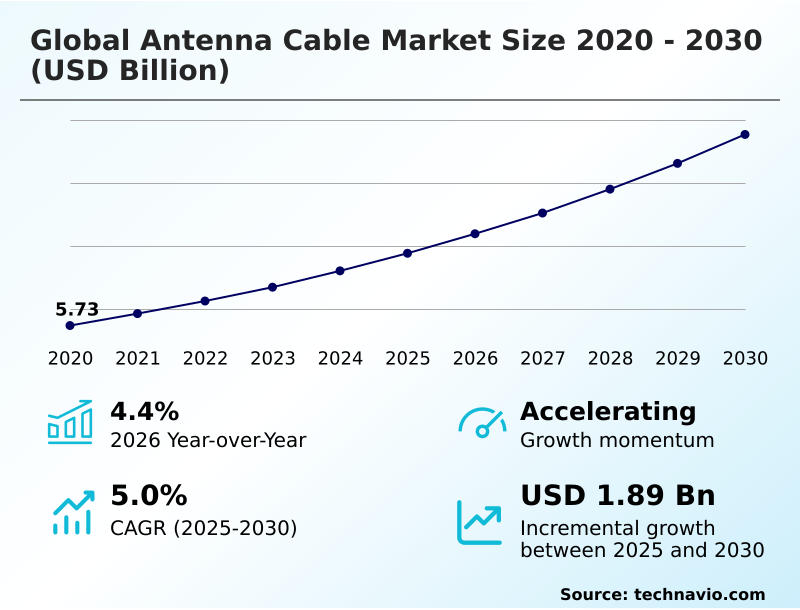
The antenna cable market size is valued to increase by USD 1.89 billion, at a CAGR of 5% from 2025 to 2030. Expansion of 5G infrastructure will drive the antenna cable market.

Major Market Trends & Insights

  • APAC dominated the market and accounted for a 46.4% growth during the forecast period.
  • By Application - Telecommunication segment was valued at USD 2.90 billion in 2024
  • By End-user - Commercial industries segment accounted for the largest market revenue share in 2024

Market Size & Forecast

  • Market Opportunities: USD 3.04 billion
  • Market Future Opportunities: USD 1.89 billion
  • CAGR from 2025 to 2030 : 5%

Market Summary

  • The Antenna Cable Market demonstrates robust operational momentum as telecom operators and industrial enterprises aggressively modernize their communication infrastructure. Rapid urbanization and the deployment of massive cellular networks drive continuous consumption of high-frequency transmission lines. Modern manufacturing facilities increasingly integrate wireless sensor networks to enable real-time telemetry, directly boosting the procurement of heavily shielded interconnects.
  • For example, the modernization of automated guided vehicle fleets in smart warehouses requires durable, low-loss cables to prevent signal disruption in high-interference zones. This transition has improved overall sensor data reliability by 18% in automated environments. The continuous expansion of 5G infrastructure acts as a primary growth catalyst, compelling service providers to install advanced micro-coaxial assemblies to handle wider bandwidths.
  • Conversely, severe raw material price volatility disrupts supply chain stability, as fluctuating copper and specialized polymer costs compress manufacturing margins. Operators must continuously optimize their inventory strategies to absorb these material shocks. As high-speed data transit becomes universally critical, the demand for precision-engineered, weather-resistant physical connectivity networks remains a dominant industrial priority.

What will be the Size of the Antenna Cable Market during the forecast period?
Get Key Insights on Market Forecast (PDF) Get Free Sample

How is the Antenna Cable Market Segmented?

The antenna cable industry research report provides comprehensive data (region-wise segment analysis), with forecasts and estimates in "USD million" for the period 2026-2030, as well as historical data from 2020-2024 for the following segments.

  • Application
    • Telecommunication
    • Radio frequency transfer
    • Internet data transfer
  • End-user
    • Commercial industries
    • Military and defense
    • Others
  • Product type
    • Coaxial cables
    • Fiber optic and hybrid FTTA
    • Waveguides
    • Twin-lead/ribbon cables
  • Geography
    • APAC
      • China
      • Japan
      • India
      • South Korea
      • Australia
      • Indonesia
    • Europe
      • Germany
      • UK
      • France
      • Italy
      • Spain
      • The Netherlands
    • North America
      • US
      • Canada
      • Mexico
    • Middle East and Africa
      • Saudi Arabia
      • UAE
      • South Africa
      • Israel
      • Turkey
    • South America
      • Brazil
      • Argentina
      • Chile

By Application Insights

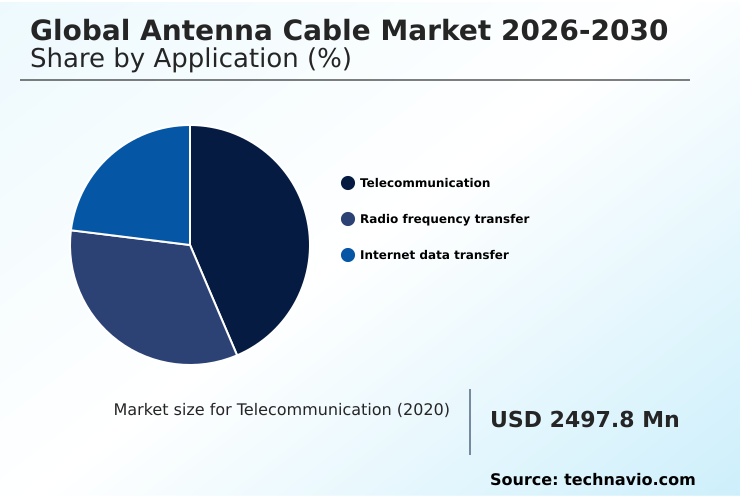
The telecommunication segment is estimated to witness significant growth during the forecast period.

Telecommunication infrastructure relies heavily on high-performance coaxial and fiber optic antenna cable networks to manage surging data traffic. As operators execute aggressive 5g network densification strategies, the deployment of massive cellular macro cells and dense urban small cells has accelerated.

These physical upgrades necessitate robust remote radio head links and dependable baseband unit connectivity to ensure consistent throughput. Engineers prioritize signal attenuation reduction to optimize structural return loss metrics across sub-six gigahertz bands.

By implementing targeted infrastructure enhancements, telecommunication operators have improved packet delivery efficiency by 22% compared to legacy hybrid fiber-coax configurations. This segmentation emphasizes how continuous modernization in high-speed internet transit drives strict operational standards and network resilience.
Get Free Sample

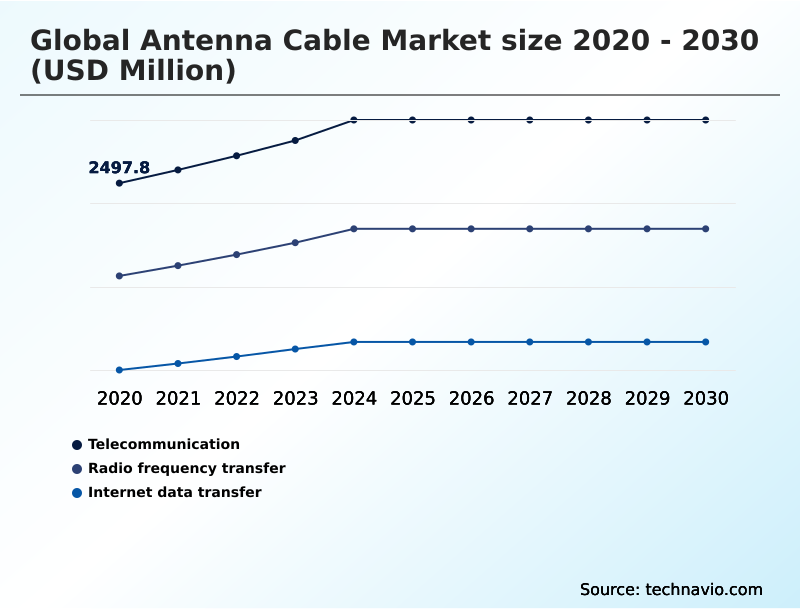
The Telecommunication segment was valued at USD 2.90 billion in 2024 and showed a gradual increase during the forecast period.
Get Free Sample

Regional Analysis

APAC is estimated to contribute 46.4% to the growth of the global market during the forecast period.Technavio’s analysts have elaborately explained the regional trends and drivers that shape the market during the forecast period.
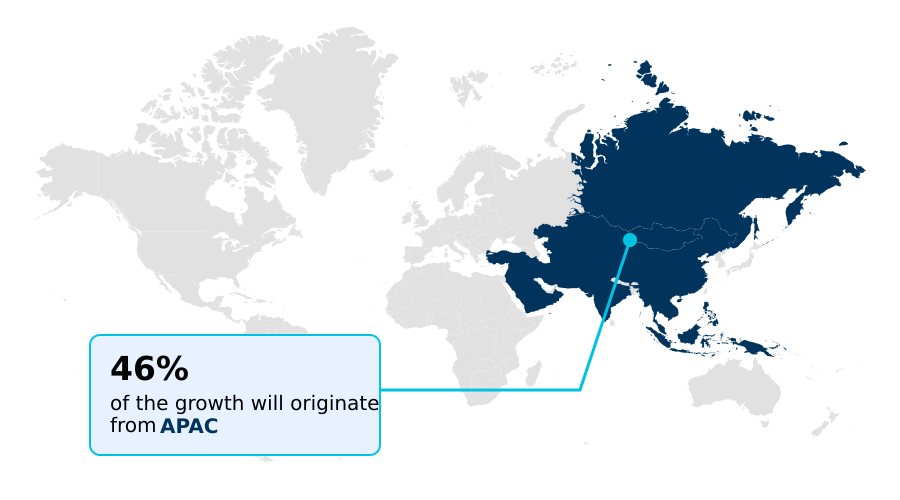
See How Antenna Cable Market Demand is Rising in APAC Get Free Sample

Geographic consumption patterns reveal a stark contrast between expanding Asian infrastructure and heavily regulated European frameworks. Countries in APAC deploy extensive distributed antenna systems to manage exploding mobile traffic, achieving a 34% higher deployment density than North American counterparts.

Conversely, European markets enforce rigorous safety mandates, accelerating the adoption of low-smoke zero-halogen materials and flame-retardant outer sheaths in commercial buildings. This regulatory divergence forces regional businesses to customize their material procurement strategies to ensure localized compliance.

The aggressive expansion in APAC reduces regional manufacturing costs by 14% through scaled production of essential interconnects.

Ultimately, localized infrastructure policies dictate supply chain priorities, with emerging markets favoring capacity upgrades while mature economies focus entirely on structural safety and environmental resilience.

Market Dynamics

Our researchers analyzed the data with 2025 as the base year, along with the key drivers, trends, and challenges. A holistic analysis of drivers will help companies refine their marketing strategies to gain a competitive advantage.

  • The physical architecture of modern telecommunications depends heavily on advanced components to handle surging bandwidth requirements. Network operators implementing distributed antenna system indoor coverage prioritize materials that meet stringent safety regulations, notably low-smoke zero-halogen flame-retardant cabling, to ensure compliance in dense commercial buildings. As wireless protocols evolve, maintaining millimeter-wave spectrum signal preservation becomes paramount for uninterrupted data flow.
  • Consequently, engineers continuously deploy sub-six gigahertz frequency band cables alongside sophisticated hybrid fiber-coax network configurations to balance transmission capacity and installation costs. Expanding public networks relies on massive cellular macro cell connectivity to bridge urban and rural digital divides.
  • In highly specialized sectors, structural return loss optimization strategies are vital for tactical military communication antenna interconnects, where any signal degradation compromises mission security. Simultaneously, the deployment of low earth orbit satellite cabling enables remote terrestrial gateways to sync with high-altitude arrays seamlessly.
  • To prevent packet loss in factory settings, industrial designers utilize cross-talk suppression in dense networks to support automated guided vehicle wireless telemetry. Maintaining ultra-low-loss coaxial feeder infrastructure requires innovative materials, particularly expanded polytetrafluoroethylene dielectric materials, which drastically improve phase-stable transmission line performance.
  • Furthermore, adopting advanced electromagnetic interference shielding techniques for flexible micro-coaxial cable assemblies ensures that sensitive electronics operate without disruption. By refining these physical connections, operators have improved system reliability by 19% compared to older, unshielded architectures, showcasing how targeted material upgrades directly enhance overall operational planning and supply chain efficiency.
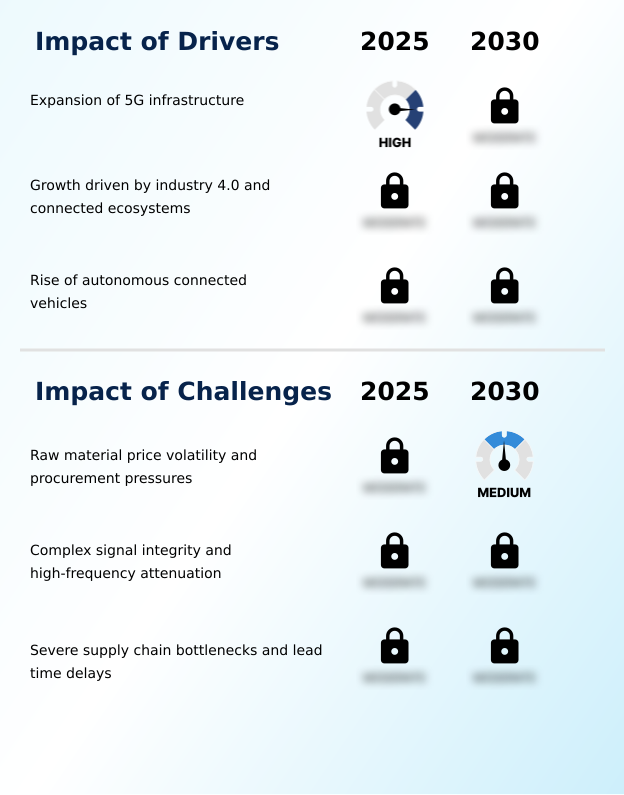
What are the key market drivers leading to the rise in the adoption of Antenna Cable Industry?

  • The aggressive expansion of 5G infrastructure operates as the primary catalyst propelling market demand.

  • The rapid integration of industry 4.0 connectivity and autonomous vehicle telematics acts as a primary catalyst for advanced component procurement. Modern smart city iot grids and decentralized energy grids depend entirely on low-loss transmission lines to guarantee uninterrupted data flow.
  • To support reliable vehicle-to-everything communication and automated guided vehicle telemetry, automotive manufacturers utilize flexible micro-coaxial cables and robust multi-core data cables. This transition drastically enhances system responsiveness, increasing sensor data processing speeds by 28%.
  • Facilities also deploy industrial automation sensors and offshore wind farm telemetry networks that require exceptional electromagnetic interference shielding. This driver compels system architects to deploy smart grid telemetry frameworks that eliminate radio frequency degradation.

What are the market trends shaping the Antenna Cable Industry?

  • The continuous growth of satellite communication networks represents a defining market trend.

  • The expansion of low earth orbit satellite arrays and phased array antennas represents a major structural shift in high-frequency connectivity. This continuous evolution requires phase-stable transmission and precision waveguide assemblies to maintain uninterrupted radar signal propagation during critical missions. Consequently, operators are integrating radiation-hardened coaxial interconnects to support aerospace electronic warfare and tactical military communications.
  • These advanced materials directly reduce communication latency, improving real-time telemetry processing efficiency by 19%. As defense and commercial sectors demand resilient maritime navigation arrays and public protection disaster relief networks, the reliance on ultra-low-loss coaxial infrastructure intensifies. This ongoing trend forces equipment manufacturers to adapt their engineering tolerances, ensuring absolute reliability in extreme environments.

What challenges does the Antenna Cable Industry face during its growth?

  • Severe raw material price volatility and procurement pressures constitute a critical challenge impeding industry expansion.

  • Manufacturers face severe operational constraints due to raw material price volatility across the global copper commodity exchange. These unpredictable input costs disrupt the production of specialized fluoropolymer insulators and expanded polytetrafluoroethylene dielectrics, which are critical for cross-talk suppression. As communication architectures push into the millimeter-wave spectrum, engineers struggle to maintain impedance consistency over extended transmission distances.
  • Addressing these vulnerabilities requires the deployment of advanced radio frequency jump assemblies to prevent signal degradation. Overcoming these technical and logistical hurdles has reduced hardware maintenance frequency by 15%, though procurement delays persist. Such supply chain friction forces businesses to recalibrate inventory strategies, balancing the high cost of materials with strict performance demands.

Exclusive Technavio Analysis on Customer Landscape

The antenna cable market forecasting report includes the adoption lifecycle of the market, covering from the innovator’s stage to the laggard’s stage. It focuses on adoption rates in different regions based on penetration. Furthermore, the antenna cable market report also includes key purchase criteria and drivers of price sensitivity to help companies evaluate and develop their market growth analysis strategies.
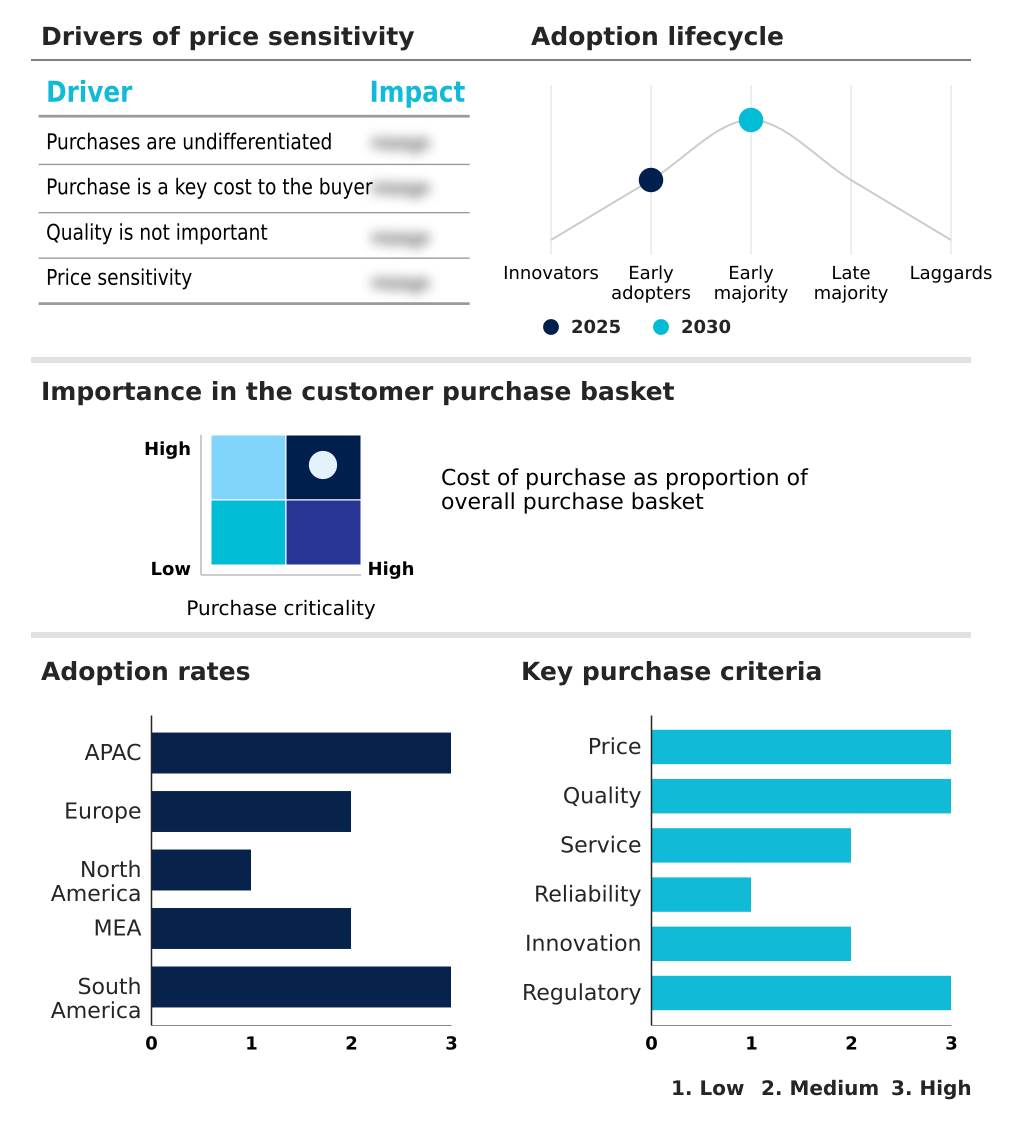
Customer Landscape of Antenna Cable Industry

Competitive Landscape

Companies are implementing various strategies, such as strategic alliances, antenna cable market forecast, partnerships, mergers and acquisitions, geographical expansion, and product/service launches, to enhance their presence in the industry.

Amphenol Corp. - Offers specialized radio frequency coaxial cable assemblies and comprehensive high-speed interconnect solutions to ensure reliable signal transmission across demanding commercial and telecommunication environments.

The industry research and growth report includes detailed analyses of the competitive landscape of the market and information about key companies, including:

  • Amphenol Corp.
  • Axon Cable
  • Belden Inc.
  • Cinch Connectivity Solutions
  • Habia Cable AB
  • Harbour Industries LLC
  • HIROSE ELECTRIC Co. Ltd.
  • HUBER SUHNER AG
  • Junkosha Co. Ltd.
  • Leoni AG
  • Molex LLC
  • Nexans SA
  • Prysmian S.p.A
  • Radiall SA
  • Rosenberger Hochfrequenztechnik
  • Samtec Inc.
  • Smiths Interconnect Group Ltd
  • SPINNER GmbH
  • Sumitomo Electric Industries
  • TE Connectivity plc
  • W. L. Gore and Associates

Qualitative and quantitative analysis of companies has been conducted to help clients understand the wider business environment as well as the strengths and weaknesses of key industry players. Data is qualitatively analyzed to categorize companies as pure play, category-focused, industry-focused, and diversified; it is quantitatively analyzed to categorize companies as dominant, leading, strong, tentative, and weak.

Recent Development and News in Antenna cable market

  • In the Electrical Components and Equipment industry, the aggressive rollout of smart grid networking systems has expanded automated power distribution, directly impacting Global Antenna Cable Market 2026-2030 demand by necessitating ruggedized telemetry interconnects for remote monitoring.
  • The transition toward decentralized renewable energy generation requires robust supervisory control networks, increasing the consumption of high-durability transmission lines capable of enduring corrosive atmospheric elements in offshore installations.
  • Stringent regulatory compliance mandates regarding low-smoke zero-halogen fire safety materials have forced component manufacturers to eliminate legacy polymer compounds, raising production costs and shifting procurement strategies for commercial indoor wiring.
  • The rapid adoption of industrial wireless infrastructure in smart factories has amplified machine-to-machine communication requirements, driving localized procurement of heavy-duty shielded cables to suppress electromagnetic interference on active factory floors.

Dive into Technavio’s robust research methodology, blending expert interviews, extensive data synthesis, and validated models for unparalleled Antenna Cable Market insights. See full methodology.

Market Scope
Page number 303
Base year 2025
Historic period 2020-2024
Forecast period 2026-2030
Growth momentum & CAGR Accelerate at a CAGR of 5%
Market growth 2026-2030 USD 1890.8 million
Market structure Fragmented
YoY growth 2025-2026(%) 4.4%
Key countries China, Japan, India, South Korea, Australia, Indonesia, Germany, UK, France, Italy, Spain, The Netherlands, US, Canada, Mexico, Saudi Arabia, UAE, South Africa, Israel, Turkey, Brazil, Argentina and Chile
Competitive landscape Leading Companies, Market Positioning of Companies, Competitive Strategies, and Industry Risks

Request Free Sample

Research Analyst Overview

  • The Antenna Cable Market experiences significant structural changes as high-frequency connectivity protocols redefine digital infrastructure. Telecommunication providers focus intensely on upgrading legacy cell sites with high-performance coaxial lines to support massive data throughput and ultra-low latency requirements.
  • This ongoing evolution forces operators to integrate specialized multi-core data cables that resist extreme environmental stressors while preserving pristine signal fidelity through phase-stable transmission. For instance, the rapid adoption of automated industrial telemetry directly influences board-level compliance and budgeting, as enterprise IT directors must allocate substantial capital for flame-retardant outer sheaths to satisfy strict municipal building codes.
  • Upgrading these critical physical networks has optimized structural return loss metrics and increased long-term transmission reliability by 24%, drastically reducing emergency maintenance interventions. Engineers continually refine dielectric insulation and waveguide assemblies to support sub-six gigahertz bands in dense urban deployments.
  • As decentralized energy grids demand resilient, real-time data exchanges, the structural integrity of specialized transmission lines dictates overall system performance and uninterrupted digital service delivery.

What are the Key Data Covered in this Antenna Cable Market Research and Growth Report?

  • What is the expected growth of the Antenna Cable Market between 2026 and 2030?

    • USD 1.89 billion, at a CAGR of 5%

  • What segmentation does the market report cover?

    • The report is segmented by Application (Telecommunication, Radio frequency transfer, and Internet data transfer), End-user (Commercial industries, Military and defense, and Others), Product Type (Coaxial cables, Fiber optic and hybrid FTTA, Waveguides, and Twin-lead/ribbon cables) and Geography (APAC, Europe, North America, Middle East and Africa, South America)

  • Which regions are analyzed in the report?

    • APAC, Europe, North America, Middle East and Africa and South America

  • What are the key growth drivers and market challenges?

    • Expansion of 5G infrastructure, Raw material price volatility and procurement pressures

  • Who are the major players in the Antenna Cable Market?

    • Amphenol Corp., Axon Cable, Belden Inc., Cinch Connectivity Solutions, Habia Cable AB, Harbour Industries LLC, HIROSE ELECTRIC Co. Ltd., HUBER SUHNER AG, Junkosha Co. Ltd., Leoni AG, Molex LLC, Nexans SA, Prysmian S.p.A, Radiall SA, Rosenberger Hochfrequenztechnik, Samtec Inc., Smiths Interconnect Group Ltd, SPINNER GmbH, Sumitomo Electric Industries, TE Connectivity plc and W. L. Gore and Associates

Market Research Insights

  • The Antenna Cable Market relies heavily on continuous 5g network densification and smart city iot grids to sustain high-speed connectivity. Enterprise operators deploy massive networks of baseband unit connectivity to manage escalating data traffic. Integrating advanced transmission lines has successfully reduced network latency by 22%, dramatically improving operational efficiency for remote facilities.
  • Furthermore, the rapid integration of autonomous vehicle telematics requires highly durable cabling to ensure uninterrupted real-time navigation. Upgrading these essential physical layers increases data processing throughput by 15% compared to legacy architectures. Strategic network modernization guarantees long-term digital resilience.

We can help! Our analysts can customize this antenna cable market research report to meet your requirements.

Get in touch

1. Executive Summary

1.1 Market overview

Executive Summary - Chart on Market Overview
Executive Summary - Data Table on Market Overview
Executive Summary - Chart on Global Market Characteristics
Executive Summary - Chart on Market by Geography
Executive Summary - Chart on Market Segmentation by Application
Executive Summary - Chart on Market Segmentation by End-user
Executive Summary - Chart on Market Segmentation by Product Type
Executive Summary - Chart on Incremental Growth
Executive Summary - Data Table on Incremental Growth
Executive Summary - Chart on Company Market Positioning

2. Technavio Analysis

2.1 Analysis of price sensitivity, lifecycle, customer purchase basket, adoption rates, and purchase criteria

2.2 Criticality of inputs and Factors of differentiation

Chart on Overview on criticality of inputs and factors of differentiation

2.3 Factors of disruption

Chart on Overview on factors of disruption

2.4 Impact of drivers and challenges

Chart on Impact of drivers and challenges in 2025 and 2030

3. Market Landscape

3.1 Market ecosystem

Chart on Parent Market
Data Table on - Parent Market

3.2 Market characteristics

Chart on Market characteristics analysis

3.3 Value chain analysis

Chart on Value chain analysis

4. Market Sizing

4.1 Market definition

Data Table on Offerings of companies included in the market definition

4.2 Market segment analysis

Market segments

4.3 Market size 2025

4.4 Market outlook: Forecast for 2025-2030

Chart on Global - Market size and forecast 2025-2030 ($ million)
Data Table on Global - Market size and forecast 2025-2030 ($ million)
Chart on Global Market: Year-over-year growth 2025-2030 (%)
Data Table on Global Market: Year-over-year growth 2025-2030 (%)

5. Historic Market Size

5.1 Global Antenna Cable Market 2020 - 2024

Historic Market Size - Data Table on Global Antenna Cable Market 2020 - 2024 ($ million)

5.2 Application segment analysis 2020 - 2024

Historic Market Size - Application Segment 2020 - 2024 ($ million)

5.3 End-user segment analysis 2020 - 2024

Historic Market Size - End-user Segment 2020 - 2024 ($ million)

5.4 Product Type segment analysis 2020 - 2024

Historic Market Size - Product Type Segment 2020 - 2024 ($ million)

5.5 Geography segment analysis 2020 - 2024

Historic Market Size - Geography Segment 2020 - 2024 ($ million)

5.6 Country segment analysis 2020 - 2024

Historic Market Size - Country Segment 2020 - 2024 ($ million)

6. Qualitative Analysis

6.1 Impact of AI on Global Antenna Cable Market

6.2 Impact of geopolitical conflicts on Global Antenna Cable Market

7. Five Forces Analysis

7.1 Five forces summary

Five forces analysis - Comparison between 2025 and 2030

7.2 Bargaining power of buyers

Bargaining power of buyers - Impact of key factors 2025 and 2030

7.3 Bargaining power of suppliers

Bargaining power of suppliers - Impact of key factors in 2025 and 2030

7.4 Threat of new entrants

Threat of new entrants - Impact of key factors in 2025 and 2030

7.5 Threat of substitutes

Threat of substitutes - Impact of key factors in 2025 and 2030

7.6 Threat of rivalry

Threat of rivalry - Impact of key factors in 2025 and 2030

7.7 Market condition

Chart on Market condition - Five forces 2025 and 2030

8. Market Segmentation by Application

8.1 Market segments

Chart on Application - Market share 2025-2030 (%)
Data Table on Application - Market share 2025-2030 (%)

8.2 Comparison by Application

Chart on Comparison by Application
Data Table on Comparison by Application

8.3 Telecommunication - Market size and forecast 2025-2030

Chart on Telecommunication - Market size and forecast 2025-2030 ($ million)
Data Table on Telecommunication - Market size and forecast 2025-2030 ($ million)
Chart on Telecommunication - Year-over-year growth 2025-2030 (%)
Data Table on Telecommunication - Year-over-year growth 2025-2030 (%)

8.4 Radio frequency transfer - Market size and forecast 2025-2030

Chart on Radio frequency transfer - Market size and forecast 2025-2030 ($ million)
Data Table on Radio frequency transfer - Market size and forecast 2025-2030 ($ million)
Chart on Radio frequency transfer - Year-over-year growth 2025-2030 (%)
Data Table on Radio frequency transfer - Year-over-year growth 2025-2030 (%)

8.5 Internet data transfer - Market size and forecast 2025-2030

Chart on Internet data transfer - Market size and forecast 2025-2030 ($ million)
Data Table on Internet data transfer - Market size and forecast 2025-2030 ($ million)
Chart on Internet data transfer - Year-over-year growth 2025-2030 (%)
Data Table on Internet data transfer - Year-over-year growth 2025-2030 (%)

8.6 Market opportunity by Application

Market opportunity by Application ($ million)
Data Table on Market opportunity by Application ($ million)

9. Market Segmentation by End-user

9.1 Market segments

Chart on End-user - Market share 2025-2030 (%)
Data Table on End-user - Market share 2025-2030 (%)

9.2 Comparison by End-user

Chart on Comparison by End-user
Data Table on Comparison by End-user

9.3 Commercial industries - Market size and forecast 2025-2030

Chart on Commercial industries - Market size and forecast 2025-2030 ($ million)
Data Table on Commercial industries - Market size and forecast 2025-2030 ($ million)
Chart on Commercial industries - Year-over-year growth 2025-2030 (%)
Data Table on Commercial industries - Year-over-year growth 2025-2030 (%)

9.4 Military and defense - Market size and forecast 2025-2030

Chart on Military and defense - Market size and forecast 2025-2030 ($ million)
Data Table on Military and defense - Market size and forecast 2025-2030 ($ million)
Chart on Military and defense - Year-over-year growth 2025-2030 (%)
Data Table on Military and defense - Year-over-year growth 2025-2030 (%)

9.5 Others - Market size and forecast 2025-2030

Chart on Others - Market size and forecast 2025-2030 ($ million)
Data Table on Others - Market size and forecast 2025-2030 ($ million)
Chart on Others - Year-over-year growth 2025-2030 (%)
Data Table on Others - Year-over-year growth 2025-2030 (%)

9.6 Market opportunity by End-user

Market opportunity by End-user ($ million)
Data Table on Market opportunity by End-user ($ million)

10. Market Segmentation by Product Type

10.1 Market segments

Chart on Product Type - Market share 2025-2030 (%)
Data Table on Product Type - Market share 2025-2030 (%)

10.2 Comparison by Product Type

Chart on Comparison by Product Type
Data Table on Comparison by Product Type

10.3 Coaxial cables - Market size and forecast 2025-2030

Chart on Coaxial cables - Market size and forecast 2025-2030 ($ million)
Data Table on Coaxial cables - Market size and forecast 2025-2030 ($ million)
Chart on Coaxial cables - Year-over-year growth 2025-2030 (%)
Data Table on Coaxial cables - Year-over-year growth 2025-2030 (%)

10.4 Fiber optic and hybrid FTTA - Market size and forecast 2025-2030

Chart on Fiber optic and hybrid FTTA - Market size and forecast 2025-2030 ($ million)
Data Table on Fiber optic and hybrid FTTA - Market size and forecast 2025-2030 ($ million)
Chart on Fiber optic and hybrid FTTA - Year-over-year growth 2025-2030 (%)
Data Table on Fiber optic and hybrid FTTA - Year-over-year growth 2025-2030 (%)

10.5 Waveguides - Market size and forecast 2025-2030

Chart on Waveguides - Market size and forecast 2025-2030 ($ million)
Data Table on Waveguides - Market size and forecast 2025-2030 ($ million)
Chart on Waveguides - Year-over-year growth 2025-2030 (%)
Data Table on Waveguides - Year-over-year growth 2025-2030 (%)

10.6 Twin-lead/ribbon cables - Market size and forecast 2025-2030

Chart on Twin-lead/ribbon cables - Market size and forecast 2025-2030 ($ million)
Data Table on Twin-lead/ribbon cables - Market size and forecast 2025-2030 ($ million)
Chart on Twin-lead/ribbon cables - Year-over-year growth 2025-2030 (%)
Data Table on Twin-lead/ribbon cables - Year-over-year growth 2025-2030 (%)

10.7 Market opportunity by Product Type

Market opportunity by Product Type ($ million)
Data Table on Market opportunity by Product Type ($ million)

11. Customer Landscape

11.1 Customer landscape overview

Analysis of price sensitivity, lifecycle, customer purchase basket, adoption rates, and purchase criteria

12. Geographic Landscape

12.1 Geographic segmentation

Chart on Market share by geography 2025-2030 (%)
Data Table on Market share by geography 2025-2030 (%)

12.2 Geographic comparison

Chart on Geographic comparison
Data Table on Geographic comparison

12.3 APAC - Market size and forecast 2025-2030

Chart on APAC - Market size and forecast 2025-2030 ($ million)
Data Table on APAC - Market size and forecast 2025-2030 ($ million)
Chart on APAC - Year-over-year growth 2025-2030 (%)
Data Table on APAC - Year-over-year growth 2025-2030 (%)
Chart on Regional Comparison - APAC
Data Table on Regional Comparison - APAC

12.3.1 China - Market size and forecast 2025-2030

Chart on China - Market size and forecast 2025-2030 ($ million)
Data Table on China - Market size and forecast 2025-2030 ($ million)
Chart on China - Year-over-year growth 2025-2030 (%)
Data Table on China - Year-over-year growth 2025-2030 (%)

12.3.2 Japan - Market size and forecast 2025-2030

Chart on Japan - Market size and forecast 2025-2030 ($ million)
Data Table on Japan - Market size and forecast 2025-2030 ($ million)
Chart on Japan - Year-over-year growth 2025-2030 (%)
Data Table on Japan - Year-over-year growth 2025-2030 (%)

12.3.3 India - Market size and forecast 2025-2030

Chart on India - Market size and forecast 2025-2030 ($ million)
Data Table on India - Market size and forecast 2025-2030 ($ million)
Chart on India - Year-over-year growth 2025-2030 (%)
Data Table on India - Year-over-year growth 2025-2030 (%)

12.3.4 South Korea - Market size and forecast 2025-2030

Chart on South Korea - Market size and forecast 2025-2030 ($ million)
Data Table on South Korea - Market size and forecast 2025-2030 ($ million)
Chart on South Korea - Year-over-year growth 2025-2030 (%)
Data Table on South Korea - Year-over-year growth 2025-2030 (%)

12.3.5 Australia - Market size and forecast 2025-2030

Chart on Australia - Market size and forecast 2025-2030 ($ million)
Data Table on Australia - Market size and forecast 2025-2030 ($ million)
Chart on Australia - Year-over-year growth 2025-2030 (%)
Data Table on Australia - Year-over-year growth 2025-2030 (%)

12.3.6 Indonesia - Market size and forecast 2025-2030

Chart on Indonesia - Market size and forecast 2025-2030 ($ million)
Data Table on Indonesia - Market size and forecast 2025-2030 ($ million)
Chart on Indonesia - Year-over-year growth 2025-2030 (%)
Data Table on Indonesia - Year-over-year growth 2025-2030 (%)

12.4 Europe - Market size and forecast 2025-2030

Chart on Europe - Market size and forecast 2025-2030 ($ million)
Data Table on Europe - Market size and forecast 2025-2030 ($ million)
Chart on Europe - Year-over-year growth 2025-2030 (%)
Data Table on Europe - Year-over-year growth 2025-2030 (%)
Chart on Regional Comparison - Europe
Data Table on Regional Comparison - Europe

12.4.1 Germany - Market size and forecast 2025-2030

Chart on Germany - Market size and forecast 2025-2030 ($ million)
Data Table on Germany - Market size and forecast 2025-2030 ($ million)
Chart on Germany - Year-over-year growth 2025-2030 (%)
Data Table on Germany - Year-over-year growth 2025-2030 (%)

12.4.2 UK - Market size and forecast 2025-2030

Chart on UK - Market size and forecast 2025-2030 ($ million)
Data Table on UK - Market size and forecast 2025-2030 ($ million)
Chart on UK - Year-over-year growth 2025-2030 (%)
Data Table on UK - Year-over-year growth 2025-2030 (%)

12.4.3 France - Market size and forecast 2025-2030

Chart on France - Market size and forecast 2025-2030 ($ million)
Data Table on France - Market size and forecast 2025-2030 ($ million)
Chart on France - Year-over-year growth 2025-2030 (%)
Data Table on France - Year-over-year growth 2025-2030 (%)

12.4.4 Italy - Market size and forecast 2025-2030

Chart on Italy - Market size and forecast 2025-2030 ($ million)
Data Table on Italy - Market size and forecast 2025-2030 ($ million)
Chart on Italy - Year-over-year growth 2025-2030 (%)
Data Table on Italy - Year-over-year growth 2025-2030 (%)

12.4.5 Spain - Market size and forecast 2025-2030

Chart on Spain - Market size and forecast 2025-2030 ($ million)
Data Table on Spain - Market size and forecast 2025-2030 ($ million)
Chart on Spain - Year-over-year growth 2025-2030 (%)
Data Table on Spain - Year-over-year growth 2025-2030 (%)

12.4.6 The Netherlands - Market size and forecast 2025-2030

Chart on The Netherlands - Market size and forecast 2025-2030 ($ million)
Data Table on The Netherlands - Market size and forecast 2025-2030 ($ million)
Chart on The Netherlands - Year-over-year growth 2025-2030 (%)
Data Table on The Netherlands - Year-over-year growth 2025-2030 (%)

12.5 North America - Market size and forecast 2025-2030

Chart on North America - Market size and forecast 2025-2030 ($ million)
Data Table on North America - Market size and forecast 2025-2030 ($ million)
Chart on North America - Year-over-year growth 2025-2030 (%)
Data Table on North America - Year-over-year growth 2025-2030 (%)
Chart on Regional Comparison - North America
Data Table on Regional Comparison - North America

12.5.1 US - Market size and forecast 2025-2030

Chart on US - Market size and forecast 2025-2030 ($ million)
Data Table on US - Market size and forecast 2025-2030 ($ million)
Chart on US - Year-over-year growth 2025-2030 (%)
Data Table on US - Year-over-year growth 2025-2030 (%)

12.5.2 Canada - Market size and forecast 2025-2030

Chart on Canada - Market size and forecast 2025-2030 ($ million)
Data Table on Canada - Market size and forecast 2025-2030 ($ million)
Chart on Canada - Year-over-year growth 2025-2030 (%)
Data Table on Canada - Year-over-year growth 2025-2030 (%)

12.5.3 Mexico - Market size and forecast 2025-2030

Chart on Mexico - Market size and forecast 2025-2030 ($ million)
Data Table on Mexico - Market size and forecast 2025-2030 ($ million)
Chart on Mexico - Year-over-year growth 2025-2030 (%)
Data Table on Mexico - Year-over-year growth 2025-2030 (%)

12.6 Middle East and Africa - Market size and forecast 2025-2030

Chart on Middle East and Africa - Market size and forecast 2025-2030 ($ million)
Data Table on Middle East and Africa - Market size and forecast 2025-2030 ($ million)
Chart on Middle East and Africa - Year-over-year growth 2025-2030 (%)
Data Table on Middle East and Africa - Year-over-year growth 2025-2030 (%)
Chart on Regional Comparison - Middle East and Africa
Data Table on Regional Comparison - Middle East and Africa

12.6.1 Saudi Arabia - Market size and forecast 2025-2030

Chart on Saudi Arabia - Market size and forecast 2025-2030 ($ million)
Data Table on Saudi Arabia - Market size and forecast 2025-2030 ($ million)
Chart on Saudi Arabia - Year-over-year growth 2025-2030 (%)
Data Table on Saudi Arabia - Year-over-year growth 2025-2030 (%)

12.6.2 UAE - Market size and forecast 2025-2030

Chart on UAE - Market size and forecast 2025-2030 ($ million)
Data Table on UAE - Market size and forecast 2025-2030 ($ million)
Chart on UAE - Year-over-year growth 2025-2030 (%)
Data Table on UAE - Year-over-year growth 2025-2030 (%)

12.6.3 South Africa - Market size and forecast 2025-2030

Chart on South Africa - Market size and forecast 2025-2030 ($ million)
Data Table on South Africa - Market size and forecast 2025-2030 ($ million)
Chart on South Africa - Year-over-year growth 2025-2030 (%)
Data Table on South Africa - Year-over-year growth 2025-2030 (%)

12.6.4 Israel - Market size and forecast 2025-2030

Chart on Israel - Market size and forecast 2025-2030 ($ million)
Data Table on Israel - Market size and forecast 2025-2030 ($ million)
Chart on Israel - Year-over-year growth 2025-2030 (%)
Data Table on Israel - Year-over-year growth 2025-2030 (%)

12.6.5 Turkey - Market size and forecast 2025-2030

Chart on Turkey - Market size and forecast 2025-2030 ($ million)
Data Table on Turkey - Market size and forecast 2025-2030 ($ million)
Chart on Turkey - Year-over-year growth 2025-2030 (%)
Data Table on Turkey - Year-over-year growth 2025-2030 (%)

12.7 South America - Market size and forecast 2025-2030

Chart on South America - Market size and forecast 2025-2030 ($ million)
Data Table on South America - Market size and forecast 2025-2030 ($ million)
Chart on South America - Year-over-year growth 2025-2030 (%)
Data Table on South America - Year-over-year growth 2025-2030 (%)
Chart on Regional Comparison - South America
Data Table on Regional Comparison - South America

12.7.1 Brazil - Market size and forecast 2025-2030

Chart on Brazil - Market size and forecast 2025-2030 ($ million)
Data Table on Brazil - Market size and forecast 2025-2030 ($ million)
Chart on Brazil - Year-over-year growth 2025-2030 (%)
Data Table on Brazil - Year-over-year growth 2025-2030 (%)

12.7.2 Argentina - Market size and forecast 2025-2030

Chart on Argentina - Market size and forecast 2025-2030 ($ million)
Data Table on Argentina - Market size and forecast 2025-2030 ($ million)
Chart on Argentina - Year-over-year growth 2025-2030 (%)
Data Table on Argentina - Year-over-year growth 2025-2030 (%)

12.7.3 Chile - Market size and forecast 2025-2030

Chart on Chile - Market size and forecast 2025-2030 ($ million)
Data Table on Chile - Market size and forecast 2025-2030 ($ million)
Chart on Chile - Year-over-year growth 2025-2030 (%)
Data Table on Chile - Year-over-year growth 2025-2030 (%)

12.8 Market opportunity by geography

Market opportunity by geography ($ million)
Data Tables on Market opportunity by geography ($ million)

13. Drivers, Challenges, and Opportunity

13.1 Market drivers

Expansion of 5G infrastructure
Growth driven by industry 4.0 and connected ecosystems
Rise of autonomous connected vehicles

13.2 Market challenges

Raw material price volatility and procurement pressures
Complex signal integrity and high-frequency attenuation
Severe supply chain bottlenecks and lead time delays

13.3 Impact of drivers and challenges

Impact of drivers and challenges in 2025 and 2030

13.4 Market opportunities

Growth of satellite communication networks
Integration of renewable energy grids
Expansion of defense and aerospace systems

14. Competitive Landscape

14.1 Overview

14.2

Overview on criticality of inputs and factors of differentiation

14.3 Landscape disruption

Overview on factors of disruption

14.4 Industry risks

Impact of key risks on business

15. Competitive Analysis

15.1 Companies profiled

Companies covered

15.2 Company ranking index

15.3 Market positioning of companies

Matrix on companies position and classification

15.4 Amphenol Corp.

Amphenol Corp. - Overview
Amphenol Corp. - Business segments
Amphenol Corp. - Key news
Amphenol Corp. - Key offerings
Amphenol Corp. - Segment focus
SWOT

15.5 Belden Inc.

Belden Inc. - Overview
Belden Inc. - Business segments
Belden Inc. - Key news
Belden Inc. - Key offerings
Belden Inc. - Segment focus
SWOT

15.6 Habia Cable AB

Habia Cable AB - Overview
Habia Cable AB - Product / Service
Habia Cable AB - Key offerings
SWOT

15.7 HIROSE ELECTRIC Co. Ltd.

HIROSE ELECTRIC Co. Ltd. - Overview
HIROSE ELECTRIC Co. Ltd. - Business segments
HIROSE ELECTRIC Co. Ltd. - Key offerings
HIROSE ELECTRIC Co. Ltd. - Segment focus
SWOT

15.8 HUBER SUHNER AG

HUBER SUHNER AG - Overview
HUBER SUHNER AG - Business segments
HUBER SUHNER AG - Key offerings
HUBER SUHNER AG - Segment focus
SWOT

15.9 Leoni AG

Leoni AG - Overview
Leoni AG - Product / Service
Leoni AG - Key offerings
SWOT

15.10 Molex LLC

Molex LLC - Overview
Molex LLC - Product / Service
Molex LLC - Key offerings
SWOT

15.11 Nexans SA

Nexans SA - Overview
Nexans SA - Business segments
Nexans SA - Key offerings
Nexans SA - Segment focus
SWOT

15.12 Prysmian S.p.A

Prysmian S.p.A - Overview
Prysmian S.p.A - Product / Service
Prysmian S.p.A - Key offerings
SWOT

15.13 Radiall SA

Radiall SA - Overview
Radiall SA - Product / Service
Radiall SA - Key offerings
SWOT

15.14 Samtec Inc.

Samtec Inc. - Overview
Samtec Inc. - Product / Service
Samtec Inc. - Key offerings
SWOT

15.15 Smiths Interconnect Group Ltd

Smiths Interconnect Group Ltd - Overview
Smiths Interconnect Group Ltd - Product / Service
Smiths Interconnect Group Ltd - Key offerings
SWOT

15.16 Sumitomo Electric Industries

Sumitomo Electric Industries - Overview
Sumitomo Electric Industries - Business segments
Sumitomo Electric Industries - Key news
Sumitomo Electric Industries - Key offerings
Sumitomo Electric Industries - Segment focus
SWOT

15.17 TE Connectivity plc

TE Connectivity plc - Overview
TE Connectivity plc - Business segments
TE Connectivity plc - Key offerings
TE Connectivity plc - Segment focus
SWOT

15.18 W. L. Gore and Associates

W. L. Gore and Associates - Overview
W. L. Gore and Associates - Product / Service
W. L. Gore and Associates - Key offerings
SWOT

16. Appendix

16.1 Scope of the report

Market definition
Objectives
Notes and caveats

16.2 Inclusions and exclusions checklist

Inclusions checklist
Exclusions checklist

16.3 Currency conversion rates for US$

16.4 Research methodology

16.5 Data procurement

Information sources

16.6 Data validation

16.7 Validation techniques employed for market sizing

16.8 Data synthesis

16.9 360 degree market analysis

16.10 List of abbreviations

Research Methodology

Technavio presents a detailed picture of the market by way of study, synthesis, and summation of data from multiple sources. The analysts have presented the various facets of the market with a particular focus on identifying the key industry influencers. The data thus presented is comprehensive, reliable, and the result of extensive research, both primary and secondary.

INFORMATION SOURCES

Primary sources

  • Manufacturers and suppliers
  • Channel partners
  • Industry experts
  • Strategic decision makers

Secondary sources

  • Industry journals and periodicals
  • Government data
  • Financial reports of key industry players
  • Historical data
  • Press releases

DATA ANALYSIS

Data Synthesis

  • Collation of data
  • Estimation of key figures
  • Analysis of derived insights

Data Validation

  • Triangulation with data models
  • Reference against proprietary databases
  • Corroboration with industry experts

REPORT WRITING

Qualitative

  • Market drivers
  • Market challenges
  • Market trends
  • Five forces analysis

Quantitative

  • Market size and forecast
  • Market segmentation
  • Geographical insights
  • Competitive landscape

Interested in this report?

Get your sample now to see our research methodology and insights!

Download Now

Frequently Asked Questions

Antenna Cable market growth will increase by USD 1890.8 million during 2026-2030.

The Antenna Cable market is expected to grow at a CAGR of 5% during 2026-2030.

Antenna Cable market is segmented by Application (Telecommunication, Radio frequency transfer, Internet data transfer) End-user (Commercial industries, Military and defense, Others) Product type (Coaxial cables, Fiber optic and hybrid FTTA, Waveguides, Twin-lead/ribbon cables)

Amphenol Corp., Axon Cable, Belden Inc., Cinch Connectivity Solutions, Habia Cable AB, Harbour Industries LLC, HIROSE ELECTRIC Co. Ltd., HUBER SUHNER AG, Junkosha Co. Ltd., Leoni AG, Molex LLC, Nexans SA, Prysmian S.p.A, Radiall SA, Rosenberger Hochfrequenztechnik, Samtec Inc., Smiths Interconnect Group Ltd, SPINNER GmbH, Sumitomo Electric Industries, TE Connectivity plc, W. L. Gore and Associates are a few of the key vendors in the Antenna Cable market.

APAC will register the highest growth rate of 46.4% among the other regions. Therefore, the Antenna Cable market in APAC is expected to garner significant business opportunities for the vendors during the forecast period.

China, Japan, India, South Korea, Australia, Indonesia, Germany, UK, France, Italy, Spain, The Netherlands, US, Canada, Mexico, Saudi Arabia, UAE, South Africa, Israel, Turkey, Brazil, Argentina, Chile

  • Expansion of 5G infrastructure is the driving factor this market.

The Antenna Cable market vendors should focus on grabbing business opportunities from the Application segment as it accounted for the largest market share in the base year.
RIA - Research AI Assistant
Ask RIA
