
Automotive Engineering Service Providers (ESP) Market Size 2025-2029
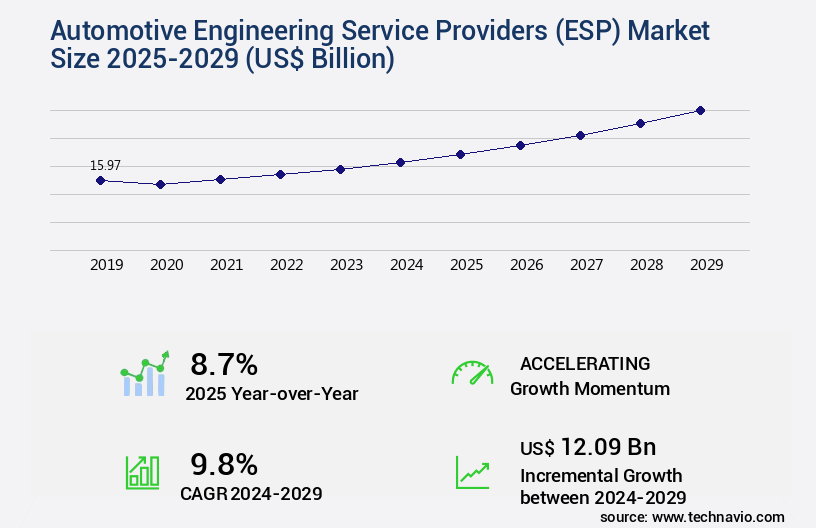
The automotive engineering service providers (esp) market size is valued to increase USD 12.09 billion, at a CAGR of 9.8% from 2024 to 2029. Increasing digitization and electrification of automobiles will drive the automotive engineering service providers (esp) market.
Major Market Trends & Insights
- North America dominated the market and accounted for a 33% growth during the forecast period.
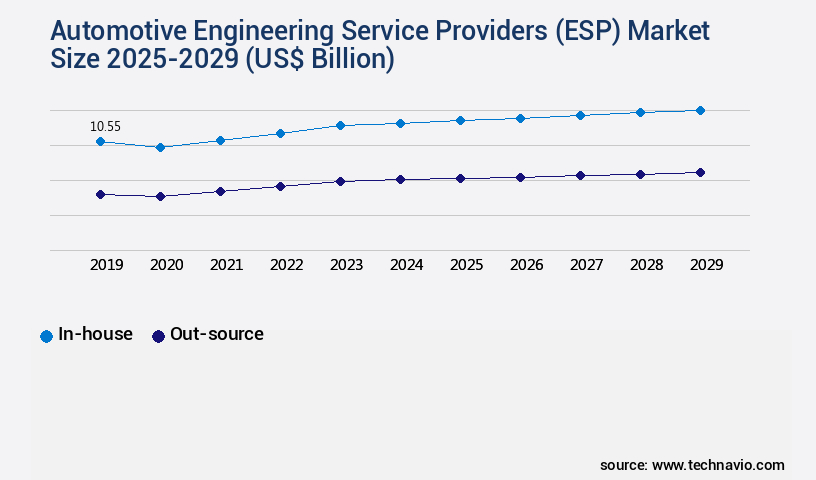
- By Application - Passenger Vehicles segment was valued at USD 10.55 billion in 2023
- By Product Type - Powertrain segment accounted for the largest market revenue share in 2023
Market Size & Forecast
- Market Opportunities: USD 102.38 billion
- Market Future Opportunities: USD 12.09 billion
- CAGR from 2024 to 2029 : 9.8%
Market Summary
- The market experiences continuous expansion, driven by the increasing digitization and electrification of automobiles. This evolution necessitates advanced engineering solutions to meet the complex demands of modern vehicles. Autonomous vehicle development is a significant trend shaping the ESP market. Engineering service providers play a pivotal role in designing, testing, and validating the intricate systems required for self-driving cars. Additionally, the rise of electric vehicles necessitates expertise in battery technology, thermal management, and vehicle dynamics.
- Cost pressure on Original Equipment Manufacturers (OEMs) is another critical factor fueling the growth of the ESP market. Outsourcing engineering services to specialized providers allows OEMs to reduce costs, focus on core competencies, and accelerate time-to-market. However, this trend also presents challenges, such as ensuring data security and maintaining intellectual property rights. In conclusion, the ESP market is poised for continued growth, driven by the increasing complexity of automobiles and the need for cost-effective engineering solutions. Engineering service providers must stay abreast of emerging technologies and trends to remain competitive and deliver value to their clients.
What will be the Size of the Automotive Engineering Service Providers (ESP) Market during the forecast period?
Get Key Insights on Market Forecast (PDF) Request Free Sample
How is the Automotive Engineering Service Providers (ESP) Market Segmented ?
The automotive engineering service providers (esp) industry research report provides comprehensive data (region-wise segment analysis), with forecasts and estimates in "USD billion" for the period 2025-2029, as well as historical data from 2019-2023 for the following segments.
- Application
- Passenger Vehicles
- Commercial Vehicles
- Product Type
- Powertrain
- Complete vehicle
- Electrical/electronics
- Others
- Type
- 2-Channel
- 3-Channel
- 4-Channel
- Delivery Model
- Onsite
- Offsite/Outsourced
- Company Size
- Small Firms
- Large Providers
- Geography
- North America
- US
- Canada
- Europe
- France
- Germany
- Italy
- Spain
- UK
- Middle East and Africa
- UAE
- APAC
- China
- India
- Japan
- South Korea
- South America
- Brazil
- Rest of World (ROW)
- North America
By Application Insights
The passenger vehicles segment is estimated to witness significant growth during the forecast period.
In the dynamic and complex landscape of the automotive industry, the role of Automotive Engineering Service Providers (ESPs) continues to evolve. These entities offer a range of specialized services, from regulatory compliance audits and quality control procedures to inventory management systems and automotive data analytics. ESPs ensure vehicle network security, manage service contracts, and employ predictive maintenance models, digital service documentation, and safety standards adherence. Data security protocols and telematics data integration are crucial components, along with sensor data processing and sustainable maintenance practices. Technical training programs and performance improvement metrics are essential for ESPs, enabling them to offer advanced services like collision repair estimation, emission control systems, and automotive repair software.
Warranty claims management, vehicle lifecycle management, and remote diagnostics platforms are other essential offerings. ESPs optimize repair processes through specialized tool calibration, mobile service solutions, fleet maintenance scheduling, and efficiency optimization tools. Compliance certification, engine performance tuning, environmental impact assessments, and automated testing equipment are further areas of expertise. According to recent market research, the global automotive engineering services market is projected to reach a value of USD120 billion by 2026, growing at a CAGR of 5.5% during the forecast period. This growth underscores the importance of ESPs in the evolving automotive industry.
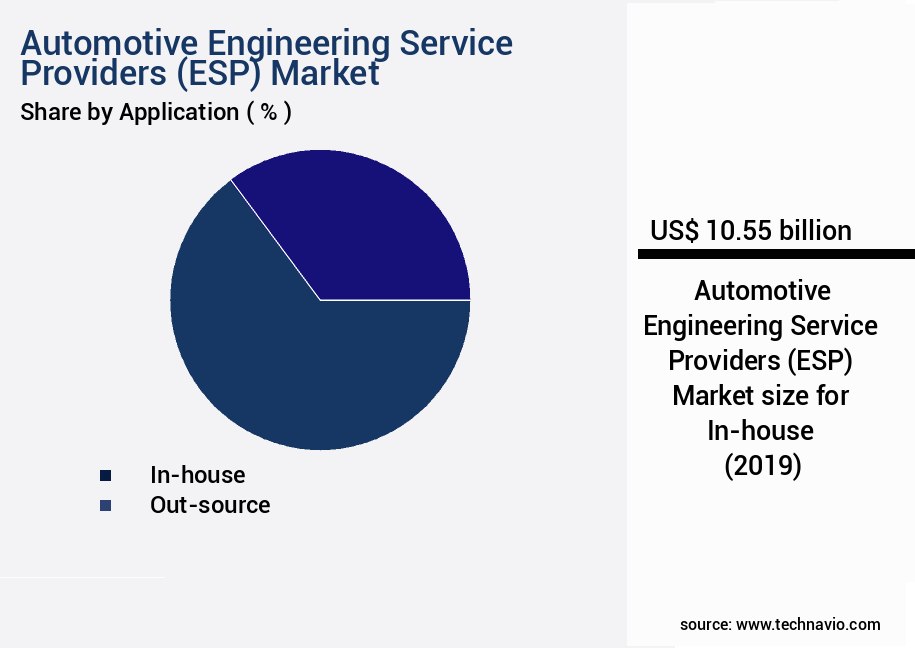
The Passenger Vehicles segment was valued at USD 10.55 billion in 2019 and showed a gradual increase during the forecast period.
Regional Analysis
North America is estimated to contribute 33% to the growth of the global market during the forecast period.Technavio's analysts have elaborately explained the regional trends and drivers that shape the market during the forecast period.

See How Automotive Engineering Service Providers (ESP) Market Demand is Rising in North America Request Free Sample
The European the market is characterized by its advanced state of development, driven by the presence of leading global automakers, including Mercedes-Benz AG, Volkswagen AG, BMW AG, and AB Volvo. These companies are at the forefront of the automotive industry, consistently introducing advanced technologies. Major contributors to the market are countries such as France, Germany, Spain, and the UK, which manufacture and market numerous high-end luxury and premium vehicles.
Key players, such as AVL List, EDAG, IAV GmbH, and Bertrandt, have established automotive research and development labs in Europe, further bolstering the market.
Market Dynamics
Our researchers analyzed the data with 2024 as the base year, along with the key drivers, trends, and challenges. A holistic analysis of drivers will help companies refine their marketing strategies to gain a competitive advantage.
The market is experiencing significant growth due to the increasing demand for advanced technology integration in the automotive industry. ESPs play a crucial role in enabling automotive manufacturers and fleet operators to optimize their repair processes, enhance predictive maintenance capabilities, and ensure regulatory compliance. One of the key areas of focus for ESPs is the integration of automotive repair software with telematics data for fleet management. This enables real-time monitoring of vehicle performance and predictive maintenance algorithm deployment, reducing downtime and maintenance costs. Sensor data analysis for vehicle diagnostics is another important area, with ESPs utilizing remote diagnostics platforms to provide efficient and effective service. ESPs also provide automated testing equipment for quality control, implementation of repair process optimization techniques, and warranty claims management software to streamline customer relationship management in the automotive sector. Inventory management for auto parts is another essential service, with mobile service solutions for technicians ensuring efficient and convenient access to necessary tools and resources. Specialized tool calibration processes are critical for maintaining performance improvement metrics and ensuring quality control procedures compliance. ESPs also prioritize safety standards adherence in automotive and implement digital service documentation software to enhance transparency and accountability. Data security protocols for automotive data are a top priority for ESPs, with regulatory compliance audits for services ensuring adherence to environmental impact assessment methods and data privacy regulations. Efficiency optimization tools implementation and performance improvement metrics dashboards further enhance the value proposition of ESPs in the automotive industry.
What are the key market drivers leading to the rise in the adoption of Automotive Engineering Service Providers (ESP) Industry?
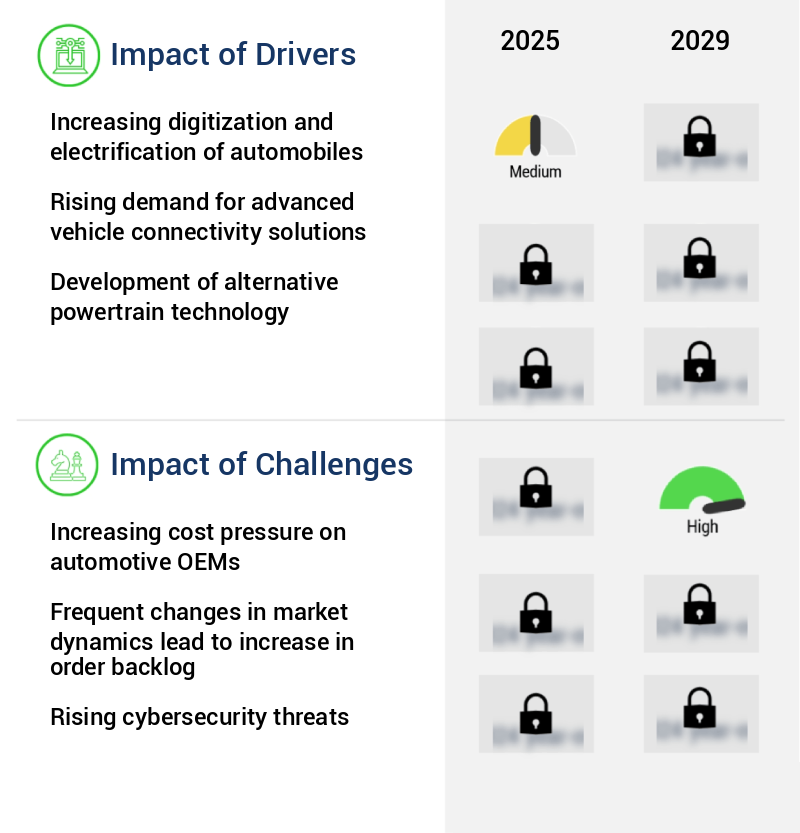
- The significant trend towards digitization and electrification in the automobile industry is the primary market driver, leading to innovation and growth in this sector.
- The global automotive industry undergoes continuous transformation with the integration of advanced technologies, leading to the replacement of mechanical components with electronic systems in modern vehicles. This shift is driven by the increasing demand for real-time information to drivers, fuel efficiency, lower emissions, enhanced safety, and improved driving experiences. Automotive Original Equipment Manufacturers (OEMs) are responding to this trend by introducing innovative features in their vehicles to differentiate themselves in the competitive market. Advanced technologies such as adaptive cruise control, lane departure warnings, and automated parking are no longer limited to luxury cars but are increasingly being incorporated into mid-range and even low-end models.
- This dynamic industry landscape underscores the importance of staying informed and agile for businesses seeking to succeed in the automotive sector.
What are the market trends shaping the Automotive Engineering Service Providers (ESP) Industry?
- The development of autonomous vehicles represents a significant market trend in transportation technology. Autonomous vehicle technology is poised for growth and innovation.
- Autonomous cars, also referred to as self-driving or automated vehicles, are revolutionizing the automotive industry through advanced sensing technologies such as radar, GPS, and ADAS. These vehicles navigate roads without human intervention, utilizing a combination of artificial intelligence and machine learning algorithms. The development of autonomous cars is a collaborative effort between automotive companies and technology firms, including Volvo, Volkswagen, Audi, BMW, General Motors, Ford, Apple Inc., and Alphabet Inc.'s Google. This partnership enables the integration of sophisticated AI systems into vehicles, enhancing their performance and capabilities. The autonomous car market is characterized by continuous innovation and evolution, with companies striving to improve safety, efficiency, and convenience.
- For instance, Volvo's City Safety technology and BMW's Active Safety System are examples of advanced driver assistance systems (ADAS) that pave the way for autonomous driving. These advancements underscore the industry's commitment to creating a future where vehicles can navigate roads safely and efficiently, without human intervention.
What challenges does the Automotive Engineering Service Providers (ESP) Industry face during its growth?
- The automotive original equipment manufacturers (OEMs) face significant cost pressure, which represents a major challenge to the industry's growth trajectory.
- In the automotive industry value chain, Original Equipment Manufacturers (OEMs) face significant warranty costs and pricing pressure from consumers. The integration of advanced technologies in vehicles has led to a shift in bargaining power for certain equipment, technologies, and services. OEMs encounter substantial cost pressures due to the regulatory environment's dynamism and consumer demands. A comprehensive analysis reveals that OEMs have been absorbing profitability losses to cater to price-sensitive consumers, without transferring excessive liability and risk to other stakeholders, such as Tier-1 suppliers, component manufacturers, and service providers.
- This trend underscores the evolving nature of the automotive industry and the ongoing challenges for OEMs in managing costs and maintaining competitiveness.
Exclusive Technavio Analysis on Customer Landscape
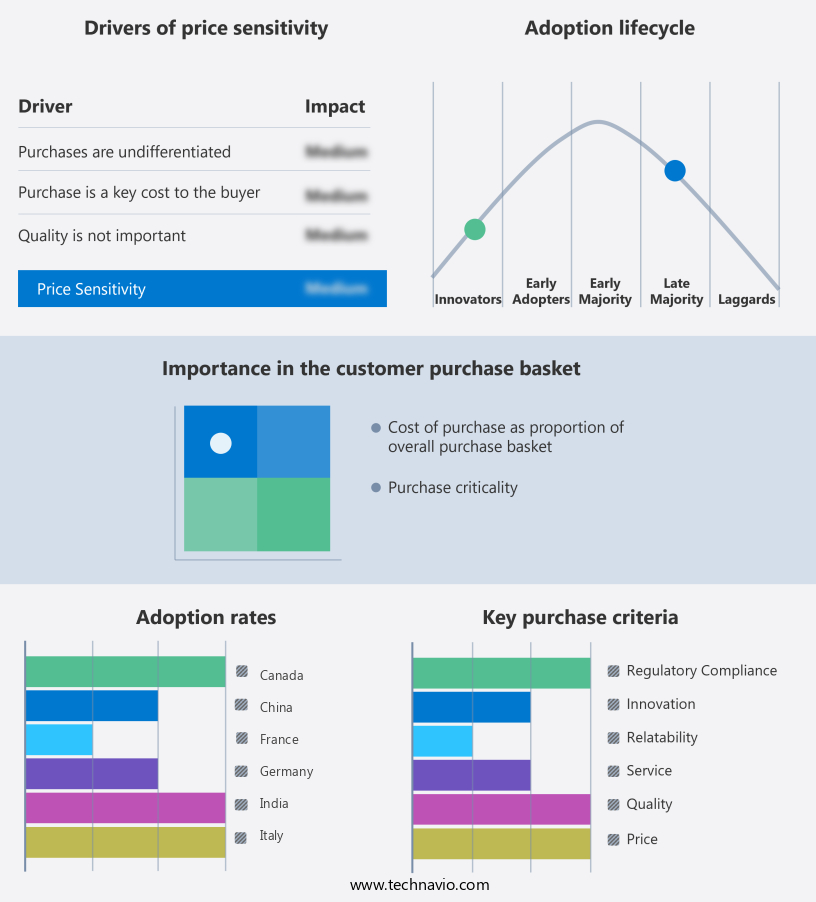
The automotive engineering service providers (esp) market forecasting report includes the adoption lifecycle of the market, covering from the innovator's stage to the laggard's stage. It focuses on adoption rates in different regions based on penetration. Furthermore, the automotive engineering service providers (esp) market report also includes key purchase criteria and drivers of price sensitivity to help companies evaluate and develop their market growth analysis strategies.
Customer Landscape of Automotive Engineering Service Providers (ESP) Industry
Competitive Landscape
Companies are implementing various strategies, such as strategic alliances, automotive engineering service providers (esp) market forecast, partnerships, mergers and acquisitions, geographical expansion, and product/service launches, to enhance their presence in the industry.
Adecco Group AG - This company specializes in automotive engineering services, facilitating the creation of digital products and the modernization of manufacturing processes for clients. They also introduce innovative services tailored to emerging user behaviors.
The industry research and growth report includes detailed analyses of the competitive landscape of the market and information about key companies, including:
- Adecco Group AG
- Altair Engineering Inc.
- ASM Technologies Ltd.
- AVL List GmbH
- Belcan LLC
- Bertrandt AG
- Capgemini Services SAS
- Contechs
- EDAG Group
- EPAM Systems Inc.
- FEV Group GmbH
- HCL Technologies Ltd.
- Hitachi Ltd.
- IAV GmbH
- KPIT Technologies Ltd.
- L and T Technology Services Ltd.
- Magna International Inc.
- Mahindra and Mahindra Ltd.
- Ricardo Plc
Qualitative and quantitative analysis of companies has been conducted to help clients understand the wider business environment as well as the strengths and weaknesses of key industry players. Data is qualitatively analyzed to categorize companies as pure play, category-focused, industry-focused, and diversified; it is quantitatively analyzed to categorize companies as dominant, leading, strong, tentative, and weak.
Recent Development and News in Automotive Engineering Service Providers (ESP) Market
- In January 2024, global automotive engineering services provider, AVL List GmbH, announced the launch of its new Advanced Engineering Services division, focusing on electric vehicle (EV) technology and digitalization (AVL press release). This expansion underscores the growing demand for EV engineering expertise.
- In March 2024, Magna International, a leading automotive supplier, entered into a strategic partnership with Intel to develop and produce autonomous driving systems (Intel press release). This collaboration combines Magna's engineering expertise with Intel's technology, positioning them competitively in the autonomous vehicle market.
- In April 2025, Continental AG, a major automotive technology company, acquired Automotive Lighting from Hella for €3.3 billion (Continental AG press release). This acquisition strengthens Continental's position in the automotive lighting market and broadens its portfolio of advanced driver assistance systems (ADAS).
- In May 2025, the European Union approved the Horizon Europe research and innovation program, including €2.4 billion for the Clean Hydrogen and Fuel Cell Technologies challenge (European Commission press release). This funding will support the development of hydrogen fuel cell technology, creating opportunities for automotive engineering service providers in the European market.
Dive into Technavio's robust research methodology, blending expert interviews, extensive data synthesis, and validated models for unparalleled Automotive Engineering Service Providers (ESP) Market insights. See full methodology.
|
Market Scope |
|
|
Report Coverage |
Details |
|
Page number |
210 |
|
Base year |
2024 |
|
Historic period |
2019-2023 |
|
Forecast period |
2025-2029 |
|
Growth momentum & CAGR |
Accelerate at a CAGR of 9.8% |
|
Market growth 2025-2029 |
USD 12.09 billion |
|
Market structure |
Fragmented |
|
YoY growth 2024-2025(%) |
8.7 |
|
Key countries |
US, China, Germany, Canada, India, South Korea, France, Japan, Italy, Brazil, UAE, UK, and Spain |
|
Competitive landscape |
Leading Companies, Market Positioning of Companies, Competitive Strategies, and Industry Risks |
Research Analyst Overview
- The market continues to evolve, driven by advancements in technology and shifting industry trends. Quality control procedures and regulatory compliance audits are increasingly important, as ESPs strive to meet stringent safety standards and data security protocols. An inventory management system that integrates telematics data and sensor data processing is essential for optimizing efficiency and reducing downtime. For instance, a leading ESP implemented a predictive maintenance model, resulting in a 20% reduction in unscheduled repairs and a 15% increase in customer satisfaction. The industry is expected to grow at a robust rate, with automotive data analytics, vehicle network security, and digital service documentation playing key roles.
- Service contract management, warranty claims management, and vehicle lifecycle management are also critical areas of focus. Performance improvement metrics, collision repair estimation, and emission control systems are integral to maintaining regulatory compliance and ensuring customer satisfaction. ESPs are investing in technical training programs and automated testing equipment to enhance their capabilities. They are also integrating vehicle diagnostics software, remote diagnostics platforms, and repair process optimization tools to streamline operations and provide mobile service solutions. Fleet maintenance scheduling, efficiency optimization tools, compliance certification, engine performance tuning, environmental impact assessments, and specialized tool calibration are other areas of growth.
- The market is expected to grow at a significant rate, with sustainability and safety being key priorities.
What are the Key Data Covered in this Automotive Engineering Service Providers (ESP) Market Research and Growth Report?
-
What is the expected growth of the Automotive Engineering Service Providers (ESP) Market between 2025 and 2029?
-
USD 12.09 billion, at a CAGR of 9.8%
-
-
What segmentation does the market report cover?
-
The report is segmented by Application (Passenger Vehicles and Commercial Vehicles), Product Type (Powertrain, Complete vehicle, Electrical/electronics, and Others), Geography (Europe, APAC, North America, South America, and Middle East and Africa), Type (2-Channel, 3-Channel, and 4-Channel), Delivery Model (Onsite and Offsite/Outsourced), and Company Size (Small Firms and Large Providers)
-
-
Which regions are analyzed in the report?
-
Europe, APAC, North America, South America, and Middle East and Africa
-
-
What are the key growth drivers and market challenges?
-
Increasing digitization and electrification of automobiles, Increasing cost pressure on automotive OEMs
-
-
Who are the major players in the Automotive Engineering Service Providers (ESP) Market?
-
Adecco Group AG, Altair Engineering Inc., ASM Technologies Ltd., AVL List GmbH, Belcan LLC, Bertrandt AG, Capgemini Services SAS, Contechs, EDAG Group, EPAM Systems Inc., FEV Group GmbH, HCL Technologies Ltd., Hitachi Ltd., IAV GmbH, KPIT Technologies Ltd., L and T Technology Services Ltd., Magna International Inc., Mahindra and Mahindra Ltd., and Ricardo Plc
-
Market Research Insights
- The automotive engineering service providers market is a dynamic and ever-evolving landscape. Two key areas of focus are fuel efficiency improvement and software-defined vehicles. Service providers employ advanced techniques to optimize vehicle performance, reducing operational costs for clients by up to 15%. Furthermore, the industry anticipates a 12% annual growth rate in the coming years, driven by the increasing adoption of connected car services and real-time performance monitoring. For instance, a leading service provider successfully implemented inventory optimization techniques, resulting in a 10% reduction in repair costs for their clients. By leveraging data visualization dashboards and advanced driver-assistance systems, they ensured efficient service center operations and improved customer satisfaction metrics.
- The market continues to innovate, with a growing emphasis on autonomous vehicle technology, technician skill development, and downtime minimization. Service providers are also integrating engine diagnostics technology, parts ordering efficiency, and advanced materials testing to enhance their offerings. Ultimately, the market is geared towards maximizing vehicle uptime and providing data-driven decision-making tools for clients.
We can help! Our analysts can customize this automotive engineering service providers (esp) market research report to meet your requirements.
 RIA -
RIA - 
