Autonomous AI In Smart Homes And IoT Market Size 2025-2029
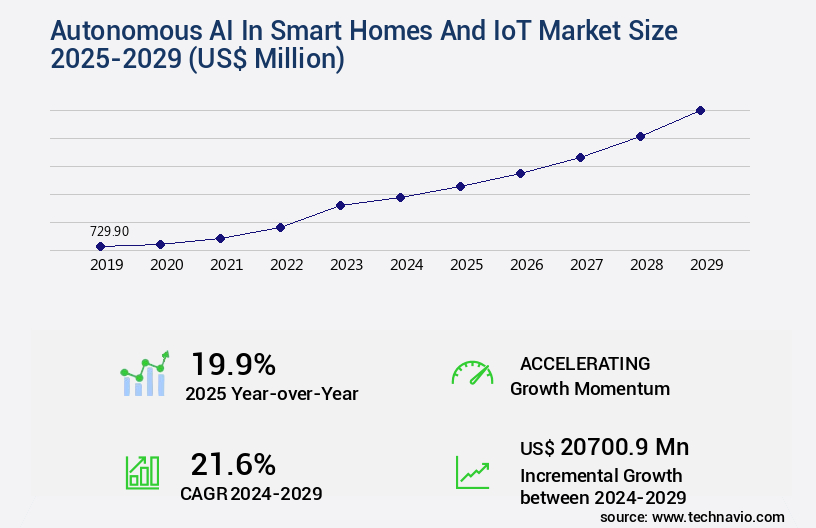
The autonomous ai in smart homes and iot market size is valued to increase by USD 20.7 billion, at a CAGR of 21.6% from 2024 to 2029. Increasing demand for enhanced convenience and personalization will drive the autonomous ai in smart homes and iot market.
Major Market Trends & Insights
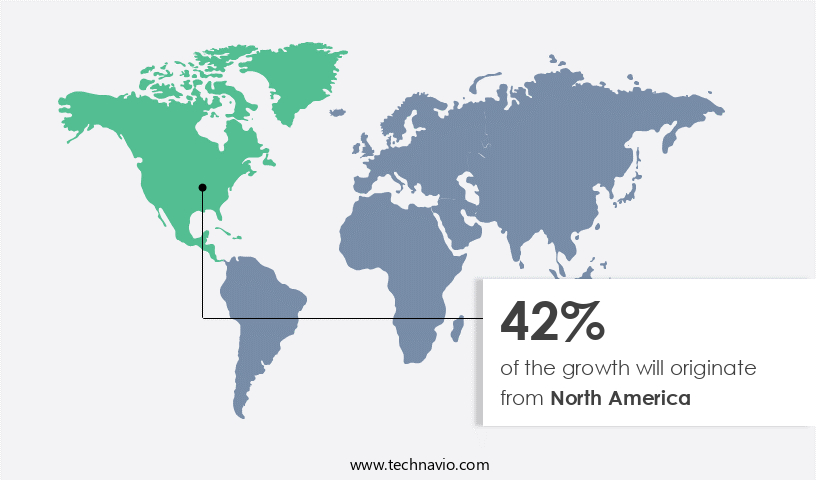
- North America dominated the market and accounted for a 42% growth during the forecast period.
- By Component - Hardware segment was valued at USD 368.40 billion in 2023
- By Technology - Machine learning segment accounted for the largest market revenue share in 2023
Market Size & Forecast
- Market Opportunities: USD 4.00 million
- Market Future Opportunities: USD 20700.90 million
- CAGR from 2024 to 2029 : 21.6%
Market Summary
- In the realm of smart homes and the Internet of Things (IoT), Autonomous AI is a pivotal technological force shaping the future. With the global market valued at USD151.4 billion in 2020, this sector's growth is driven by the increasing demand for enhanced convenience and personalization. Autonomous AI, with its capabilities in hyper-personalization and adaptive learning, caters to users' unique preferences and behaviors. However, this evolution brings challenges, particularly in addressing data privacy and security concerns. As the technology becomes more integrated into our daily lives, ensuring robust safeguards becomes essential. The future of Autonomous AI in smart homes and IoT lies in its ability to seamlessly blend functionality with privacy, offering users a more intuitive and secure living experience.
What will be the Size of the Autonomous AI In Smart Homes And IoT Market during the forecast period?

Get Key Insights on Market Forecast (PDF) Request Free Sample
How is the Autonomous AI In Smart Homes And IoT Market Segmented ?
The autonomous ai in smart homes and iot industry research report provides comprehensive data (region-wise segment analysis), with forecasts and estimates in "USD million" for the period 2025-2029, as well as historical data from 2019-2023 for the following segments.
- Component
- Hardware
- Software
- Services
- Technology
- Machine learning
- NLP
- Computer vision
- Predictive analytics
- Others
- Application
- Voice assistance and command recognition
- Security and surveillance
- Energy management
- Healthcare and assisted living
- Others
- Connectivity
- Wireless protocols
- Wired protocols
- End-user
- Residential
- Commercial
- Industrial
- Geography
- North America
- Europe
- APAC
- China
- India
- Japan
- South Korea
- Rest of World (ROW)
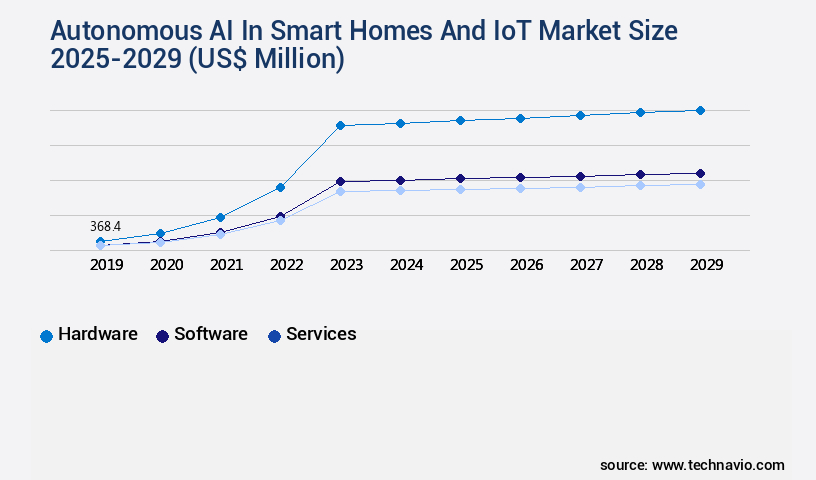
By Component Insights
The hardware segment is estimated to witness significant growth during the forecast period.
The markets continue to evolve, with a significant focus on user experience optimization and environmental monitoring. The integration of AI-powered home security, anomaly detection systems, and energy management systems has revolutionized home automation, enabling real-time data processing and cybersecurity measures. Smart home automation protocols, such as Zigbee, Z-Wave, and Bluetooth Low Energy (BLE), facilitate device interoperability, allowing voice-activated assistants and intelligent home assistants to control various smart appliances and systems.
Edge computing architecture and machine learning algorithms enable adaptive learning systems and natural language processing for seamless user interface design. IoT device integration and sensor data integration are crucial components, ensuring data encryption methods and network security protocols protect user privacy. Smart lighting control, automated HVAC systems, and smart thermostat control optimize home energy efficiency, while AI-driven personalization enhances the user experience. Computer vision applications and real-time data processing enable advanced features like facial recognition and object detection. Overall, the market continues to grow, offering innovative solutions for home security, comfort, and convenience.

Request Free Sample
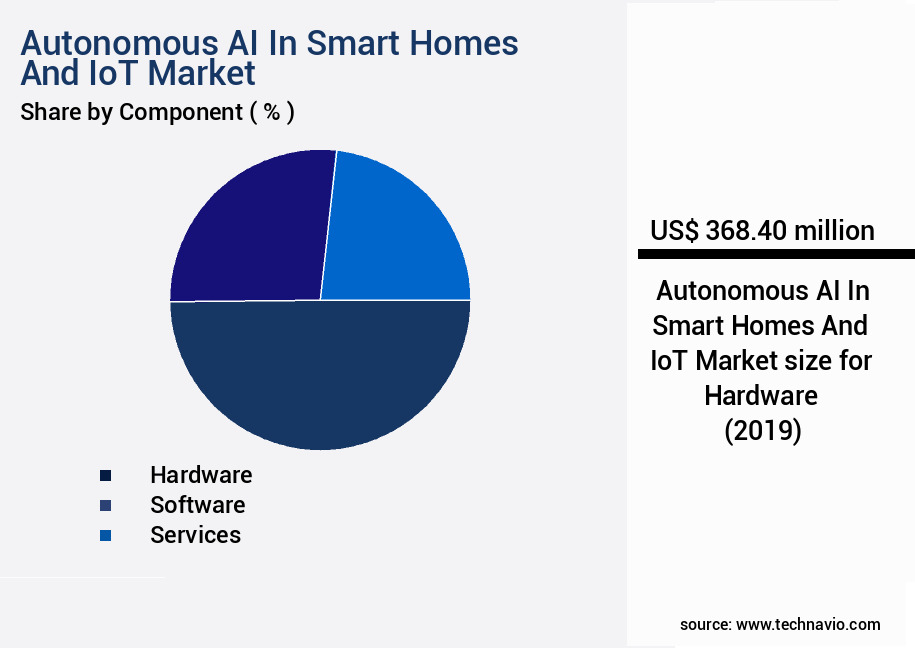
The Hardware segment was valued at USD 368.40 billion in 2019 and showed a gradual increase during the forecast period.

Request Free Sample
Regional Analysis
North America is estimated to contribute 42% to the growth of the global market during the forecast period.Technavio's analysts have elaborately explained the regional trends and drivers that shape the market during the forecast period.

See How Autonomous AI In Smart Homes And IoT Market Demand is Rising in North America Request Free Sample
The market is witnessing significant growth, with North America leading the charge due to high consumer disposable income, rapid technological adoption, and a robust infrastructure supporting advanced connectivity solutions. The region's presence of key industry players and strong venture capital landscape further encourages innovation and the development of new solutions. Consumer demand for convenience, energy efficiency, and enhanced security features fuels the adoption of smart home devices and autonomous AI systems. In February 2024, Google introduced expanded functionalities for its Nest Hub devices, further integrating autonomous AI capabilities for personalized user experiences and predictive home management. The integration of AI and IoT technologies is expected to revolutionize various industries, including healthcare, transportation, and energy, offering significant benefits such as improved efficiency, cost savings, and enhanced customer experiences.
Market Dynamics
Our researchers analyzed the data with 2024 as the base year, along with the key drivers, trends, and challenges. A holistic analysis of drivers will help companies refine their marketing strategies to gain a competitive advantage.
The market is experiencing rapid growth as homeowners seek to optimize energy consumption and enhance security through advanced technology. AI-driven smart home energy optimization strategies are becoming increasingly popular, utilizing machine learning algorithms to analyze real-time data and adjust energy usage accordingly. However, integrating AI into existing smart home security systems presents challenges, requiring careful consideration of interoperability and data privacy and security best practices. Scalable cloud-based platforms for smart home management offer a solution, enabling real-time data processing for efficient energy management and enhancing user experience for AI-powered home assistants. AI model accuracy and reliability are crucial in home automation, ensuring effective user authentication methods and robust network security protocols are developed.
Cybersecurity measures for protecting smart home networks are essential, with AI-based anomaly detection systems providing an effective defense against potential threats. Developing home automation software development lifecycle best practices is also important, including integration of multiple smart home device ecosystems and user interface design principles that prioritize ease of use and accessibility. Data encryption methods are vital for enhancing smart home security, ensuring privacy and security in connected home ecosystems. AI algorithms for adaptive learning in smart home systems enable predictive maintenance for home appliances, optimizing energy consumption and reducing maintenance costs. As the market for autonomous AI in smart homes and IoT continues to evolve, it is essential to prioritize both functionality and security to meet the demands of consumers.

What are the key market drivers leading to the rise in the adoption of Autonomous AI In Smart Homes And IoT Industry?
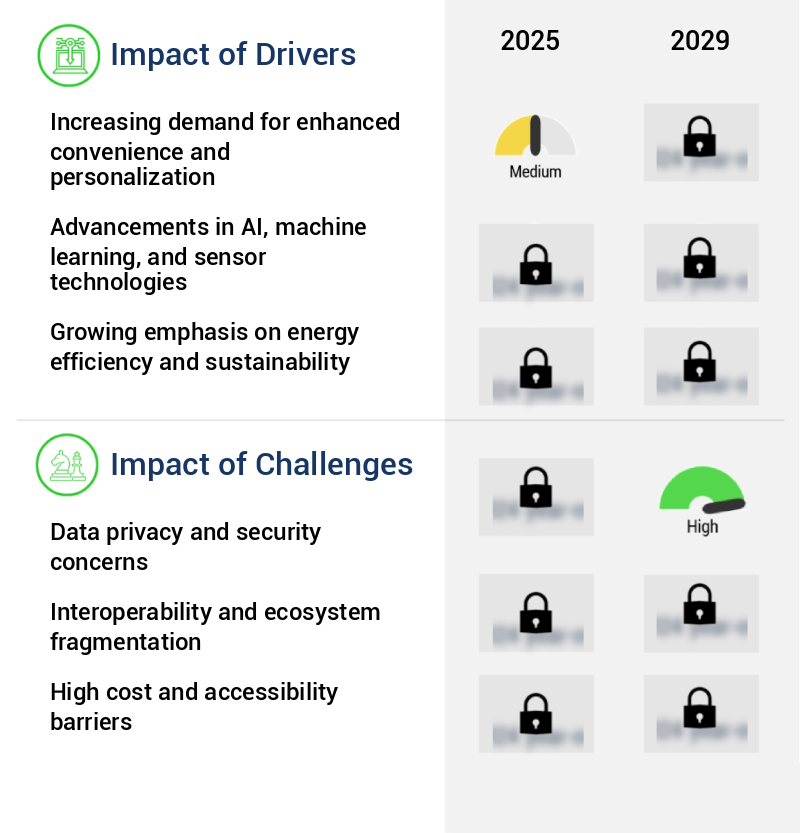
- The market is propelled forward by the escalating need for heightened convenience and customization.
- The autonomous AI market in smart homes and IoT is experiencing a significant surge due to the increasing preference for convenience, personalization, and seamless integration in daily life. Modern consumers seek solutions that automate tasks, anticipate needs, and adapt to preferences without manual intervention. This trend is driving the adoption of autonomous AI systems, which learn from user behavior and environmental data to optimize comfort, security, and energy consumption. For instance, autonomous thermostats no longer maintain a set temperature but learn occupancy patterns and individual comfort thresholds, adjusting proactively to minimize energy waste while maximizing inhabitant satisfaction.
- According to recent studies, the global market for autonomous AI in smart homes and IoT is expected to reach a robust size, with smart thermostats holding a substantial market share. Another report indicates that the number of IoT devices in use worldwide is projected to reach billions by 2025, further fueling the growth of this market.
What are the market trends shaping the Autonomous AI In Smart Homes And IoT Industry?
- In the realm of marketing, hyper-personalization and adaptive learning are emerging trends. These approaches tailor content and experiences to individual consumers based on their preferences and behaviors.
- The market is experiencing a robust evolution, marked by an increasing emphasis on hyper-personalization. Advanced machine learning algorithms and real-time data analysis are driving this trend, enabling smart home systems to adapt to individual user preferences and anticipate needs. This goes beyond simple rule-based automation, resulting in truly adaptive living spaces. In North America, companies are heavily investing in AI-powered predictive analytics for energy management.
- Europe is another significant region for the advancement of hyper-personalized security and comfort systems. The integration of AI models that continuously refine their understanding of user behavior, environmental factors, and external stimuli is leading to a surge in personalized experiences within the smart home and IoT ecosystem.
What challenges does the Autonomous AI In Smart Homes And IoT Industry face during its growth?
- Data privacy and security concerns represent a significant challenge to the industry's growth, necessitating robust measures to protect sensitive information and maintain trust with customers.
- The integration of autonomous AI in smart homes and the Internet of Things (IoT) has led to significant advancements, enabling devices to make independent decisions and collect vast amounts of personal data. This data includes daily routines, energy consumption patterns, voice commands, and biometric information. Ensuring the confidentiality, integrity, and availability of this sensitive data is a critical concern for consumers, regulators, and manufacturers in North America, Europe, and the Asia-Pacific region. In North America, consumer apprehension regarding data breaches and misuse of personal information by smart home devices remains a significant challenge. The European Union's General Data Protection Regulation (GDPR) and similar regulations in other regions underscore the importance of data privacy and security.
Exclusive Technavio Analysis on Customer Landscape
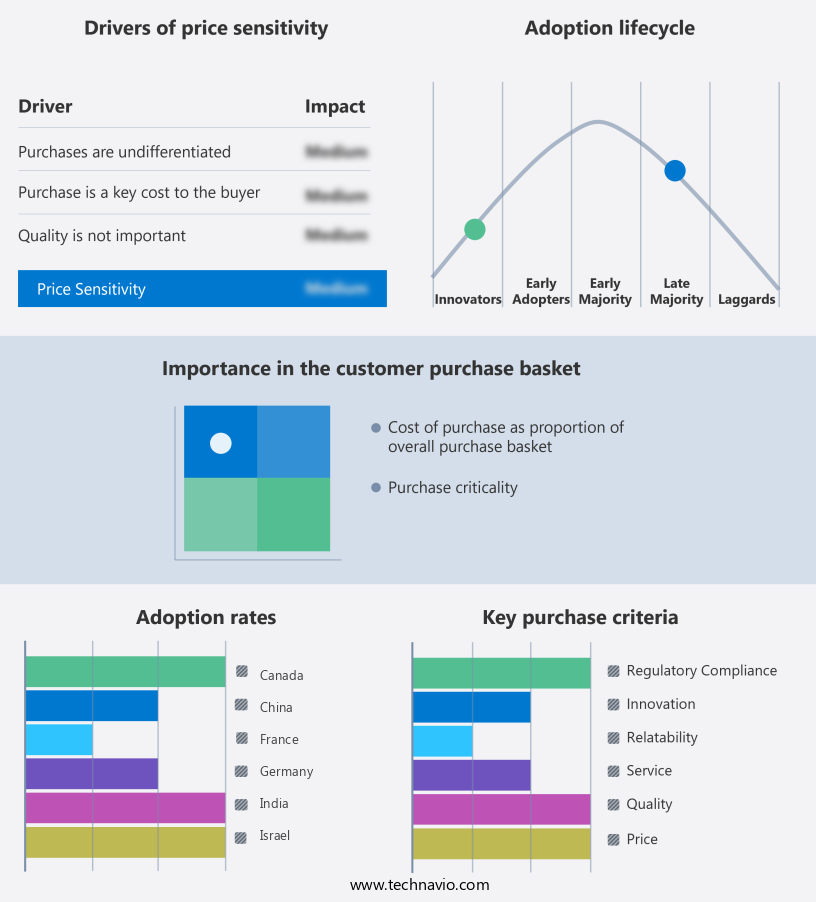
The autonomous ai in smart homes and iot market forecasting report includes the adoption lifecycle of the market, covering from the innovator's stage to the laggard's stage. It focuses on adoption rates in different regions based on penetration. Furthermore, the autonomous ai in smart homes and iot market report also includes key purchase criteria and drivers of price sensitivity to help companies evaluate and develop their market growth analysis strategies.

Customer Landscape of Autonomous AI In Smart Homes And IoT Industry
Competitive Landscape
Companies are implementing various strategies, such as strategic alliances, autonomous ai in smart homes and iot market forecast, partnerships, mergers and acquisitions, geographical expansion, and product/service launches, to enhance their presence in the industry.
ABB Ltd. - The company's Alexa Hunches feature utilizes machine learning to anticipate user needs based on patterns. Rings provides AI-driven motion and object detection. AWS IoT core services enable seamless device connectivity and management. These innovative offerings enhance user experience and efficiency.
The industry research and growth report includes detailed analyses of the competitive landscape of the market and information about key companies, including:
- ABB Ltd.
- Alarm.com Holdings Inc.
- Amazon.com Inc.
- Apple Inc.
- C3.ai Inc.
- Crestron Electronics Inc.
- ecobee
- Google LLC
- Huawei Technologies Co. Ltd.
- Lutron Electronics Co. Inc.
- Microsoft Corp.
- NVIDIA Corp.
- Resideo Technologies Inc.
- Robert Bosch GmbH
- Samsung Electronics Co. Ltd.
- Schneider Electric SE
- Siemens AG
- Snap One LLC
- Sonos Inc.
- Xiaomi Inc.
Qualitative and quantitative analysis of companies has been conducted to help clients understand the wider business environment as well as the strengths and weaknesses of key industry players. Data is qualitatively analyzed to categorize companies as pure play, category-focused, industry-focused, and diversified; it is quantitatively analyzed to categorize companies as dominant, leading, strong, tentative, and weak.
Recent Development and News in Autonomous AI In Smart Homes And IoT Market
- In January 2024, Amazon announced the integration of Alexa with new autonomous AI technologies, enabling its smart home devices to learn and adapt to users' routines without explicit instructions. This development was revealed in their press release (Amazon.Com, 2024).
- In March 2024, Google and Samsung signed a strategic partnership to combine Google's voice assistant technology with Samsung's SmartThings platform. This collaboration aimed to create a more seamless user experience in managing smart homes and IoT devices (Google, 2024).
- In May 2024, Apple secured a strategic investment of USD200 million in Emotient, a leading emotion AI company. This move was aimed at enhancing Siri's capabilities to understand and respond to human emotions in a more nuanced way (Apple Investor Relations, 2024).
- In April 2025, IKEA, the furniture retailer, acquired SmartThings, a major IoT platform provider. This acquisition was announced in IKEA's press release and was aimed at expanding their product offerings and services in the smart home market (IKEA Press Center, 2025).
Dive into Technavio's robust research methodology, blending expert interviews, extensive data synthesis, and validated models for unparalleled Autonomous AI In Smart Homes And IoT Market insights. See full methodology.
Market Scope
|
Report Coverage
|
Details
|
Page number
|
285
|
Base year
|
2024
|
Historic period
|
2019-2023 |
Forecast period
|
2025-2029
|
Growth momentum & CAGR
|
Accelerate at a CAGR of 21.6%
|
Market growth 2025-2029
|
USD 20700.9 million
|
Market structure
|
Fragmented
|
YoY growth 2024-2025(%)
|
19.9
|
Key countries
|
US, China, Japan, Canada, UK, Germany, France, South Korea, India, and Israel
|
Competitive landscape
|
Leading Companies, Market Positioning of Companies, Competitive Strategies, and Industry Risks
|
Request Free Sample
Research Analyst Overview
- The market continues to evolve, driven by advancements in data analytics platforms, user experience optimization, and environmental monitoring. Home automation protocols, such as Zigbee and Z-Wave, facilitate device interoperability, enabling intelligent home assistants and voice-activated assistants to seamlessly control various devices. Edge computing architecture and real-time data processing enhance the performance of AI-powered home security systems and anomaly detection systems. For instance, a leading data encryption methods provider reported a 30% increase in sales due to the growing demand for securing sensitive data in smart homes. The global smart home automation market is projected to grow by 15% annually, fueled by the integration of AI-driven personalization, smart appliance control, and energy management systems.
- Cybersecurity measures, including network security protocols and natural language processing, are essential components of this market, ensuring the protection of user data and privacy. AI-powered home security systems and smart thermostat control contribute significantly to home energy efficiency and home security. Computer vision applications and IOT device integration enable advanced features like smart lighting control and adaptive learning systems, enhancing the user experience. Remote home monitoring and automated HVAC systems offer convenience and cost savings for homeowners. Overall, the market's continuous dynamism reflects the ongoing unfolding of innovative applications across various sectors.
What are the Key Data Covered in this Autonomous AI In Smart Homes And IoT Market Research and Growth Report?
-
What is the expected growth of the Autonomous AI In Smart Homes And IoT Market between 2025 and 2029?
-
What segmentation does the market report cover?
-
The report is segmented by Component (Hardware, Software, and Services), Technology (Machine learning, NLP, Computer vision, Predictive analytics, and Others), Application (Voice assistance and command recognition, Security and surveillance, Energy management, Healthcare and assisted living, and Others), Connectivity (Wireless protocols and Wired protocols), End-user (Residential, Commercial, and Industrial), and Geography (North America, APAC, Europe, South America, and Middle East and Africa)
-
Which regions are analyzed in the report?
-
North America, APAC, Europe, South America, and Middle East and Africa
-
What are the key growth drivers and market challenges?
-
Who are the major players in the Autonomous AI In Smart Homes And IoT Market?
-
ABB Ltd., Alarm.com Holdings Inc., Amazon.com Inc., Apple Inc., C3.ai Inc., Crestron Electronics Inc., ecobee, Google LLC, Huawei Technologies Co. Ltd., Lutron Electronics Co. Inc., Microsoft Corp., NVIDIA Corp., Resideo Technologies Inc., Robert Bosch GmbH, Samsung Electronics Co. Ltd., Schneider Electric SE, Siemens AG, Snap One LLC, Sonos Inc., and Xiaomi Inc.
Market Research Insights
- The market for autonomous AI in smart homes and IoT is a continuously evolving landscape. Two key aspects of this market are the increasing integration of security vulnerability assessments and user privacy protection. For instance, the number of IoT devices sold with built-in security features grew by 30% in the last year, reflecting the industry's response to heightened consumer concerns. Moreover, the market is projected to expand at a rate of 20% annually, as AI becomes more integral to home automation and energy optimization. AI explainability techniques and bias mitigation are essential components of this growth, ensuring that smart homes operate efficiently and ethically.
- Additionally, network bandwidth requirements and system reliability metrics are critical considerations, as the integration of more devices and advanced AI models necessitates robust data storage solutions and software update management. AI personal assistants and home automation software continue to improve, streamlining user authentication methods and system integration challenges within smart home ecosystems. Despite these advancements, industry experts emphasize the importance of addressing data privacy concerns and system maintenance procedures to ensure the long-term success of the market.
We can help! Our analysts can customize this autonomous ai in smart homes and iot market research report to meet your requirements.
Get in touch
1 Executive Summary
- 1.1 Market overview
- Executive Summary - Chart on Market Overview
- Executive Summary - Data Table on Market Overview
- Executive Summary - Chart on Global Market Characteristics
- Executive Summary - Chart on Market by Geography
- Executive Summary - Chart on Market Segmentation by Component
- Executive Summary - Chart on Market Segmentation by Technology
- Executive Summary - Chart on Market Segmentation by Application
- Executive Summary - Chart on Market Segmentation by Connectivity
- Executive Summary - Chart on Market Segmentation by End-user
- Executive Summary - Chart on Incremental Growth
- Executive Summary - Data Table on Incremental Growth
- Executive Summary - Chart on Company Market Positioning
2 Technavio Analysis
- 2.1 Analysis of price sensitivity, lifecycle, customer purchase basket, adoption rates, and purchase criteria
- Analysis of price sensitivity, lifecycle, customer purchase basket, adoption rates, and purchase criteria
- 2.2 Criticality of inputs and Factors of differentiation
- Overview on criticality of inputs and factors of differentiation
- 2.3 Factors of disruption
- Overview on factors of disruption
- 2.4 Impact of drivers and challenges
- Impact of drivers and challenges in 2024 and 2029
3 Market Landscape
- 3.1 Market ecosystem
- Parent Market
- Data Table on - Parent Market
- 3.2 Market characteristics
- Market characteristics analysis
4 Market Sizing
- 4.1 Market definition
- Offerings of companies included in the market definition
- 4.2 Market segment analysis
- 4.4 Market outlook: Forecast for 2024-2029
- Chart on Global - Market size and forecast 2024-2029 ($ million)
- Data Table on Global - Market size and forecast 2024-2029 ($ million)
- Chart on Global Market: Year-over-year growth 2024-2029 (%)
- Data Table on Global Market: Year-over-year growth 2024-2029 (%)
5 Historic Market Size
- 5.1 Global Autonomous AI In Smart Homes And IoT Market 2019 - 2023
- Historic Market Size - Data Table on Global Autonomous AI In Smart Homes And IoT Market 2019 - 2023 ($ million)
- 5.2 Component segment analysis 2019 - 2023
- Historic Market Size - Component Segment 2019 - 2023 ($ million)
- 5.3 Technology segment analysis 2019 - 2023
- Historic Market Size - Technology Segment 2019 - 2023 ($ million)
- 5.4 Application segment analysis 2019 - 2023
- Historic Market Size - Application Segment 2019 - 2023 ($ million)
- 5.5 Connectivity segment analysis 2019 - 2023
- Historic Market Size - Connectivity Segment 2019 - 2023 ($ million)
- 5.6 End-user segment analysis 2019 - 2023
- Historic Market Size - End-user Segment 2019 - 2023 ($ million)
- 5.7 Geography segment analysis 2019 - 2023
- Historic Market Size - Geography Segment 2019 - 2023 ($ million)
- 5.8 Country segment analysis 2019 - 2023
- Historic Market Size - Country Segment 2019 - 2023 ($ million)
6 Five Forces Analysis
- 6.1 Five forces summary
- Five forces analysis - Comparison between 2024 and 2029
- 6.2 Bargaining power of buyers
- Bargaining power of buyers - Impact of key factors 2024 and 2029
- 6.3 Bargaining power of suppliers
- Bargaining power of suppliers - Impact of key factors in 2024 and 2029
- 6.4 Threat of new entrants
- Threat of new entrants - Impact of key factors in 2024 and 2029
- 6.5 Threat of substitutes
- Threat of substitutes - Impact of key factors in 2024 and 2029
- 6.6 Threat of rivalry
- Threat of rivalry - Impact of key factors in 2024 and 2029
- 6.7 Market condition
- Chart on Market condition - Five forces 2024 and 2029
7 Market Segmentation by Component
- 7.1 Market segments
- Chart on Component - Market share 2024-2029 (%)
- Data Table on Component - Market share 2024-2029 (%)
- 7.2 Comparison by Component
- Chart on Comparison by Component
- Data Table on Comparison by Component
- 7.3 Hardware - Market size and forecast 2024-2029
- Chart on Hardware - Market size and forecast 2024-2029 ($ million)
- Data Table on Hardware - Market size and forecast 2024-2029 ($ million)
- Chart on Hardware - Year-over-year growth 2024-2029 (%)
- Data Table on Hardware - Year-over-year growth 2024-2029 (%)
- 7.4 Software - Market size and forecast 2024-2029
- Chart on Software - Market size and forecast 2024-2029 ($ million)
- Data Table on Software - Market size and forecast 2024-2029 ($ million)
- Chart on Software - Year-over-year growth 2024-2029 (%)
- Data Table on Software - Year-over-year growth 2024-2029 (%)
- 7.5 Services - Market size and forecast 2024-2029
- Chart on Services - Market size and forecast 2024-2029 ($ million)
- Data Table on Services - Market size and forecast 2024-2029 ($ million)
- Chart on Services - Year-over-year growth 2024-2029 (%)
- Data Table on Services - Year-over-year growth 2024-2029 (%)
- 7.6 Market opportunity by Component
- Market opportunity by Component ($ million)
- Data Table on Market opportunity by Component ($ million)
8 Market Segmentation by Technology
- 8.1 Market segments
- Chart on Technology - Market share 2024-2029 (%)
- Data Table on Technology - Market share 2024-2029 (%)
- 8.2 Comparison by Technology
- Chart on Comparison by Technology
- Data Table on Comparison by Technology
- 8.3 Machine learning - Market size and forecast 2024-2029
- Chart on Machine learning - Market size and forecast 2024-2029 ($ million)
- Data Table on Machine learning - Market size and forecast 2024-2029 ($ million)
- Chart on Machine learning - Year-over-year growth 2024-2029 (%)
- Data Table on Machine learning - Year-over-year growth 2024-2029 (%)
- 8.4 NLP - Market size and forecast 2024-2029
- Chart on NLP - Market size and forecast 2024-2029 ($ million)
- Data Table on NLP - Market size and forecast 2024-2029 ($ million)
- Chart on NLP - Year-over-year growth 2024-2029 (%)
- Data Table on NLP - Year-over-year growth 2024-2029 (%)
- 8.5 Computer vision - Market size and forecast 2024-2029
- Chart on Computer vision - Market size and forecast 2024-2029 ($ million)
- Data Table on Computer vision - Market size and forecast 2024-2029 ($ million)
- Chart on Computer vision - Year-over-year growth 2024-2029 (%)
- Data Table on Computer vision - Year-over-year growth 2024-2029 (%)
- 8.6 Predictive analytics - Market size and forecast 2024-2029
- Chart on Predictive analytics - Market size and forecast 2024-2029 ($ million)
- Data Table on Predictive analytics - Market size and forecast 2024-2029 ($ million)
- Chart on Predictive analytics - Year-over-year growth 2024-2029 (%)
- Data Table on Predictive analytics - Year-over-year growth 2024-2029 (%)
- 8.7 Others - Market size and forecast 2024-2029
- Chart on Others - Market size and forecast 2024-2029 ($ million)
- Data Table on Others - Market size and forecast 2024-2029 ($ million)
- Chart on Others - Year-over-year growth 2024-2029 (%)
- Data Table on Others - Year-over-year growth 2024-2029 (%)
- 8.8 Market opportunity by Technology
- Market opportunity by Technology ($ million)
- Data Table on Market opportunity by Technology ($ million)
9 Market Segmentation by Application
- 9.1 Market segments
- Chart on Application - Market share 2024-2029 (%)
- Data Table on Application - Market share 2024-2029 (%)
- 9.2 Comparison by Application
- Chart on Comparison by Application
- Data Table on Comparison by Application
- 9.3 Voice assistance and command recognition - Market size and forecast 2024-2029
- Chart on Voice assistance and command recognition - Market size and forecast 2024-2029 ($ million)
- Data Table on Voice assistance and command recognition - Market size and forecast 2024-2029 ($ million)
- Chart on Voice assistance and command recognition - Year-over-year growth 2024-2029 (%)
- Data Table on Voice assistance and command recognition - Year-over-year growth 2024-2029 (%)
- 9.4 Security and surveillance - Market size and forecast 2024-2029
- Chart on Security and surveillance - Market size and forecast 2024-2029 ($ million)
- Data Table on Security and surveillance - Market size and forecast 2024-2029 ($ million)
- Chart on Security and surveillance - Year-over-year growth 2024-2029 (%)
- Data Table on Security and surveillance - Year-over-year growth 2024-2029 (%)
- 9.5 Energy management - Market size and forecast 2024-2029
- Chart on Energy management - Market size and forecast 2024-2029 ($ million)
- Data Table on Energy management - Market size and forecast 2024-2029 ($ million)
- Chart on Energy management - Year-over-year growth 2024-2029 (%)
- Data Table on Energy management - Year-over-year growth 2024-2029 (%)
- 9.6 Healthcare and assisted living - Market size and forecast 2024-2029
- Chart on Healthcare and assisted living - Market size and forecast 2024-2029 ($ million)
- Data Table on Healthcare and assisted living - Market size and forecast 2024-2029 ($ million)
- Chart on Healthcare and assisted living - Year-over-year growth 2024-2029 (%)
- Data Table on Healthcare and assisted living - Year-over-year growth 2024-2029 (%)
- 9.7 Others - Market size and forecast 2024-2029
- Chart on Others - Market size and forecast 2024-2029 ($ million)
- Data Table on Others - Market size and forecast 2024-2029 ($ million)
- Chart on Others - Year-over-year growth 2024-2029 (%)
- Data Table on Others - Year-over-year growth 2024-2029 (%)
- 9.8 Market opportunity by Application
- Market opportunity by Application ($ million)
- Data Table on Market opportunity by Application ($ million)
10 Market Segmentation by Connectivity
- 10.1 Market segments
- Chart on Connectivity - Market share 2024-2029 (%)
- Data Table on Connectivity - Market share 2024-2029 (%)
- 10.2 Comparison by Connectivity
- Chart on Comparison by Connectivity
- Data Table on Comparison by Connectivity
- 10.3 Wireless protocols - Market size and forecast 2024-2029
- Chart on Wireless protocols - Market size and forecast 2024-2029 ($ million)
- Data Table on Wireless protocols - Market size and forecast 2024-2029 ($ million)
- Chart on Wireless protocols - Year-over-year growth 2024-2029 (%)
- Data Table on Wireless protocols - Year-over-year growth 2024-2029 (%)
- 10.4 Wired protocols - Market size and forecast 2024-2029
- Chart on Wired protocols - Market size and forecast 2024-2029 ($ million)
- Data Table on Wired protocols - Market size and forecast 2024-2029 ($ million)
- Chart on Wired protocols - Year-over-year growth 2024-2029 (%)
- Data Table on Wired protocols - Year-over-year growth 2024-2029 (%)
- 10.5 Market opportunity by Connectivity
- Market opportunity by Connectivity ($ million)
- Data Table on Market opportunity by Connectivity ($ million)
11 Market Segmentation by End-user
- 11.1 Market segments
- Chart on End-user - Market share 2024-2029 (%)
- Data Table on End-user - Market share 2024-2029 (%)
- 11.2 Comparison by End-user
- Chart on Comparison by End-user
- Data Table on Comparison by End-user
- 11.3 Residential - Market size and forecast 2024-2029
- Chart on Residential - Market size and forecast 2024-2029 ($ million)
- Data Table on Residential - Market size and forecast 2024-2029 ($ million)
- Chart on Residential - Year-over-year growth 2024-2029 (%)
- Data Table on Residential - Year-over-year growth 2024-2029 (%)
- 11.4 Commercial - Market size and forecast 2024-2029
- Chart on Commercial - Market size and forecast 2024-2029 ($ million)
- Data Table on Commercial - Market size and forecast 2024-2029 ($ million)
- Chart on Commercial - Year-over-year growth 2024-2029 (%)
- Data Table on Commercial - Year-over-year growth 2024-2029 (%)
- 11.5 Industrial - Market size and forecast 2024-2029
- Chart on Industrial - Market size and forecast 2024-2029 ($ million)
- Data Table on Industrial - Market size and forecast 2024-2029 ($ million)
- Chart on Industrial - Year-over-year growth 2024-2029 (%)
- Data Table on Industrial - Year-over-year growth 2024-2029 (%)
- 11.6 Market opportunity by End-user
- Market opportunity by End-user ($ million)
- Data Table on Market opportunity by End-user ($ million)
12 Customer Landscape
- 12.1 Customer landscape overview
- Analysis of price sensitivity, lifecycle, customer purchase basket, adoption rates, and purchase criteria
13 Geographic Landscape
- 13.1 Geographic segmentation
- Chart on Market share by geography 2024-2029 (%)
- Data Table on Market share by geography 2024-2029 (%)
- 13.2 Geographic comparison
- Chart on Geographic comparison
- Data Table on Geographic comparison
- 13.3 North America - Market size and forecast 2024-2029
- Chart on North America - Market size and forecast 2024-2029 ($ million)
- Data Table on North America - Market size and forecast 2024-2029 ($ million)
- Chart on North America - Year-over-year growth 2024-2029 (%)
- Data Table on North America - Year-over-year growth 2024-2029 (%)
- 13.4 APAC - Market size and forecast 2024-2029
- Chart on APAC - Market size and forecast 2024-2029 ($ million)
- Data Table on APAC - Market size and forecast 2024-2029 ($ million)
- Chart on APAC - Year-over-year growth 2024-2029 (%)
- Data Table on APAC - Year-over-year growth 2024-2029 (%)
- 13.5 Europe - Market size and forecast 2024-2029
- Chart on Europe - Market size and forecast 2024-2029 ($ million)
- Data Table on Europe - Market size and forecast 2024-2029 ($ million)
- Chart on Europe - Year-over-year growth 2024-2029 (%)
- Data Table on Europe - Year-over-year growth 2024-2029 (%)
- 13.6 South America - Market size and forecast 2024-2029
- Chart on South America - Market size and forecast 2024-2029 ($ million)
- Data Table on South America - Market size and forecast 2024-2029 ($ million)
- Chart on South America - Year-over-year growth 2024-2029 (%)
- Data Table on South America - Year-over-year growth 2024-2029 (%)
- 13.7 Middle East and Africa - Market size and forecast 2024-2029
- Chart on Middle East and Africa - Market size and forecast 2024-2029 ($ million)
- Data Table on Middle East and Africa - Market size and forecast 2024-2029 ($ million)
- Chart on Middle East and Africa - Year-over-year growth 2024-2029 (%)
- Data Table on Middle East and Africa - Year-over-year growth 2024-2029 (%)
- 13.8 US - Market size and forecast 2024-2029
- Chart on US - Market size and forecast 2024-2029 ($ million)
- Data Table on US - Market size and forecast 2024-2029 ($ million)
- Chart on US - Year-over-year growth 2024-2029 (%)
- Data Table on US - Year-over-year growth 2024-2029 (%)
- 13.9 China - Market size and forecast 2024-2029
- Chart on China - Market size and forecast 2024-2029 ($ million)
- Data Table on China - Market size and forecast 2024-2029 ($ million)
- Chart on China - Year-over-year growth 2024-2029 (%)
- Data Table on China - Year-over-year growth 2024-2029 (%)
- 13.10 Canada - Market size and forecast 2024-2029
- Chart on Canada - Market size and forecast 2024-2029 ($ million)
- Data Table on Canada - Market size and forecast 2024-2029 ($ million)
- Chart on Canada - Year-over-year growth 2024-2029 (%)
- Data Table on Canada - Year-over-year growth 2024-2029 (%)
- 13.11 UK - Market size and forecast 2024-2029
- Chart on UK - Market size and forecast 2024-2029 ($ million)
- Data Table on UK - Market size and forecast 2024-2029 ($ million)
- Chart on UK - Year-over-year growth 2024-2029 (%)
- Data Table on UK - Year-over-year growth 2024-2029 (%)
- 13.12 Japan - Market size and forecast 2024-2029
- Chart on Japan - Market size and forecast 2024-2029 ($ million)
- Data Table on Japan - Market size and forecast 2024-2029 ($ million)
- Chart on Japan - Year-over-year growth 2024-2029 (%)
- Data Table on Japan - Year-over-year growth 2024-2029 (%)
- 13.13 Germany - Market size and forecast 2024-2029
- Chart on Germany - Market size and forecast 2024-2029 ($ million)
- Data Table on Germany - Market size and forecast 2024-2029 ($ million)
- Chart on Germany - Year-over-year growth 2024-2029 (%)
- Data Table on Germany - Year-over-year growth 2024-2029 (%)
- 13.14 France - Market size and forecast 2024-2029
- Chart on France - Market size and forecast 2024-2029 ($ million)
- Data Table on France - Market size and forecast 2024-2029 ($ million)
- Chart on France - Year-over-year growth 2024-2029 (%)
- Data Table on France - Year-over-year growth 2024-2029 (%)
- 13.15 South Korea - Market size and forecast 2024-2029
- Chart on South Korea - Market size and forecast 2024-2029 ($ million)
- Data Table on South Korea - Market size and forecast 2024-2029 ($ million)
- Chart on South Korea - Year-over-year growth 2024-2029 (%)
- Data Table on South Korea - Year-over-year growth 2024-2029 (%)
- 13.16 India - Market size and forecast 2024-2029
- Chart on India - Market size and forecast 2024-2029 ($ million)
- Data Table on India - Market size and forecast 2024-2029 ($ million)
- Chart on India - Year-over-year growth 2024-2029 (%)
- Data Table on India - Year-over-year growth 2024-2029 (%)
- 13.17 Israel - Market size and forecast 2024-2029
- Chart on Israel - Market size and forecast 2024-2029 ($ million)
- Data Table on Israel - Market size and forecast 2024-2029 ($ million)
- Chart on Israel - Year-over-year growth 2024-2029 (%)
- Data Table on Israel - Year-over-year growth 2024-2029 (%)
- 13.18 Market opportunity by geography
- Market opportunity by geography ($ million)
- Data Tables on Market opportunity by geography ($ million)
14 Drivers, Challenges, and Opportunity/Restraints
- 14.3 Impact of drivers and challenges
- Impact of drivers and challenges in 2024 and 2029
- 14.4 Market opportunities/restraints
15 Competitive Landscape
- 15.2 Competitive Landscape
- Overview on criticality of inputs and factors of differentiation
- 15.3 Landscape disruption
- Overview on factors of disruption
- 15.4 Industry risks
- Impact of key risks on business
16 Competitive Analysis
- 16.2 Company ranking index
- 16.3 Market positioning of companies
- Matrix on companies position and classification
- 16.4 Amazon.com Inc.
- Amazon.com Inc. - Overview
- Amazon.com Inc. - Business segments
- Amazon.com Inc. - Key news
- Amazon.com Inc. - Key offerings
- Amazon.com Inc. - Segment focus
- SWOT
- 16.5 Apple Inc.
- Apple Inc. - Overview
- Apple Inc. - Business segments
- Apple Inc. - Key news
- Apple Inc. - Key offerings
- Apple Inc. - Segment focus
- SWOT
- 16.6 Crestron Electronics Inc.
- Crestron Electronics Inc. - Overview
- Crestron Electronics Inc. - Product / Service
- Crestron Electronics Inc. - Key offerings
- SWOT
- 16.7 ecobee
- ecobee - Overview
- ecobee - Product / Service
- ecobee - Key offerings
- SWOT
- 16.8 Google LLC
- Google LLC - Overview
- Google LLC - Product / Service
- Google LLC - Key offerings
- SWOT
- 16.9 Lutron Electronics Co. Inc.
- Lutron Electronics Co. Inc. - Overview
- Lutron Electronics Co. Inc. - Product / Service
- Lutron Electronics Co. Inc. - Key offerings
- SWOT
- 16.10 Microsoft Corp.
- Microsoft Corp. - Overview
- Microsoft Corp. - Business segments
- Microsoft Corp. - Key news
- Microsoft Corp. - Key offerings
- Microsoft Corp. - Segment focus
- SWOT
- 16.11 NVIDIA Corp.
- NVIDIA Corp. - Overview
- NVIDIA Corp. - Business segments
- NVIDIA Corp. - Key news
- NVIDIA Corp. - Key offerings
- NVIDIA Corp. - Segment focus
- SWOT
- 16.12 Resideo Technologies Inc.
- Resideo Technologies Inc. - Overview
- Resideo Technologies Inc. - Business segments
- Resideo Technologies Inc. - Key offerings
- Resideo Technologies Inc. - Segment focus
- SWOT
- 16.13 Robert Bosch GmbH
- Robert Bosch GmbH - Overview
- Robert Bosch GmbH - Product / Service
- Robert Bosch GmbH - Key news
- Robert Bosch GmbH - Key offerings
- SWOT
- 16.14 Samsung Electronics Co. Ltd.
- Samsung Electronics Co. Ltd. - Overview
- Samsung Electronics Co. Ltd. - Business segments
- Samsung Electronics Co. Ltd. - Key news
- Samsung Electronics Co. Ltd. - Key offerings
- Samsung Electronics Co. Ltd. - Segment focus
- SWOT
- 16.15 Schneider Electric SE
- Schneider Electric SE - Overview
- Schneider Electric SE - Business segments
- Schneider Electric SE - Key news
- Schneider Electric SE - Key offerings
- Schneider Electric SE - Segment focus
- SWOT
- 16.16 Siemens AG
- Siemens AG - Overview
- Siemens AG - Business segments
- Siemens AG - Key news
- Siemens AG - Key offerings
- Siemens AG - Segment focus
- SWOT
- 16.17 Snap One LLC
- Snap One LLC - Overview
- Snap One LLC - Product / Service
- Snap One LLC - Key offerings
- SWOT
- 16.18 Xiaomi Inc.
- Xiaomi Inc. - Overview
- Xiaomi Inc. - Business segments
- Xiaomi Inc. - Key news
- Xiaomi Inc. - Key offerings
- Xiaomi Inc. - Segment focus
- SWOT
17 Appendix
- 17.2 Inclusions and exclusions checklist
- Inclusions checklist
- Exclusions checklist
- 17.3 Currency conversion rates for US$
- Currency conversion rates for US$
- 17.4 Research methodology
- 17.7 Validation techniques employed for market sizing
- Validation techniques employed for market sizing
- 17.9 360 degree market analysis
- 360 degree market analysis
- 17.10 List of abbreviations