
Budget Apps Market Size 2025-2029
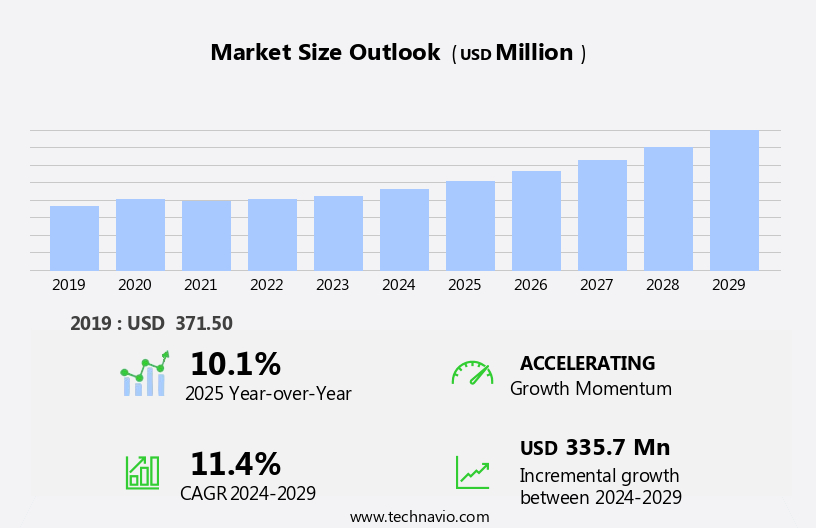
The budget apps market size is forecast to increase by USD 335.7 million at a CAGR of 11.4% between 2024 and 2029.
- The budgeting apps market is experiencing significant growth, driven by increased internet access and the rising preference among young customers for digital financial management solutions. This trend is expected to continue as more individuals seek to better manage their expenses and savings. Hosted on cloud servers, these apps enable users to manage their financial transactions and monitor their financial health in real-time from any device with an internet connection.
- However, data security and privacy concerns remain key challenges for the providers, necessitating security measures to protect user information. As the market expands, providers must prioritize these concerns to build trust and maintain user loyalty. Overall, the market presents a promising opportunity for innovation and growth in the digital financial services sector.
What will be the Size of the Budget Apps Market During the Forecast Period?
- In today's digital age, budget apps have become essential tools for individuals and families seeking to manage their finances effectively. These web-based applications offer various features, including data compilation for expense and income tracking, retirement planning, debt management, and savings goals. However, as the use of budget apps continues to grow, so does the importance of ensuring privacy and security. Financial management apps provide numerous benefits, such as real-time financial insights, automated savings, and personalized financial advice. Yet, they also come with potential disadvantages, such as data breaches and privacy concerns. As such, content ideation and planning for budget apps must prioritize both benefits and disadvantages, ensuring accurate and unbiased information. Competitor analysis and semantic analysis play a crucial role in content optimization. By understanding the market dynamics and identifying topics relevant to these apps, content creators can develop engaging and informative content that resonates with their audience. Free budget apps, financial planning apps, and income trackers are just a few examples of the various types of financial management apps available.
- Moreover, social media strategy and PPC advertising are essential components of marketing budget apps effectively. Content curation and tagging also play a role in ensuring that relevant and timely information is shared with the audience. With the increasing importance of digital banking solutions and financial innovation, they are poised to become even more integral to personal financial wellness and financial inclusion. In conclusion, they offer numerous benefits for individuals and families seeking to manage their finances effectively. However, it is essential to consider both the advantages and disadvantages of these applications, as well as the importance of data privacy and security. By focusing on accurate and unbiased information, content creators can develop engaging and informative content that resonates with their audience and helps them make informed decisions about using the apps for their financial management needs.
How is this market segmented and which is the largest segment?
The market research report provides comprehensive data (region-wise segment analysis), with forecasts and estimates in "USD million" for the period 2025-2029, as well as historical data from 2019-2023 for the following segments.
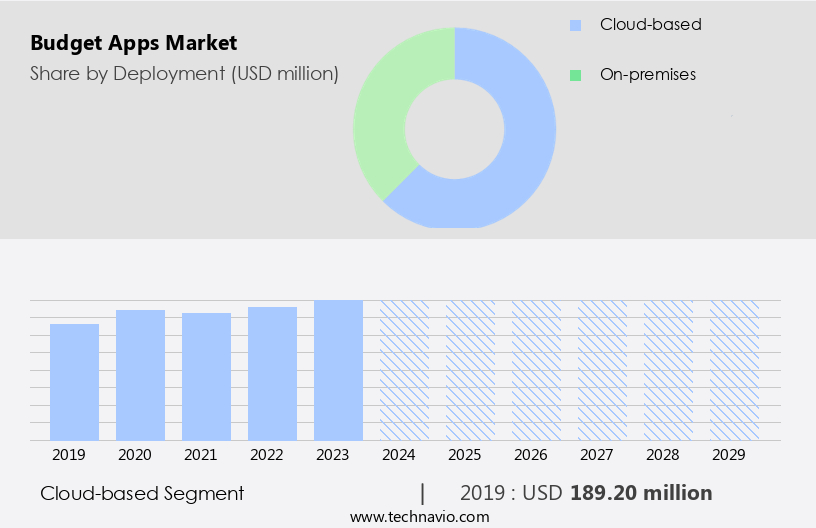
- Deployment
- Cloud-based
- On-premises
- Type
- Personal budgeting apps
- Family budgeting apps
- Business budgeting apps
- Geography
- North America
- Canada
- US
- APAC
- China
- India
- Japan
- South Korea
- Europe
- Germany
- UK
- France
- South America
- Middle East and Africa
- North America
By Deployment Insights
- The cloud-based segment is estimated to witness significant growth during the forecast period.
The cloud-based budget apps segment experiences continuous growth within The market due to their accessibility, convenience, and collaborative features. Cloud-based budget apps provide significant advantages, including the ability to update financial data and track expenses instantly, making them a popular choice for individuals and businesses seeking flexible financial management solutions. These apps offer real-time updates, allowing users to easily monitor their financial needs and progress toward financial goals. With digital financial services becoming increasingly prevalent, cloud-based apps play a crucial role in the financial ecosystem by providing users with easy access to their financial data for effective financial management.
Get a glance at the market report of share of various segments Request Free Sample
The cloud-based segment was valued at USD 189.20 million in 2019 and showed a gradual increase during the forecast period.
Regional Analysis
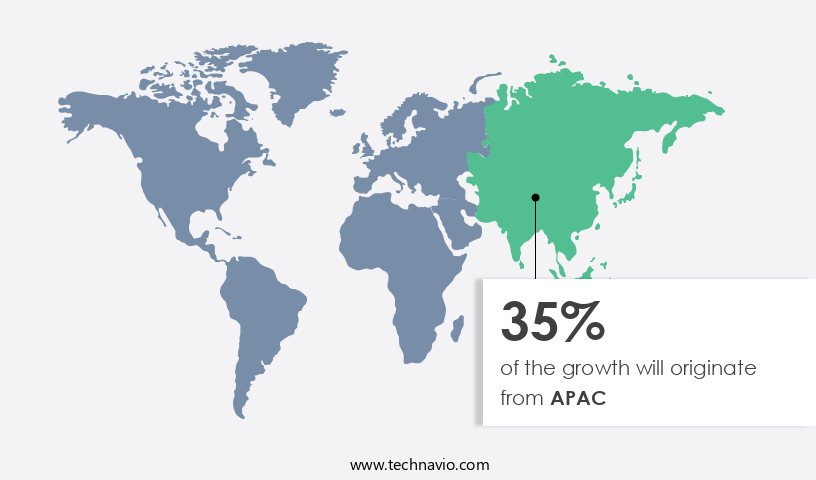
- APAC is estimated to contribute 35% to the growth of the global market during the forecast period.
Technavio's analysts have elaborately explained the regional trends and drivers that shape the market during the forecast period.
For more insights on the market share of various regions, Request Free Sample
In North America, the use is gaining traction due to economic pressures and technological innovations. Consumers and businesses alike are turning to these tools to enhance their financial management capabilities. The rise of financial literacy, particularly among millennials and Gen Z, is a significant driver of this trend. Budgeting apps, available on both iOS and Android platforms, leverage artificial intelligence and robotic process automation to provide personalized solutions. These applications help users effectively manage their finances, offering features such as expense tracking, bill reminders, and savings goals. By integrating computers and AI into budgeting, users can streamline their financial processes and gain valuable insights into their spending habits. Budgeting apps offer a convenient and efficient solution for navigating complex financial landscapes.
Market Dynamics
Our budget apps market researchers analyzed the data with 2024 as the base year, along with the key drivers, trends, and challenges. A holistic analysis of drivers will help companies refine their marketing strategies to gain a competitive advantage.
What are the key market drivers leading to the rise in adoption of Budget Apps Market?
Increased internet access is the key driver of the market.
- The market has experienced substantial growth due to the increasing smartphone penetration and widespread internet access. In 2021, approximately 5.1 billion people worldwide had internet access, representing around 63% of the global population. By 2024, this number had grown to over 5.5 billion, or 68% of the world population. This expansion of internet access has enabled users in both developed and developing regions to utilize budgeting apps on various devices, such as smartphones, tablets, and computers. Artificial intelligence (AI) and robotic process automation (RPA) have become essential features, providing personalized financial insights and automating financial activities. These advanced technologies enable users to monitor spending habits, optimize budgets, and set financial goals in real-time. Furthermore, API integration with digital financial solutions, such as banks and digital wallets, enhances the functionality. Security and data privacy are crucial concerns for budget app users, and ethical AI and machine learning algorithms are being employed to address these issues.
- Furthermore, regulatory landscapes and cybersecurity concerns have also become increasingly important in the market. Consumer behavior and financial goal setting are other significant factors influencing the market's growth. The market caters to various end-use sectors, including personal finance, financial management, and economic uncertainties. Cross-platform financial management and real-time updates are essential features for consumers seeking to manage their financial health and stability. Blockchain technology and financial transactions are also gaining traction in the market, offering enhanced security and transparency. Fintech companies are investing heavily to meet the growing demand for digital financial solutions. The market's competition is intensifying, with analytics capabilities and user interface design becoming key differentiators. As the market continues to evolve, it is essential to monitor consumer behavior, income tracking, and financial activities to optimize budgets and financial accounts. Overall, the market is poised for continued growth as mobile technology becomes increasingly integrated into our daily financial lives.
What are the market trends shaping the Budget Apps Market?
Growing popularity among young customers is the upcoming trend in the market.
- The market is experiencing notable growth, with iOS and Android platforms leading the way in providing digital financial solutions for managing personal information. Artificial intelligence (AI) and robotic process automation are key feature enhancements, enabling AI-driven expense tracking, real-time updates, and personalized financial insights. Security and data privacy are paramount concerns, with ethical AI and cybersecurity measures ensuring the protection of sensitive financial data. They cater to various end-use sectors, including economic uncertainties, income tracking, expense monitoring, financial goal setting, and cross-platform financial management. Machine learning algorithms optimize budgets, automate financial transactions, and provide financial health assessments. Blockchain technology adds an extra layer of security, while digital wallets facilitate seamless financial activities. Consumer behavior is a significant factor driving the market, with the increasing penetration of smartphones and the need for real-time financial management. Gamification elements, such as financial goal setting and financial behavior analysis, encourage user engagement and customer loyalty.
- Furthermore, open banking APIs and regulatory landscapes are shaping the competitive landscape, with fintech companies continuously innovating to meet the evolving financial needs of consumers. The market dynamics are influenced by economic uncertainties, regulatory changes, and advancements in mobile technology. Financial transactions, financial ecosystems, and financial behavior are all interconnected, making it crucial to offer comprehensive financial management solutions. By reducing expenses, setting financial goals, and providing financial stability, budget apps are becoming essential tools for maintaining financial health and managing personal finances effectively.
What challenges does Budget Apps Market face during the growth?
Data security and privacy concerns are key challenges affecting the market growth.
- The market for iOS and Android devices has gained significant traction in the US, as consumers seek digital financial solutions to manage their economic uncertainties. These apps offer various features, including expense tracking, income and spending monitoring, financial goal setting, and real-time updates. Artificial intelligence (AI) and robotic process automation (RPA) are increasingly being integrated into budget apps to provide personalized financial insights and automate financial activities. However, the use of AI and machine learning raises ethical concerns regarding data privacy and cybersecurity. Budget apps require access to personal financial information, such as bank account details and transaction histories, increasing the exposure of sensitive data. The need for security measures is crucial to mitigate the risks of unauthorized access and data breaches.
- Furthermore, API integration with financial institutions and open banking platforms adds another layer of complexity to data security. Moreover, regulatory landscapes continue to evolve, requiring fintech companies to comply with stringent data privacy and cybersecurity regulations. Consumer behavior is also shifting towards cross-platform financial management, demanding seamless user interface design and cross-device compatibility. Financial goal setting, expense tracking, and income monitoring are essential functions. Gamification and financial behavior analytics capabilities help users optimize their budgets and reduce expenses. Digital wallets and money management tools offer additional convenience and security. Financial data and transactions are at the heart of the budgeting ecosystem, necessitating the need for advanced analytics capabilities and regulatory compliance. As the market grows, competition among fintech companies intensifies, requiring continuous feature enhancements and innovation to meet evolving consumer needs.
Exclusive Customer Landscape
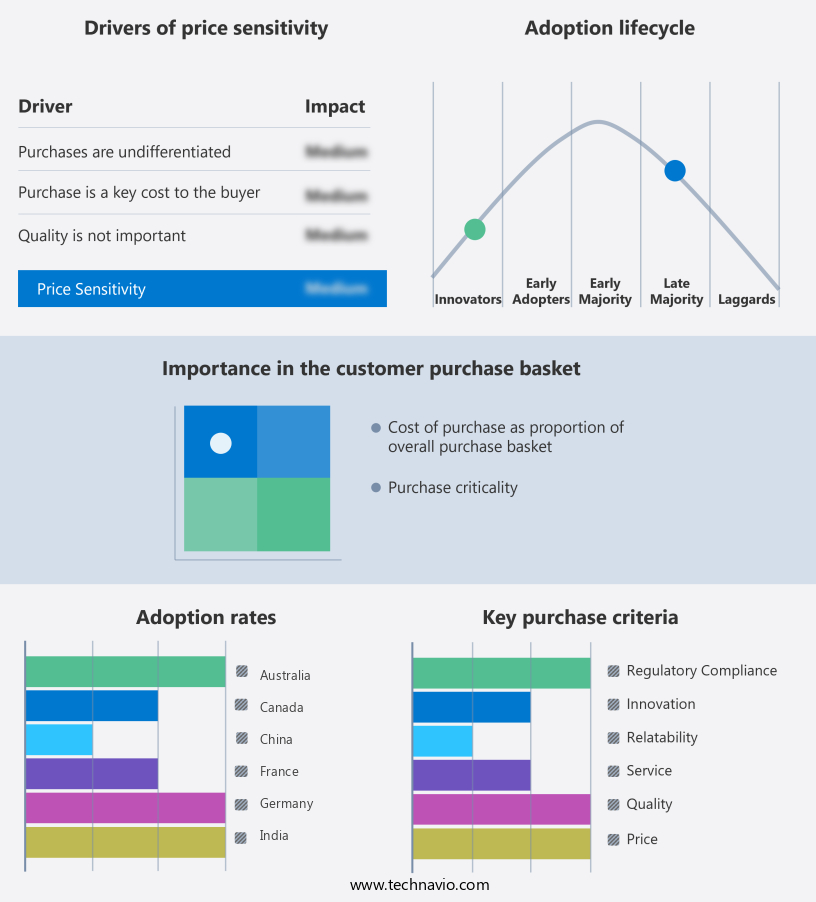
The market forecasting report includes the adoption lifecycle of the market, covering from the innovator's stage to the laggard's stage. It focuses on adoption rates in different regions based on penetration. Furthermore, the market report also includes key purchase criteria and drivers of price sensitivity to help companies evaluate and develop their market growth analysis strategies.
Customer Landscape
Key Companies & Market Insights
Companies are implementing various strategies, such as strategic alliances, market forecast, partnerships, mergers and acquisitions, geographical expansion, and product/service launches, to enhance their presence in the market.
BudgetBakers s.r.o - This company specializes in providing budgeting applications and personal finance tools for US consumers. Key features include the ability to monitor expenses, set up bill reminders, and generate financial forecasts. By utilizing these tools, users can effectively manage their income and expenses, ultimately leading to improved financial health.
The market research and growth report includes detailed analyses of the competitive landscape of the market and information about key companies, including:
- BudgetBakers s.r.o
- BUXFER Inc.
- CountAbout Corp.
- Dayspring
- Empower Annuity Insurance Co. of America
- Expenses Manager App
- FinancePal
- Financier
- Finsify JSC
- Fudget
- Lampo Licensing LLC
- Monarch Money Inc.
- Moneydue Inc.
- PocketGuard
- Quicken Inc.
- Realbyte Inc.
- Tiller
- YNAB
Qualitative and quantitative analysis of companies has been conducted to help clients understand the wider business environment as well as the strengths and weaknesses of key market players. Data is qualitatively analyzed to categorize companies as pure play, category-focused, industry-focused, and diversified; it is quantitatively analyzed to categorize companies as dominant, leading, strong, tentative, and weak.
Research Analyst Overview
Budget apps have emerged as a popular digital financial solution in today's world, where economic uncertainties have become a constant concern for individuals and businesses alike. These applications offer various features designed to help users manage their finances effectively, reduce expenses, and optimize budgets. The market for budget apps has seen significant growth in recent years, driven by the widespread use of smartphones and the increasing demand for convenient, accessible financial management tools. According to market research, the global budgeting apps market is expected to grow at a steady pace in the coming years, fueled by the increasing penetration of mobile technology and the rising awareness of the importance of financial management. One of the key factors driving the growth is their ability to integrate with APIs from various financial institutions, providing real-time updates on financial accounts and transactions. This feature enables users to monitor their spending habits, set financial goals, and optimize their budgets in real-time. Another trend in the budget app market is the use of artificial intelligence (AI) and machine learning algorithms to provide personalized financial insights and automate financial activities. These advanced technologies help users make informed decisions about their financial behavior, income, and expenses, and offer ethical AI and cybersecurity features to ensure data privacy and security.
Moreover, budget apps are increasingly being used to promote customer loyalty and cross-platform financial management. They offer gamification features, such as rewards and incentives, to encourage users to stick to their budgets and achieve their financial goals. Additionally, they allow users to manage their digital wallets and make financial transactions seamlessly, making budgeting a more engaging and rewarding experience. However, the budget app market is not without its challenges. Regulatory landscapes and competition from fintech companies are two major factors that can impact growth and success. It is essential for developers to stay abreast of regulatory requirements and competition dynamics to ensure their apps remain compliant and competitive.
Furthermore, budget apps must prioritize security and data privacy to build trust with their users. With the increasing use of open banking and real-time financial data access, it is crucial for budget apps to implement cybersecurity measures and adhere to ethical AI practices to protect user data and maintain transparency. In conclusion, budget apps have become an essential tool for individuals and businesses seeking to manage their finances effectively in an economically uncertain world. With the continued growth of mobile technology and the increasing demand for digital financial solutions, the market is expected to continue growing in the coming years. However, to succeed in this competitive landscape, they must prioritize user experience, security, and regulatory compliance while leveraging advanced technologies like AI and machine learning to offer personalized financial insights and automation capabilities.
|
Budget Apps Market Scope |
|
|
Report Coverage |
Details |
|
Page number |
199 |
|
Base year |
2024 |
|
Historic period |
2019-2023 |
|
Forecast period |
2025-2029 |
|
Growth momentum & CAGR |
Accelerate at a CAGR of 11.4% |
|
Market growth 2025-2029 |
USD 335.7 million |
|
Market structure |
Fragmented |
|
YoY growth 2024-2025(%) |
10.1 |
|
Key countries |
US, China, Germany, Japan, UK, South Korea, Canada, Australia, France, and India |
|
Competitive landscape |
Leading Companies, Market Positioning of Companies, Competitive Strategies, and Industry Risks |
What are the Key Data Covered in this Market Research and Growth Report?
- CAGR of the market during the forecast period
- Detailed information on factors that will drive the market growth and forecasting between 2025 and 2029
- Precise estimation of the size of the market and its contribution of the market in focus to the parent market
- Accurate predictions about upcoming market growth and trends and changes in consumer behaviour
- Growth of the market across North America, APAC, Europe, South America, and Middle East and Africa
- Thorough analysis of the market's competitive landscape and detailed information about companies
- Comprehensive analysis of factors that will challenge the growth of market companies
We can help! Our analysts can customize this market research report to meet your requirements. Get in touch
 RIA -
RIA - 
