
Commodity Plastics Market Size 2024-2028
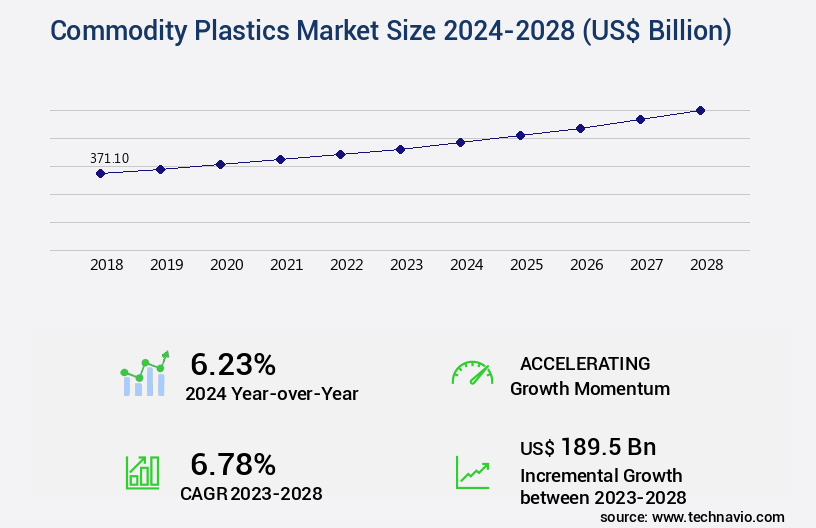
The commodity plastics market size is forecast to increase by USD 189.5 billion, at a CAGR of 6.78% between 2023 and 2028.
Major Market Trends & Insights
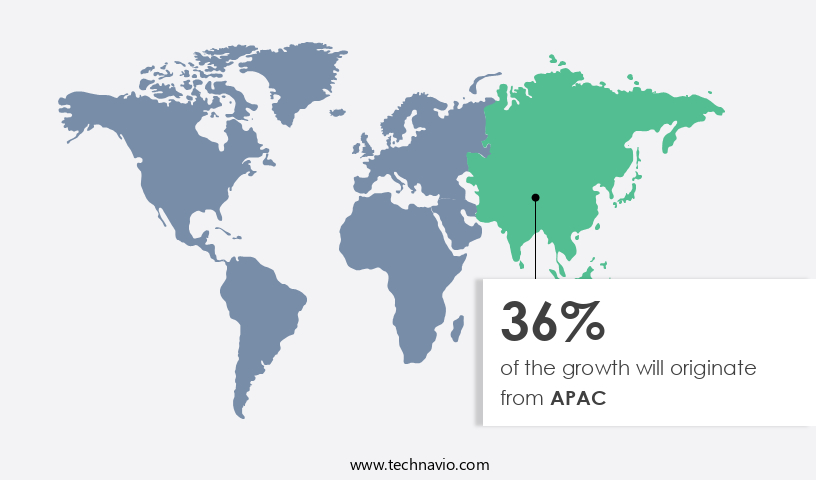
- APAC dominated the market and accounted for a 36% growth during the forecast period.
- By the Product - Polyethylene segment was valued at USD 109.80 billion in 2022
- By the End-User - Packaging segment accounted for the largest market revenue share in 2022
Market Size & Forecast
- Market Opportunities: USD 82.57 billion
- Market Future Opportunities: USD 189.50 billion
- CAGR : 6.78%
- APAC: Largest market in 2022
Market Summary
- The market experiences continuous evolution, driven by advancements in technology and shifting consumer preferences. The market is experiencing significant growth due to the increasing demand for packaging materials. According to recent studies, the global plastic packaging market is anticipated to reach a value of USD 530 billion by 2027, growing at a steady pace. This expansion is due to the increasing demand for lightweight, durable, and cost-effective packaging solutions across various industries, including food and beverage, pharmaceuticals, and cosmetics. Moreover, recycling techniques have gained significant traction, with an estimated 30% of plastic waste being recycled in 2020.
- This trend is expected to continue, as companies seek to reduce their environmental footprint and comply with stringent regulations regarding plastic usage. The market's dynamism is further reflected in the development of biodegradable and compostable plastics, which offer sustainable alternatives to traditional materials. Overall, the market presents numerous opportunities for growth and innovation, as businesses adapt to evolving consumer demands and regulatory requirements.
What will be the Size of the Commodity Plastics Market during the forecast period?
Explore market size, adoption trends, and growth potential for commodity plastics market Request Free Sample
- The market encompasses the production, processing, and application of various polymer materials. With a global production volume of over 300 million metric tons annually, it is a significant contributor to the manufacturing sector. Notably, plastic recycling has emerged as a crucial aspect of the market, with an estimated 30% of plastic waste being recycled each year. This figure underscores the importance of adhering to stringent recycling standards and advanced plastic waste stream management. Polymer compounding, a key process in the plastics industry, involves the addition of various additives to enhance the properties of base polymers.
- For instance, the use of rheological properties modifiers can improve the flow behavior of molten polymers during processing. In contrast, polymer characterization techniques, such as chromatographic separation and spectroscopic analysis, are essential for understanding the molecular structure and composition of plastics. This knowledge facilitates the development of sustainable plastics and the optimization of plastic part design. The ongoing evolution of plastics technology encompasses various processes, including plastic pyrolysis, gasification, and depolymerization, all aimed at enhancing plastic energy recovery and reducing waste.
How is this Commodity Plastics Industry segmented?
The commodity plastics industry research report provides comprehensive data (region-wise segment analysis), with forecasts and estimates in "USD billion" for the period 2024-2028, as well as historical data from 2018-2022 for the following segments.
- Product
- Polyethylene
- Polypropylene
- Polyvinyl chloride
- Polyethylene terephthalate
- End-User
- Packaging
- Consumer goods
- Electronics
- Automotive
- Others
- Application
- Films and Sheets
- Pipes and Fittings
- Automotive Components
- Household Products
- Geography
- North America
- US
- Canada
- Europe
- France
- Germany
- Italy
- UK
- Middle East and Africa
- Egypt
- KSA
- Oman
- UAE
- APAC
- China
- India
- Japan
- South America
- Argentina
- Brazil
- Rest of World (ROW)
- North America
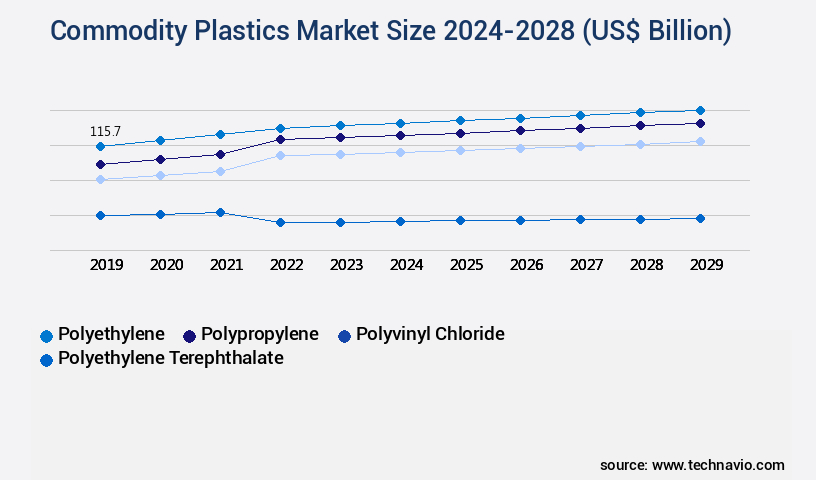
By Product Insights
The polyethylene segment is estimated to witness significant growth during the forecast period.
Polyethylene (PE), a versatile thermoplastic, is extensively used in various industries due to its lightweight, durability, and crystalline structure. It is the second most widely produced plastic globally, with packaging being a significant application. PE packaging, which involves enclosing products for protection, storage, distribution, and sales, utilizes high-density polyethylene (HDPE) and low-density polyethylene (LDPE) as primary materials. Polyethylene's production process involves the chemical synthesis of ethylene. This thermoplastic is further categorized into HDPE, LDPE, and linear low-density polyethylene (LLDPE), each with distinct properties. HDPE, known for its high density and rigidity, is commonly used for bottles and containers.
LDPE, with its low density and flexibility, is suitable for film applications. LLDPE combines the properties of both HDPE and LDPE. The plastic industry is continuously evolving, with advancements in additive manufacturing, fiber reinforcement materials, and plastic degradation kinetics. Additive manufacturing plastics enable the production of complex shapes and structures, while fiber reinforcement materials enhance the strength and durability of plastics. Plastic degradation pathways and kinetics are essential aspects of the industry, as understanding these factors can lead to improved product design and waste management. Polymer chain structure, molecular weight, and thermal stability are crucial factors affecting plastic properties.
Polystyrene, polyethylene terephthalate (PET), and polyvinyl chloride (PVC) are essential polymers with distinct properties. Polystyrene is known for its excellent insulation properties, while PET is widely used for packaging due to its high tensile strength and thermal stability. PVC, on the other hand, is valued for its flexibility and resistance to chemicals. Plastic recycling plays a significant role in the industry, with mechanical and chemical recycling methods being the primary approaches. Mechanical recycling involves the reprocessing of used plastics into new products, while chemical recycling converts waste plastics into their base chemicals for reuse. Plastic waste management is a critical issue, with ongoing efforts to improve recycling rates and reduce plastic pollution.
Plastic additives, such as color masterbatches, flame retardants, impact resistance enhancers, and UV stabilizers, are essential components of plastic production. These additives improve plastic properties and extend their applications across various sectors. Plastic material properties, such as tensile strength, flexural modulus, viscosity control, and impact resistance, are essential factors in determining their suitability for specific applications. Plastic production techniques, including injection molding, blow molding, and film extrusion, are continually evolving to meet the demands of various industries. Thermoforming applications, such as automotive, packaging, and construction, are significant markets for plastics. Plastic pipe manufacturing, composite materials, and polymer molecular weight are other essential aspects of the industry.
According to recent studies, the global PE market is expected to grow by 5.2% in the next year, with a further 4.5% growth anticipated in the following year. These figures reflect the industry's continuous expansion and the growing demand for PE-based products across various sectors.
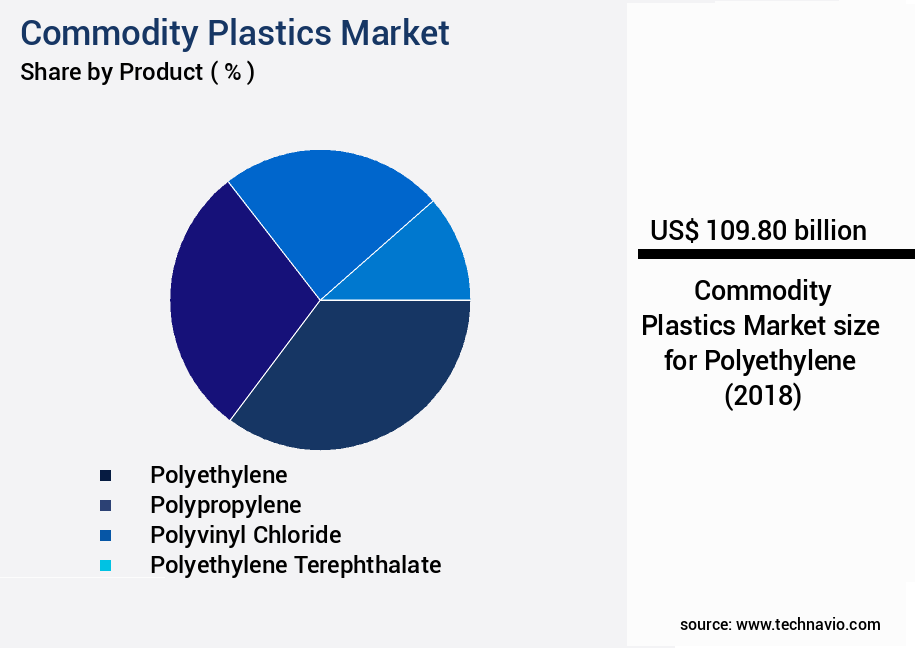
The Polyethylene segment was valued at USD 109.80 billion in 2018 and showed a gradual increase during the forecast period.
The Commodity Plastics Market is driven by innovations in polypropylene resin properties and applications, advances in high-density polyethylene film extrusion process, and low-density polyethylene packaging design guidelines that enhance product performance. Sustainability challenges focus on polyethylene terephthalate recycling challenges, mechanical recycling of polyethylene terephthalate, chemical recycling of polystyrene waste, and plastic waste management strategies and technologies, supported by plastic sorting technologies, plastic monomer recovery, depolymerization reaction, plastic pyrolysis process, and plastic gasification.
Material performance depends on plastic tensile strength and impact resistance, polymer molecular weight distribution analysis, plastic melt flow index measurement techniques, plastic flexural modulus and yield strength, and plastic uv resistance and stabilization. Research into polyvinyl chloride degradation mechanisms, polymer degradation kinetics and modeling, and plastic thermal stability and degradation supports innovation in plastic durability testing. Manufacturing efficiency is enhanced by plastic viscosity control in extrusion, plastic extrusion lines, plastic molding machines, polymer processing aids, and plastic surface treatment. Market trends are also shaped by plastic coating methods, plastic printing techniques, plastic labeling regulations, plastic recycling standards, and strategies for plastic waste reduction, with plastic product lifecycle, material flow analysis, and plastic waste streams influencing long-term sustainability.
Regional Analysis
APAC is estimated to contribute 36% to the growth of the global market during the forecast period.Technavio's analysts have elaborately explained the regional trends and drivers that shape the market during the forecast period.
See How Commodity Plastics Market Demand is Rising in APAC Request Free Sample
The market in Asia Pacific (APAC) is experiencing significant expansion, driven by the burgeoning industries of e-commerce, fast-moving consumer goods (FMCG), household appliances, and personal care. Countries like China and India are poised to become significant contributors to the market's revenue growth. The e-commerce sector in APAC is witnessing a surge due to the region's expanding population, which is fueling the demand for goods through online channels. According to recent estimates, the e-commerce market in APAC is projected to grow by 20% annually over the next five years. Furthermore, the FMCG sector is anticipated to expand by 12% yearly, contributing to the increased demand for commodity plastics.
Household appliances and personal care industries are also expected to witness a similar growth trajectory. The market in APAC is expected to grow by 15% in the next five years, as per industry reports. This growth is primarily due to the rising demand for plastics in various end-use industries and the region's expanding population. The market's expansion is also fueled by the increasing adoption of plastics in packaging applications, particularly in the food and beverage sector. Despite the challenges posed by environmental concerns, the market in APAC remains a promising area for growth.
Market Dynamics
Our researchers analyzed the data with 2023 as the base year, along with the key drivers, trends, and challenges. A holistic analysis of drivers will help companies refine their marketing strategies to gain a competitive advantage.
Enhancing Business Performance in the US the market: A Focus on Polypropylene, PET, PVC, and More The US the market is witnessing significant advancements in various sectors, from polypropylene (PP) to polyethylene terephthalate (PET), polyvinyl chloride (PVC), and beyond. Let's explore some key trends and improvements in these areas. Polypropylene (PP): With its excellent thermal stability and impact resistance, PP is widely used in various industries. The latest innovations focus on enhancing its properties, such as improving melt flow index measurement techniques and optimizing color masterbatch formulation for better color consistency. Polyethylene Terephthalate (PET): In the PET sector, recycling challenges persist, but progress is being made. Mechanical recycling and chemical recycling technologies are gaining traction, reducing plastic waste and improving sustainability. Polyvinyl Chloride (PVC): Understanding PVC degradation mechanisms is crucial for maintaining product quality and extending product life. Innovative additives can improve plastic stability, ensuring compliance with industry standards and enhancing overall performance. High-Density Polyethylene (HDPE): The film extrusion process for HDPE is undergoing efficiency improvements, with a focus on reducing downtime and increasing output. Advanced viscosity control techniques enable better process control and higher-quality products. Low-Density Polyethylene (LDPE): In LDPE packaging design, guidelines are being updated to optimize material usage and reduce environmental impact. Innovative design approaches can lead to significant reductions in material waste and cost savings. Staying informed about these trends and advancements can help businesses in the US the market stay competitive and maintain a strong market position. By focusing on performance improvements, efficiency gains, and sustainability, companies can drive growth and success in this dynamic industry.
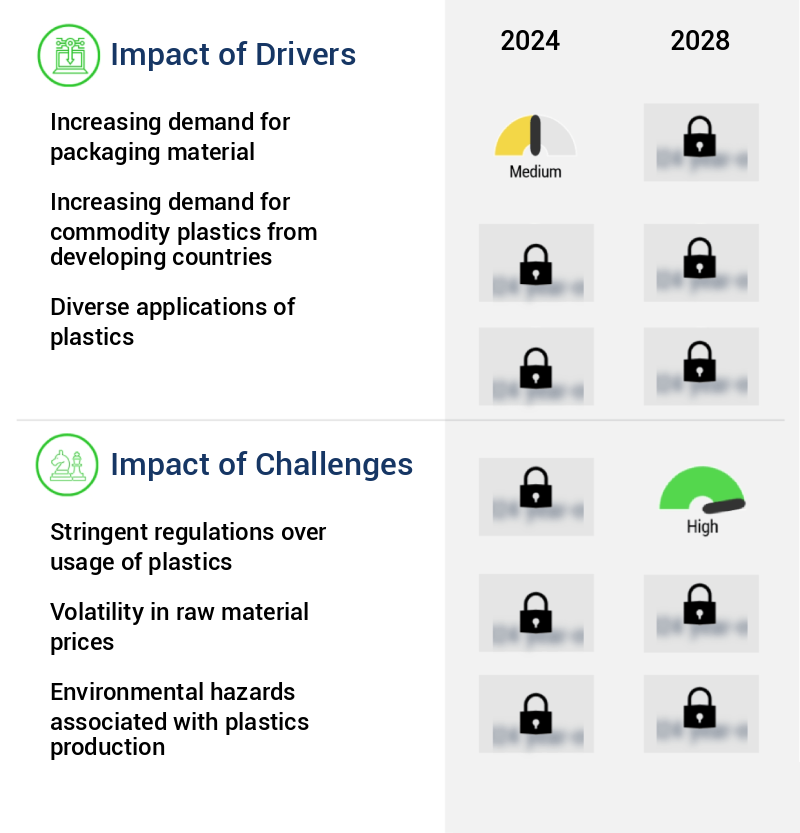
What are the key market drivers leading to the rise in the adoption of Commodity Plastics Industry?
- The packaging material market is driven primarily by the rising demand for these materials due to increasing consumer preferences for convenient and protective packaging solutions.
- The market has experienced significant growth and evolution in recent years, driven by the increasing demand for packaging materials across various industries. This trend was particularly pronounced during the COVID-19 pandemic, which led to a surge in demand for consumer goods, medical equipment, and other essential products. As a result, the demand for plastic packaging experienced notable growth. In the consumer goods sector, the shift towards e-commerce and grocery delivery services accelerated, leading to increased demand for flexible plastic packaging. With restaurants and food-service outlets shutting down, consumers turned to online channels for their daily staples and fresh food, resulting in a significant uptick in demand for packaging materials.
- The healthcare sector also saw a surge in demand for plastic packaging, as medical equipment and supplies became essential during the pandemic. Despite the challenges posed by the pandemic, the market continued to unfold, with new applications and trends emerging. For instance, there has been a growing interest in sustainable and biodegradable plastic alternatives, as businesses and consumers increasingly prioritize environmental concerns. Additionally, advancements in technology have led to the development of innovative plastic solutions, such as smart and active packaging, which offer enhanced functionality and improved consumer experience. In terms of numerical data, according to industry reports, the global plastic packaging market is projected to reach a value of over USD500 billion by 2027, growing at a steady pace during the forecast period.
- This growth is attributed to the increasing demand for plastic packaging in various end-use industries and the ongoing development of innovative plastic solutions. In conclusion, the market continues to evolve, driven by the increasing demand for packaging materials across various industries and the ongoing development of innovative plastic solutions. The market is expected to grow steadily in the coming years, with sustainable and biodegradable plastic alternatives and advanced plastic technologies being key areas of focus.
What are the market trends shaping the Commodity Plastics Industry?
- The use of advanced recycling techniques is becoming increasingly mandated in the market trend. Market trends now prioritize the implementation of sophisticated recycling methods.
- Commodity plastics, a significant segment of the global plastics industry, have been witnessing continuous evolution in response to growing environmental concerns and increasing demand across various sectors. According to estimates, approximately 8 million tons of plastic waste enter the ocean each year, a figure projected to reach two tons per minute by 2030 and potentially quadruple by 2050. This environmental issue has prompted commodity plastic manufacturers and end-users to focus on recycling initiatives. In October 2022, BASF SE, a leading player in the market, unveiled its commitment to a more sustainable plastics economy at the K 2022 trade fair.
- BASF presented several recyclable product packages and announced plans to expand existing recycling methods. This initiative is part of a larger trend, as companies increasingly prioritize sustainable solutions to mitigate the environmental impact of plastic production and consumption. The market encompasses a diverse range of applications, including packaging, construction, automotive, and consumer goods. In the packaging sector, the shift towards sustainable solutions has led to the development of biodegradable and recycled plastics. In construction, plastic pipes and insulation materials offer durability and cost-effectiveness. The automotive industry relies on commodity plastics for parts production, while consumer goods manufacturers utilize plastics for various applications, from household items to electronics.
- In conclusion, the market is undergoing significant changes as manufacturers and end-users respond to environmental concerns and shifting consumer preferences. Recycling initiatives and the development of sustainable alternatives are key drivers of market growth and innovation. BASF SE's commitment to a more sustainable plastics economy is a testament to the evolving nature of this dynamic market.
What challenges does the Commodity Plastics Industry face during its growth?
- The strict regulations governing the use of plastics pose a significant challenge to the industry's growth trajectory.
- The market encompasses a diverse range of plastic materials, primarily derived from fossil fuels, which have become integral to numerous industries due to their versatility and affordability. This market's continuous evolution is driven by the ongoing demand for plastics in various sectors, including packaging, construction, automotive, and electronics. In the US, the Food and Drug Administration (FDA) plays a crucial role in regulating the usage of plastics, particularly in food-contact applications. Polystyrene and polyethylene are among the plastics commonly used in food packaging. The FDA adheres to a rigorous approval process for these plastics to ensure their safety for food contact.
- The global plastics market is subject to increasing scrutiny due to the environmental concerns surrounding plastic pollution and the associated impact on ecosystems and human health. Governments worldwide are implementing regulations to mitigate the consequences of plastic usage. As a result, the market dynamics are continually unfolding, with emerging trends and technologies shaping the future of commodity plastics. Comparatively, the production of bioplastics, derived from renewable resources, is gaining traction as a sustainable alternative to fossil fuel-based plastics. Bioplastics offer a reduced carbon footprint and can effectively contribute to the reduction of plastic pollution. However, their production and adoption face challenges, including higher production costs and limited availability, compared to conventional plastics.
- In conclusion, the market is a dynamic and evolving landscape, shaped by regulatory requirements, technological advancements, and shifting consumer preferences. The ongoing efforts to reduce plastic pollution and minimize the environmental impact of plastics are driving innovation and change within the industry.
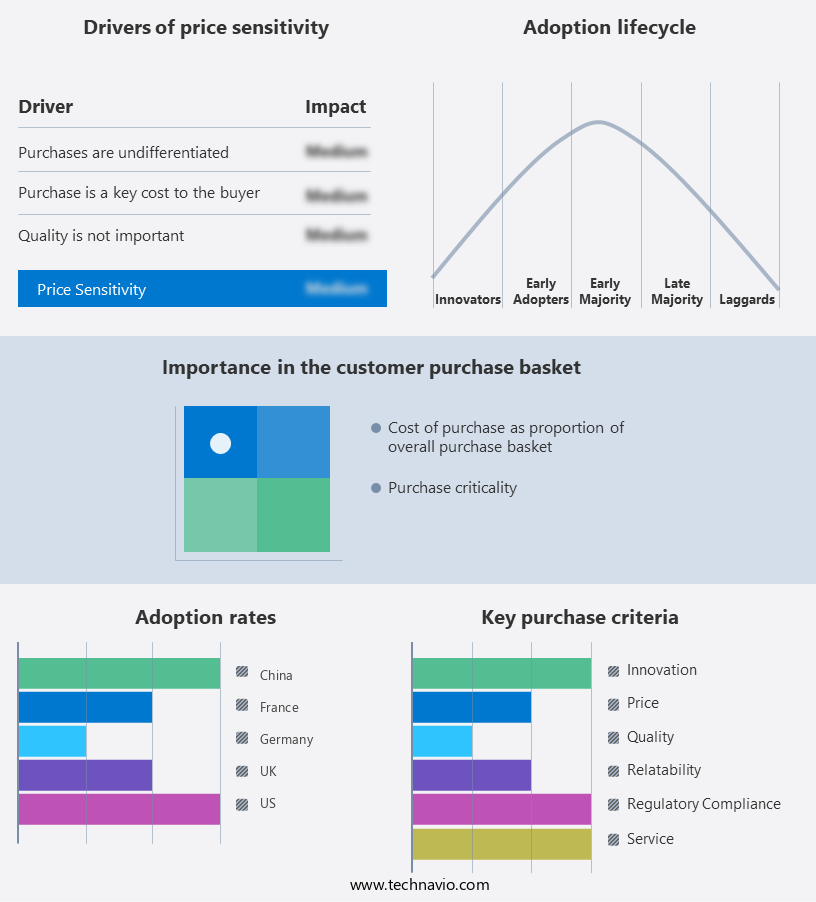
Exclusive Customer Landscape
The commodity plastics market forecasting report includes the adoption lifecycle of the market, covering from the innovator's stage to the laggard's stage. It focuses on adoption rates in different regions based on penetration. Furthermore, the commodity plastics market report also includes key purchase criteria and drivers of price sensitivity to help companies evaluate and develop their market growth analysis strategies.
Customer Landscape of Commodity Plastics Industry
Key Companies & Market Insights
Companies are implementing various strategies, such as strategic alliances, commodity plastics market forecast, partnerships, mergers and acquisitions, geographical expansion, and product/service launches, to enhance their presence in the industry.
BASF SE - This company specializes in producing commodity plastics, catering to various industries such as automotive, footwear, and electronics. Their product offerings provide essential solutions for these sectors, enhancing durability, functionality, and sustainability.
The industry research and growth report includes detailed analyses of the competitive landscape of the market and information about key companies, including:
- BASF SE
- Borealis AG
- Braskem
- Chevron Phillips Chemical Company
- China Petroleum & Chemical Corporation (Sinopec)
- Dow Inc.
- DuPont de Nemours, Inc.
- ExxonMobil Corporation
- Formosa Plastics Corporation
- INEOS Group
- LANXESS AG
- LG Chem
- LyondellBasell Industries
- Mitsubishi Chemical Corporation
- Reliance Industries Limited
- SABIC
- Sumitomo Chemical Co., Ltd.
- Toray Industries, Inc.
- TotalEnergies
- Westlake Chemical Corporation
Qualitative and quantitative analysis of companies has been conducted to help clients understand the wider business environment as well as the strengths and weaknesses of key industry players. Data is qualitatively analyzed to categorize companies as pure play, category-focused, industry-focused, and diversified; it is quantitatively analyzed to categorize companies as dominant, leading, strong, tentative, and weak.
Recent Development and News in Commodity Plastics Market
- In January 2024, LyondellBasell Industries N.V. (NYSE: LYB), a leading plastics manufacturer, announced the launch of its new Borstar PE 4522i polyethylene technology, enabling enhanced performance and reduced emissions for commodity plastics (LyondellBasell Press Release, 2024).
- In March 2024, BASF SE (ETR: BAS), the world's largest chemical producer, and TotalEnergies SE (EPA: TTE), a major energy company, entered into a strategic collaboration to develop and produce circular polymers from waste plastic (BASF Press Release, 2024).
- In April 2025, SABIC, a leading manufacturer of commodity plastics, completed the acquisition of Sinopec's 50% stake in their joint venture, Sinopec SABIC Petrochemicals Company Limited, expanding SABIC's market presence in China (SABIC Press Release, 2025).
- In May 2025, Dow Inc. (NYSE: DOW) and Corbion, a biotech company, announced a strategic partnership to commercialize bio-based polyethylene derived from renewable feedstocks, aiming to reduce the plastics industry's carbon footprint (Dow Inc. Press Release, 2025).
Research Analyst Overview
- The high-density polyethylene (HDPE) and low-density polyethylene (LDPE) markets continue to evolve, driven by advancements in plastic additive effects, impact resistance, and ultraviolet (UV) resistance. HDPE, known for its high strength and chemical resistance, is increasingly used in applications such as plastic pipe manufacturing and plastic film extrusion. HDPE's impact resistance is enhanced through the addition of elastomers, while UV resistance is improved with the incorporation of additives like titanium dioxide and antioxidants. LDPE, on the other hand, is widely used in packaging due to its flexibility and low cost. Its impact resistance can be boosted with the addition of plasticizers, while flame retardants like antimony trioxide and brominated flame retardants are used in certain applications.
- Polypropylene resin, another important player in the market, is valued for its high strength, heat resistance, and chemical resistance. Its impact resistance can be enhanced through the addition of impact modifiers, while UV resistance is improved with the use of additives like UV absorbers and hindered amine light stabilizers. The plastic industry is expected to grow at a rate of 4.5% annually, driven by increasing demand from various sectors, including automotive, construction, and packaging. HDPE and LDPE are expected to remain key contributors to this growth, with HDPE accounting for a larger market share due to its versatility and high demand in packaging and pipe applications.
- Plastic flame retardants, polypropylene resin, and plastic film extrusion are integral parts of this dynamic market, with ongoing research focusing on improving plastic properties, enhancing sustainability, and reducing environmental impact. Plastic pipe manufacturing, for instance, is increasingly turning to recycled materials and alternative manufacturing methods to reduce waste and improve efficiency. In conclusion, the market is a continuously evolving landscape, driven by advancements in plastic additives, manufacturing processes, and industry trends. HDPE, LDPE, and polypropylene resin remain key players, with ongoing research focusing on improving their properties and reducing their environmental impact. The market is expected to grow at a robust rate, driven by increasing demand from various sectors.
Dive into Technavio's robust research methodology, blending expert interviews, extensive data synthesis, and validated models for unparalleled Commodity Plastics Market insights. See full methodology.
|
Market Scope |
|
|
Report Coverage |
Details |
|
Page number |
186 |
|
Base year |
2023 |
|
Historic period |
2018-2022 |
|
Forecast period |
2024-2028 |
|
Growth momentum & CAGR |
Accelerate at a CAGR of 6.78% |
|
Market growth 2024-2028 |
USD 189.5 billion |
|
Market structure |
Fragmented |
|
YoY growth 2023-2024(%) |
6.23 |
|
Key countries |
US, Canada, Germany, UK, Italy, France, China, India, Japan, Brazil, Egypt, UAE, Oman, Argentina, KSA, UAE, Brazil, and Rest of World (ROW) |
|
Competitive landscape |
Leading Companies, Market Positioning of Companies, Competitive Strategies, and Industry Risks |
What are the Key Data Covered in this Commodity Plastics Market Research and Growth Report?
- CAGR of the Commodity Plastics industry during the forecast period
- Detailed information on factors that will drive the growth and forecasting between 2024 and 2028
- Precise estimation of the size of the market and its contribution of the industry in focus to the parent market
- Accurate predictions about upcoming growth and trends and changes in consumer behaviour
- Growth of the market across APAC, North America, Europe, South America, and Middle East and Africa
- Thorough analysis of the market's competitive landscape and detailed information about companies
- Comprehensive analysis of factors that will challenge the commodity plastics market growth of industry companies
We can help! Our analysts can customize this commodity plastics market research report to meet your requirements.
 RIA -
RIA - 
