Data Center GPU Market Analysis, Size, and Forecast 2026-2030: North America (US, Canada, and Mexico), APAC (China, India, and Japan), Europe (Germany, UK, and France), South America (Brazil and Argentina), Middle East and Africa (UAE, Saudi Arabia, and South Africa), and Rest of World (ROW)

Data Center GPU Market Analysis, Size, and Forecast 2026-2030:
North America (US, Canada, and Mexico), APAC (China, India, and Japan), Europe (Germany, UK, and France), South America (Brazil and Argentina), Middle East and Africa (UAE, Saudi Arabia, and South Africa), and Rest of World (ROW)

Published: Mar 2026 288 Pages SKU: IRTNTR77647

Market Overview at a Glance

$125.43 B
Market Opportunity
15.8%
CAGR 2025 - 2030
36.3%
North America Growth
$59.05 B
On-premises segment 2024

Data Center GPU Market Size 2026-2030

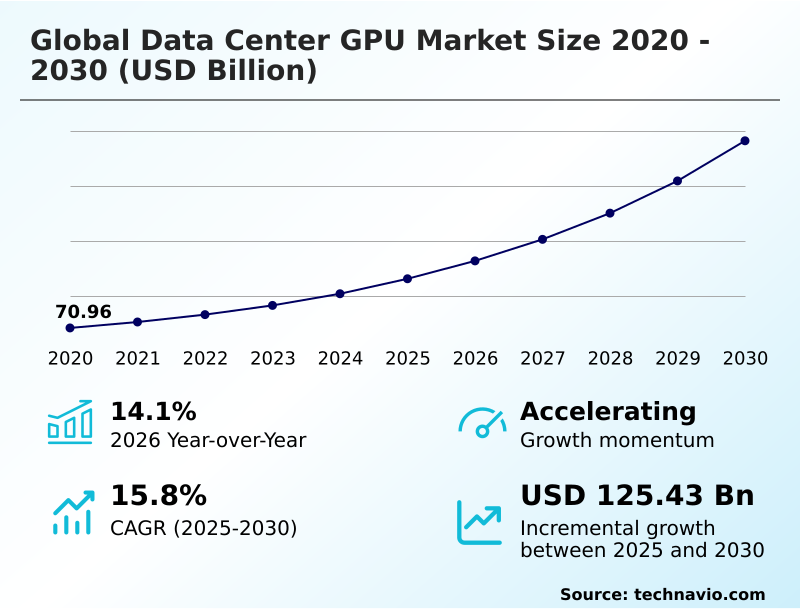
The data center gpu market size is valued to increase by USD 125.43 billion, at a CAGR of 15.8% from 2025 to 2030. Strategic expansion of AI training and trillion-parameter model development will drive the data center gpu market.

Major Market Trends & Insights

  • North America dominated the market and accounted for a 36.3% growth during the forecast period.
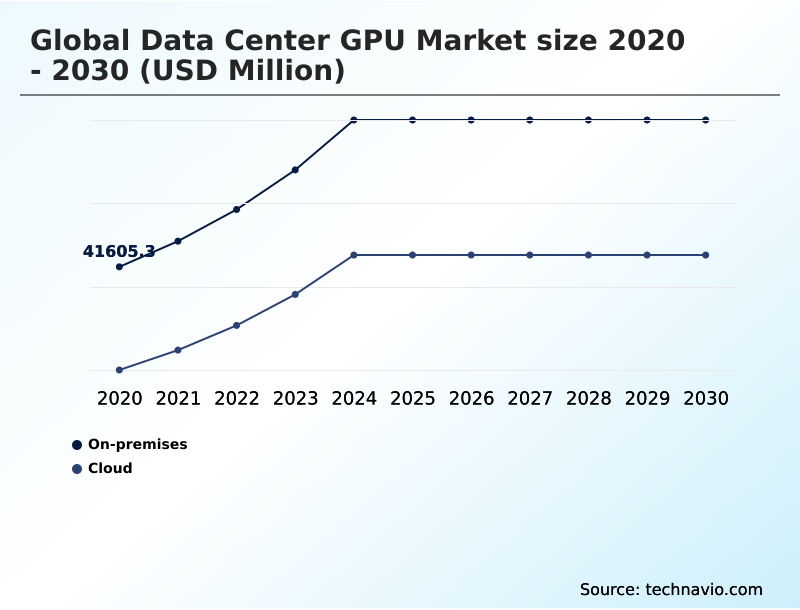
  • By Deployment - On-premises segment was valued at USD 59.05 billion in 2024
  • By Type - Training segment accounted for the largest market revenue share in 2024

Market Size & Forecast

  • Market Opportunities: USD 170.14 billion
  • Market Future Opportunities: USD 125.43 billion
  • CAGR from 2025 to 2030 : 15.8%

Market Summary

  • The data center GPU market is undergoing a structural transformation, shifting from general-purpose hardware to specialized accelerated computing. This evolution is driven by the computational demands of artificial intelligence, particularly large-scale model training and real-time inference. Modern GPUs leverage massively parallel architectures with thousands of cores to process complex algorithms far more efficiently than traditional CPUs.
  • This capability is essential for industries adopting AI into their core operations. For instance, a pharmaceutical firm can utilize GPU clusters to simulate molecular interactions, drastically reducing drug discovery timelines. The technology's ecosystem is also maturing, with advancements in high-bandwidth memory, interconnect fabrics, and cooling technologies becoming critical for sustaining performance gains.
  • As enterprises deploy more sophisticated AI applications, from predictive analytics to autonomous systems, the reliance on these powerful processors as the fundamental engine of digital innovation continues to intensify, shaping infrastructure investment strategies across the board.

What will be the Size of the Data Center GPU Market during the forecast period?

Get Key Insights on Market Forecast (PDF) Request Free Sample

How is the Data Center GPU Market Segmented?

The data center gpu industry research report provides comprehensive data (region-wise segment analysis), with forecasts and estimates in "USD million" for the period 2026-2030, as well as historical data from 2020-2024 for the following segments.

  • Deployment
    • On-premises
    • Cloud
  • Type
    • Training
    • Inference
  • Technology
    • Generative AI
    • ML
    • NLP
    • Computer vision
  • Geography
    • North America
      • US
      • Canada
      • Mexico
    • APAC
      • China
      • India
      • Japan
    • Europe
      • Germany
      • UK
      • France
    • South America
      • Brazil
      • Argentina
    • Middle East and Africa
      • UAE
      • Saudi Arabia
      • South Africa
    • Rest of World (ROW)

By Deployment Insights

The on-premises segment is estimated to witness significant growth during the forecast period.

On-premises deployment remains a critical segment for organizations prioritizing data sovereignty and performance control.

This model involves direct ownership of hardware, enabling deep customization of the parallel processing architecture and tensor core technology to reduce inference latency for specific AI tasks.

For sectors like finance and defense, local control mitigates security risks inherent in multi-tenant environments. While requiring significant capital for procurement and maintenance, this approach provides predictable training performance without concerns for external network bottlenecks.

The adoption of advanced chiplet design and hardware-agnostic compilers is improving the total cost of ownership, with some firms reporting a 15% reduction in project runtimes by optimizing their bespoke infrastructure, including systems with a reconfigurable dataflow unit or tensor streaming processor, for specialized, compute-intensive workloads using floating-point 4 precision.

Request Free Sample

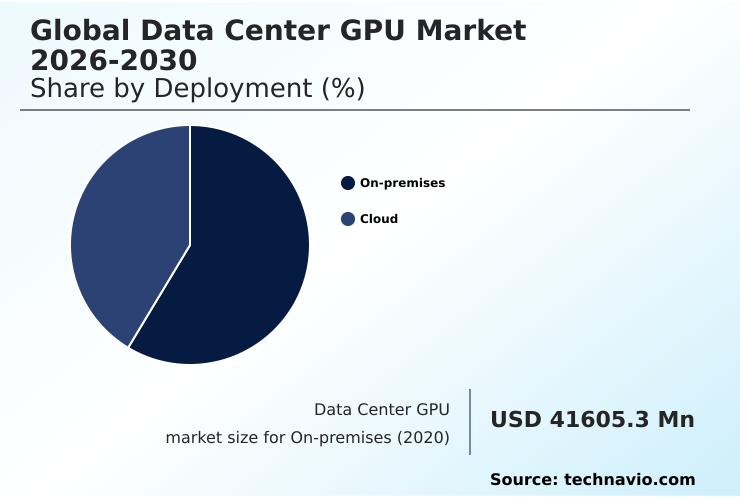
The On-premises segment was valued at USD 59.05 billion in 2024 and showed a gradual increase during the forecast period.

Request Free Sample

Regional Analysis

North America is estimated to contribute 36.3% to the growth of the global market during the forecast period.Technavio’s analysts have elaborately explained the regional trends and drivers that shape the market during the forecast period.

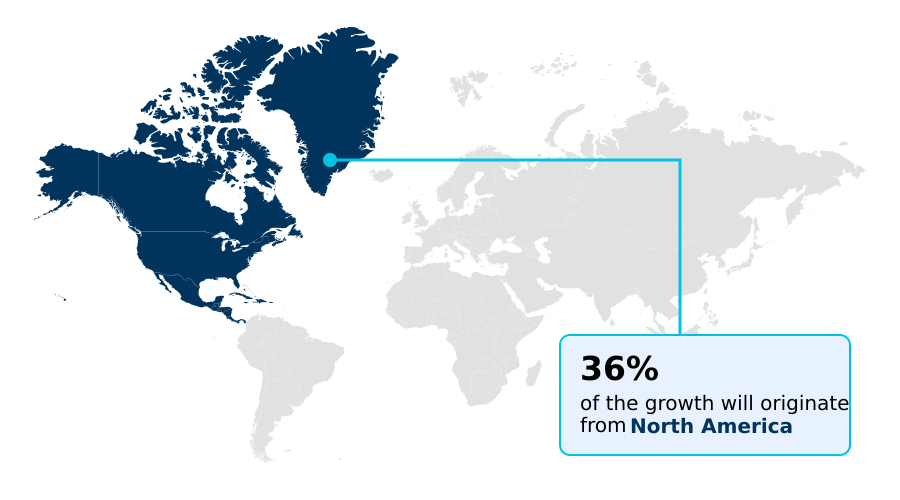
See How Data Center GPU Market Demand is Rising in North America Request Free Sample

The geographic landscape of the data center GPU market is dominated by North America, which accounts for over 36% of the opportunity, driven by massive investments from US-based hyperscalers in AI factory infrastructure.

This region is the epicenter for custom silicon development and high-density computing.

Meanwhile, the APAC region is the fastest-growing, contributing more than 32% to the incremental growth, fueled by national AI strategies and the build-out of digital economies in countries like China, India, and Japan.

Organizations are deploying server-side parallel computing solutions, including those with a wafer-scale engine, to gain a competitive edge. The demand for AI accelerators with double-precision floating-point capabilities remains high globally, supporting both scientific research and commercial high-performance computing tasks.

Market Dynamics

Our researchers analyzed the data with 2025 as the base year, along with the key drivers, trends, and challenges. A holistic analysis of drivers will help companies refine their marketing strategies to gain a competitive advantage.

  • Strategic investment in the Global Data Center GPU Market 2026-2030 requires a multifaceted evaluation beyond initial hardware acquisition. A thorough tco analysis of on-premise gpu clusters is essential, weighing capital expenditure against the long-term power consumption of high-performance gpus and operational costs.
  • Key technical considerations include the interconnect bandwidth for distributed training, which directly impacts the scalability and efficiency of large model development. The debate over custom silicon vs commercial gpu performance is intensifying, as hyperscalers demonstrate the benefits of tailored hardware. For many, software compatibility for ai accelerators remains a primary concern, influencing the choice between open-source and proprietary ecosystems.
  • The future of gpu chiplet technology promises greater customization and performance scaling. As deployments grow, understanding the thermal design power in server gpus and the benefits of liquid cooling for high-density racks becomes critical. Decision-makers must also assess the role of gpus in edge computing and the security risks in multi-tenant gpu clouds.
  • Exploring pcie 6.0 impact on gpu performance and comparing fp8 and fp4 precision gpus helps future-proof investments. The hbm supply chain for ai accelerators continues to be a factor in procurement timelines, while achieving a positive ai accelerator roi for enterprise depends on aligning hardware capabilities with specific business goals.
  • Efficient gpu virtualization for cloud environments and ensuring energy efficiency in gpu data centers are now standard operational requirements. Ultimately, success hinges on a holistic strategy that balances performance with sustainability and cost, a key determinant of the overall data center gpu market share.

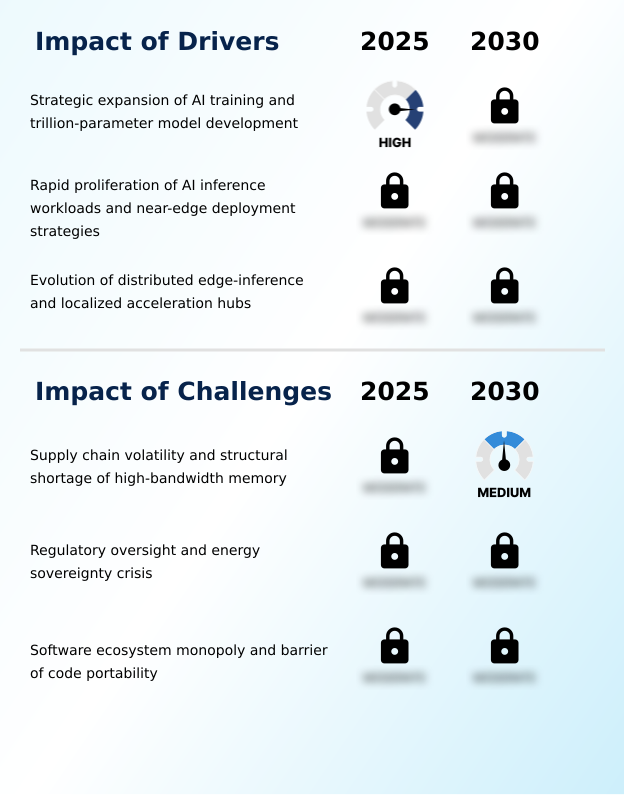
What are the key market drivers leading to the rise in the adoption of Data Center GPU Industry?

  • The strategic expansion of AI training capabilities and the development of computationally intensive trillion-parameter models are key drivers of market growth.

  • The primary market driver is the exponential growth of generative AI workloads, which require an accelerated computing framework to function effectively. The development of trillion-parameter models necessitates massive GPU clusters capable of exascale performance for both training and inference.
  • This demand for high-performance computing (HPC) has spurred significant investment in AI training infrastructure, with large language model (llm) processing needs increasing compute requirements by over 400% with each generation.
  • The focus on neural network optimization is intense, as enterprises seek to balance model complexity with operational costs. This has led to the rise of specialized autonomous digital assistants and predictive analytics engines that provide real-time insights, driving further adoption.

What are the market trends shaping the Data Center GPU Industry?

  • The market is witnessing a proliferation of liquid cooling architectures and high-density rack infrastructure. This shift addresses the increasing thermal demands of next-generation accelerators.

  • Market trends are coalescing around thermal and architectural efficiency to support next-generation accelerators. The adoption of advanced liquid cooling solutions is becoming standard for new builds, with direct-to-chip cooling and immersion cooling systems enabling denser rack-scale solutions. This shift allows for a 15% improvement in power usage effectiveness (PUE) over traditional air-cooled designs.
  • Architecturally, the move toward memory-centric architecture and advanced interconnect fabrics addresses performance bottlenecks, with next-generation interconnects doubling bandwidth for large-scale model training. Furthermore, AI sovereignty initiatives are driving regional investments in localized compute infrastructure, promoting data security and fostering specialized hardware development, supporting both AI training infrastructure and national strategic goals.

What challenges does the Data Center GPU Industry face during its growth?

  • Supply chain volatility and a structural shortage of high-bandwidth memory present a key challenge, impacting production and availability across the industry.

  • Significant market challenges stem from supply chain constraints and software complexities. The structural shortage of high-bandwidth memory (HBM) and advanced CoWoS packaging has created severe bottlenecks, extending lead times for top-tier GPUs by up to 50 weeks in some cases. This directly impacts supply chain resilience for hardware manufacturers.
  • Concurrently, issues with thermal throttling prevention in densely packed racks elevate operational costs, as energy consumption for a single high-power rack can increase by 25%. Another hurdle is ensuring software ecosystem portability across different hardware platforms, which complicates workload optimization. Addressing the limitations of reticle-limited dies through innovative design is essential for future performance gains.

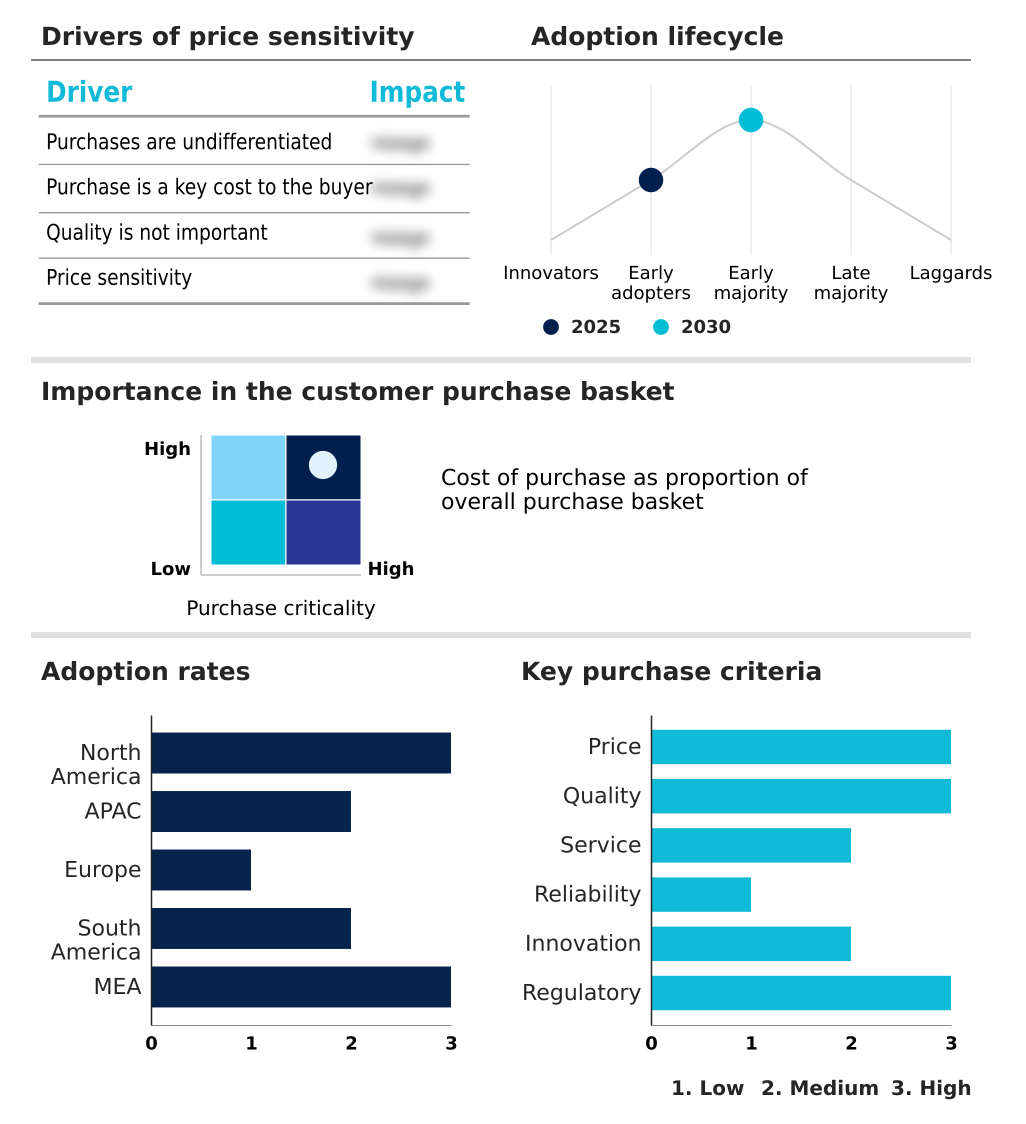
Exclusive Technavio Analysis on Customer Landscape

The data center gpu market forecasting report includes the adoption lifecycle of the market, covering from the innovator’s stage to the laggard’s stage. It focuses on adoption rates in different regions based on penetration. Furthermore, the data center gpu market report also includes key purchase criteria and drivers of price sensitivity to help companies evaluate and develop their market growth analysis strategies.

Customer Landscape of Data Center GPU Industry

Competitive Landscape

Companies are implementing various strategies, such as strategic alliances, data center gpu market forecast, partnerships, mergers and acquisitions, geographical expansion, and product/service launches, to enhance their presence in the industry.

Advanced Micro Devices Inc. - Offerings are centered on high-performance compute for AI training and HPC workloads, delivering data center GPUs designed for energy-efficient scalability and accelerated performance.

The industry research and growth report includes detailed analyses of the competitive landscape of the market and information about key companies, including:

  • Advanced Micro Devices Inc.
  • Alibaba Group Holding Ltd.
  • Amazon Web Services Inc.
  • Baidu Inc.
  • Broadcom Inc.
  • Cerebras Systems Inc.
  • Etched
  • Fujitsu Ltd.
  • Google LLC
  • Graphcore Ltd.
  • Groq Inc.
  • Huawei Technologies Co. Ltd.
  • IBM Corp.
  • Intel Corp.
  • Microsoft Corp.
  • NVIDIA Corp.
  • Qualcomm Inc.
  • Rivos Inc.
  • SambaNova Systems Inc.
  • Tenstorrent Inc.

Qualitative and quantitative analysis of companies has been conducted to help clients understand the wider business environment as well as the strengths and weaknesses of key industry players. Data is qualitatively analyzed to categorize companies as pure play, category-focused, industry-focused, and diversified; it is quantitatively analyzed to categorize companies as dominant, leading, strong, tentative, and weak.

Recent Development and News in Data center gpu market

  • In March 2025, NVIDIA Corp. announced the first large-scale commercial deployments of its Blackwell GPU architecture in North American high-performance computing centers, enabling trillion-parameter AI model processing.
  • In January 2025, Advanced Micro Devices Inc. revealed a strategic partnership with a major cloud provider to integrate its next-generation Instinct MI-series accelerators, expanding options for enterprise AI training workloads.
  • In November 2024, Intel Corp. launched its next-generation AI accelerator, emphasizing an open-standard software approach to challenge proprietary ecosystems and improve code portability for developers.
  • In September 2024, Google LLC began rolling out its latest generation of Tensor Processing Units (TPUs) across its cloud platform, offering a highly optimized alternative for large-scale inference and training.

Dive into Technavio’s robust research methodology, blending expert interviews, extensive data synthesis, and validated models for unparalleled Data Center GPU Market insights. See full methodology.

Market Scope
Page number 288
Base year 2025
Historic period 2020-2024
Forecast period 2026-2030
Growth momentum & CAGR Accelerate at a CAGR of 15.8%
Market growth 2026-2030 USD 125433.2 million
Market structure Fragmented
YoY growth 2025-2026(%) 14.1%
Key countries US, Canada, Mexico, China, India, Japan, South Korea, Singapore, Australia, Germany, UK, France, Italy, The Netherlands, Spain, Brazil, Argentina, Chile, UAE, Saudi Arabia, South Africa, Israel and Egypt
Competitive landscape Leading Companies, Market Positioning of Companies, Competitive Strategies, and Industry Risks

Request Free Sample

Research Analyst Overview

  • The data center GPU market's trajectory is defined by a relentless pursuit of computational density, driven by generative AI workloads. This has forced a strategic pivot to an accelerated computing framework, where rack-scale solutions and GPU clusters are fundamental. The industry is moving beyond monolithic chips toward chiplet design and advanced reticle-limited dies to achieve exascale performance.
  • Managing this power requires innovation in liquid cooling solutions, including direct-to-chip cooling and immersion cooling systems, for thermal throttling prevention and improved power usage effectiveness (PUE). Core to these systems are parallel processing architecture and tensor core technology, optimized for neural network optimization and both training performance and low inference latency.
  • High-bandwidth memory (HBM) and advanced interconnect fabrics are critical enablers, though CoWoS packaging remains a bottleneck. Boardroom decisions now weigh the benefits of custom silicon development against reliance on established vendors, with hardware-agnostic compilers and open platforms like those using a reconfigurable dataflow unit or a tensor streaming processor gaining traction.
  • For enterprises, deploying high-performance computing (HPC) infrastructure with processors supporting double-precision floating-point and floating-point 4 precision has reduced complex simulation times by over 25%, influencing budgeting for future AI factory infrastructure and AI sovereignty initiatives. This landscape demands a holistic approach, integrating everything from server-side parallel computing to memory-centric architecture and even unconventional designs like a wafer-scale engine.

What are the Key Data Covered in this Data Center GPU Market Research and Growth Report?

  • What is the expected growth of the Data Center GPU Market between 2026 and 2030?

    • USD 125.43 billion, at a CAGR of 15.8%

  • What segmentation does the market report cover?

    • The report is segmented by Deployment (On-premises, and Cloud), Type (Training, and Inference), Technology (Generative AI, ML, NLP, and Computer vision) and Geography (North America, APAC, Europe, South America, Middle East and Africa)

  • Which regions are analyzed in the report?

    • North America, APAC, Europe, South America and Middle East and Africa

  • What are the key growth drivers and market challenges?

    • Strategic expansion of AI training and trillion-parameter model development, Supply chain volatility and structural shortage of high-bandwidth memory

  • Who are the major players in the Data Center GPU Market?

    • Advanced Micro Devices Inc., Alibaba Group Holding Ltd., Amazon Web Services Inc., Baidu Inc., Broadcom Inc., Cerebras Systems Inc., Etched, Fujitsu Ltd., Google LLC, Graphcore Ltd., Groq Inc., Huawei Technologies Co. Ltd., IBM Corp., Intel Corp., Microsoft Corp., NVIDIA Corp., Qualcomm Inc., Rivos Inc., SambaNova Systems Inc. and Tenstorrent Inc.

Market Research Insights

  • The market's dynamics are shaped by the dual demands for raw computational throughput and operational efficiency. The integration of platform-level solutions has demonstrably improved workload optimization, with some enterprises achieving a 20% greater utilization of virtualized GPU resources. Concurrently, the push for real-time inference at the edge is driving architectural innovation.
  • Strategic adoption of a cohesive silicon-to-software stack enables organizations to streamline MLOps pipelines, reducing model deployment times by up to 30%. This focus on hybrid cloud integration and energy-efficient scalability is critical as businesses balance performance needs with rising operational costs and sustainability mandates.

We can help! Our analysts can customize this data center gpu market research report to meet your requirements.

Get in touch

1. Executive Summary

1.1 Market overview

Executive Summary - Chart on Market Overview
Executive Summary - Data Table on Market Overview
Executive Summary - Chart on Global Market Characteristics
Executive Summary - Chart on Market by Geography
Executive Summary - Chart on Market Segmentation by Deployment
Executive Summary - Chart on Market Segmentation by Type
Executive Summary - Chart on Market Segmentation by Technology
Executive Summary - Chart on Incremental Growth
Executive Summary - Data Table on Incremental Growth
Executive Summary - Chart on Company Market Positioning

2. Technavio Analysis

2.1 Analysis of price sensitivity, lifecycle, customer purchase basket, adoption rates, and purchase criteria

2.2 Criticality of inputs and Factors of differentiation

Chart on Overview on criticality of inputs and factors of differentiation

2.3 Factors of disruption

Chart on Overview on factors of disruption

2.4 Impact of drivers and challenges

Chart on Impact of drivers and challenges in 2025 and 2030

3. Market Landscape

3.1 Market ecosystem

Chart on Parent Market
Data Table on - Parent Market

3.2 Market characteristics

Chart on Market characteristics analysis

3.3 Value chain analysis

Chart on Value chain analysis

4. Market Sizing

4.1 Market definition

Data Table on Offerings of companies included in the market definition

4.2 Market segment analysis

Market segments

4.3 Market size 2025

4.4 Market outlook: Forecast for 2025-2030

Chart on Global - Market size and forecast 2025-2030 ($ million)
Data Table on Global - Market size and forecast 2025-2030 ($ million)
Chart on Global Market: Year-over-year growth 2025-2030 (%)
Data Table on Global Market: Year-over-year growth 2025-2030 (%)

5. Historic Market Size

5.1 Global Data Center GPU Market 2020 - 2024

Historic Market Size - Data Table on Global Data Center GPU Market 2020 - 2024 ($ million)

5.2 Deployment segment analysis 2020 - 2024

Historic Market Size - Deployment Segment 2020 - 2024 ($ million)

5.3 Type segment analysis 2020 - 2024

Historic Market Size - Type Segment 2020 - 2024 ($ million)

5.4 Technology segment analysis 2020 - 2024

Historic Market Size - Technology Segment 2020 - 2024 ($ million)

5.5 Geography segment analysis 2020 - 2024

Historic Market Size - Geography Segment 2020 - 2024 ($ million)

5.6 Country segment analysis 2020 - 2024

Historic Market Size - Country Segment 2020 - 2024 ($ million)

6. Qualitative Analysis

6.1 Impact of AI in global data center GPU market

7. Five Forces Analysis

7.1 Five forces summary

Five forces analysis - Comparison between 2025 and 2030

7.2 Bargaining power of buyers

Bargaining power of buyers - Impact of key factors 2025 and 2030

7.3 Bargaining power of suppliers

Bargaining power of suppliers - Impact of key factors in 2025 and 2030

7.4 Threat of new entrants

Threat of new entrants - Impact of key factors in 2025 and 2030

7.5 Threat of substitutes

Threat of substitutes - Impact of key factors in 2025 and 2030

7.6 Threat of rivalry

Threat of rivalry - Impact of key factors in 2025 and 2030

7.7 Market condition

Chart on Market condition - Five forces 2025 and 2030

8. Market Segmentation by Deployment

8.1 Market segments

Chart on Deployment - Market share 2025-2030 (%)
Data Table on Deployment - Market share 2025-2030 (%)

8.2 Comparison by Deployment

Chart on Comparison by Deployment
Data Table on Comparison by Deployment

8.3 On-premises - Market size and forecast 2025-2030

Chart on On-premises - Market size and forecast 2025-2030 ($ million)
Data Table on On-premises - Market size and forecast 2025-2030 ($ million)
Chart on On-premises - Year-over-year growth 2025-2030 (%)
Data Table on On-premises - Year-over-year growth 2025-2030 (%)

8.4 Cloud - Market size and forecast 2025-2030

Chart on Cloud - Market size and forecast 2025-2030 ($ million)
Data Table on Cloud - Market size and forecast 2025-2030 ($ million)
Chart on Cloud - Year-over-year growth 2025-2030 (%)
Data Table on Cloud - Year-over-year growth 2025-2030 (%)

8.5 Market opportunity by Deployment

Market opportunity by Deployment ($ million)
Data Table on Market opportunity by Deployment ($ million)

9. Market Segmentation by Type

9.1 Market segments

Chart on Type - Market share 2025-2030 (%)
Data Table on Type - Market share 2025-2030 (%)

9.2 Comparison by Type

Chart on Comparison by Type
Data Table on Comparison by Type

9.3 Training - Market size and forecast 2025-2030

Chart on Training - Market size and forecast 2025-2030 ($ million)
Data Table on Training - Market size and forecast 2025-2030 ($ million)
Chart on Training - Year-over-year growth 2025-2030 (%)
Data Table on Training - Year-over-year growth 2025-2030 (%)

9.4 Inference - Market size and forecast 2025-2030

Chart on Inference - Market size and forecast 2025-2030 ($ million)
Data Table on Inference - Market size and forecast 2025-2030 ($ million)
Chart on Inference - Year-over-year growth 2025-2030 (%)
Data Table on Inference - Year-over-year growth 2025-2030 (%)

9.5 Market opportunity by Type

Market opportunity by Type ($ million)
Data Table on Market opportunity by Type ($ million)

10. Market Segmentation by Technology

10.1 Market segments

Chart on Technology - Market share 2025-2030 (%)
Data Table on Technology - Market share 2025-2030 (%)

10.2 Comparison by Technology

Chart on Comparison by Technology
Data Table on Comparison by Technology

10.3 Generative AI - Market size and forecast 2025-2030

Chart on Generative AI - Market size and forecast 2025-2030 ($ million)
Data Table on Generative AI - Market size and forecast 2025-2030 ($ million)
Chart on Generative AI - Year-over-year growth 2025-2030 (%)
Data Table on Generative AI - Year-over-year growth 2025-2030 (%)

10.4 ML - Market size and forecast 2025-2030

Chart on ML - Market size and forecast 2025-2030 ($ million)
Data Table on ML - Market size and forecast 2025-2030 ($ million)
Chart on ML - Year-over-year growth 2025-2030 (%)
Data Table on ML - Year-over-year growth 2025-2030 (%)

10.5 NLP - Market size and forecast 2025-2030

Chart on NLP - Market size and forecast 2025-2030 ($ million)
Data Table on NLP - Market size and forecast 2025-2030 ($ million)
Chart on NLP - Year-over-year growth 2025-2030 (%)
Data Table on NLP - Year-over-year growth 2025-2030 (%)

10.6 Computer vision - Market size and forecast 2025-2030

Chart on Computer vision - Market size and forecast 2025-2030 ($ million)
Data Table on Computer vision - Market size and forecast 2025-2030 ($ million)
Chart on Computer vision - Year-over-year growth 2025-2030 (%)
Data Table on Computer vision - Year-over-year growth 2025-2030 (%)

10.7 Market opportunity by Technology

Market opportunity by Technology ($ million)
Data Table on Market opportunity by Technology ($ million)

11. Customer Landscape

11.1 Customer landscape overview

Analysis of price sensitivity, lifecycle, customer purchase basket, adoption rates, and purchase criteria

12. Geographic Landscape

12.1 Geographic segmentation

Chart on Market share by geography 2025-2030 (%)
Data Table on Market share by geography 2025-2030 (%)

12.2 Geographic comparison

Chart on Geographic comparison
Data Table on Geographic comparison

12.3 North America - Market size and forecast 2025-2030

Chart on North America - Market size and forecast 2025-2030 ($ million)
Data Table on North America - Market size and forecast 2025-2030 ($ million)
Chart on North America - Year-over-year growth 2025-2030 (%)
Data Table on North America - Year-over-year growth 2025-2030 (%)
Chart on Regional Comparison - North America
Data Table on Regional Comparison - North America

12.3.1 US - Market size and forecast 2025-2030

Chart on US - Market size and forecast 2025-2030 ($ million)
Data Table on US - Market size and forecast 2025-2030 ($ million)
Chart on US - Year-over-year growth 2025-2030 (%)
Data Table on US - Year-over-year growth 2025-2030 (%)

12.3.2 Canada - Market size and forecast 2025-2030

Chart on Canada - Market size and forecast 2025-2030 ($ million)
Data Table on Canada - Market size and forecast 2025-2030 ($ million)
Chart on Canada - Year-over-year growth 2025-2030 (%)
Data Table on Canada - Year-over-year growth 2025-2030 (%)

12.3.3 Mexico - Market size and forecast 2025-2030

Chart on Mexico - Market size and forecast 2025-2030 ($ million)
Data Table on Mexico - Market size and forecast 2025-2030 ($ million)
Chart on Mexico - Year-over-year growth 2025-2030 (%)
Data Table on Mexico - Year-over-year growth 2025-2030 (%)

12.4 APAC - Market size and forecast 2025-2030

Chart on APAC - Market size and forecast 2025-2030 ($ million)
Data Table on APAC - Market size and forecast 2025-2030 ($ million)
Chart on APAC - Year-over-year growth 2025-2030 (%)
Data Table on APAC - Year-over-year growth 2025-2030 (%)
Chart on Regional Comparison - APAC
Data Table on Regional Comparison - APAC

12.4.1 China - Market size and forecast 2025-2030

Chart on China - Market size and forecast 2025-2030 ($ million)
Data Table on China - Market size and forecast 2025-2030 ($ million)
Chart on China - Year-over-year growth 2025-2030 (%)
Data Table on China - Year-over-year growth 2025-2030 (%)

12.4.2 India - Market size and forecast 2025-2030

Chart on India - Market size and forecast 2025-2030 ($ million)
Data Table on India - Market size and forecast 2025-2030 ($ million)
Chart on India - Year-over-year growth 2025-2030 (%)
Data Table on India - Year-over-year growth 2025-2030 (%)

12.4.3 Japan - Market size and forecast 2025-2030

Chart on Japan - Market size and forecast 2025-2030 ($ million)
Data Table on Japan - Market size and forecast 2025-2030 ($ million)
Chart on Japan - Year-over-year growth 2025-2030 (%)
Data Table on Japan - Year-over-year growth 2025-2030 (%)

12.4.4 South Korea - Market size and forecast 2025-2030

Chart on South Korea - Market size and forecast 2025-2030 ($ million)
Data Table on South Korea - Market size and forecast 2025-2030 ($ million)
Chart on South Korea - Year-over-year growth 2025-2030 (%)
Data Table on South Korea - Year-over-year growth 2025-2030 (%)

12.4.5 Singapore - Market size and forecast 2025-2030

Chart on Singapore - Market size and forecast 2025-2030 ($ million)
Data Table on Singapore - Market size and forecast 2025-2030 ($ million)
Chart on Singapore - Year-over-year growth 2025-2030 (%)
Data Table on Singapore - Year-over-year growth 2025-2030 (%)

12.4.6 Australia - Market size and forecast 2025-2030

Chart on Australia - Market size and forecast 2025-2030 ($ million)
Data Table on Australia - Market size and forecast 2025-2030 ($ million)
Chart on Australia - Year-over-year growth 2025-2030 (%)
Data Table on Australia - Year-over-year growth 2025-2030 (%)

12.5 Europe - Market size and forecast 2025-2030

Chart on Europe - Market size and forecast 2025-2030 ($ million)
Data Table on Europe - Market size and forecast 2025-2030 ($ million)
Chart on Europe - Year-over-year growth 2025-2030 (%)
Data Table on Europe - Year-over-year growth 2025-2030 (%)
Chart on Regional Comparison - Europe
Data Table on Regional Comparison - Europe

12.5.1 Germany - Market size and forecast 2025-2030

Chart on Germany - Market size and forecast 2025-2030 ($ million)
Data Table on Germany - Market size and forecast 2025-2030 ($ million)
Chart on Germany - Year-over-year growth 2025-2030 (%)
Data Table on Germany - Year-over-year growth 2025-2030 (%)

12.5.2 UK - Market size and forecast 2025-2030

Chart on UK - Market size and forecast 2025-2030 ($ million)
Data Table on UK - Market size and forecast 2025-2030 ($ million)
Chart on UK - Year-over-year growth 2025-2030 (%)
Data Table on UK - Year-over-year growth 2025-2030 (%)

12.5.3 France - Market size and forecast 2025-2030

Chart on France - Market size and forecast 2025-2030 ($ million)
Data Table on France - Market size and forecast 2025-2030 ($ million)
Chart on France - Year-over-year growth 2025-2030 (%)
Data Table on France - Year-over-year growth 2025-2030 (%)

12.5.4 Italy - Market size and forecast 2025-2030

Chart on Italy - Market size and forecast 2025-2030 ($ million)
Data Table on Italy - Market size and forecast 2025-2030 ($ million)
Chart on Italy - Year-over-year growth 2025-2030 (%)
Data Table on Italy - Year-over-year growth 2025-2030 (%)

12.5.5 The Netherlands - Market size and forecast 2025-2030

Chart on The Netherlands - Market size and forecast 2025-2030 ($ million)
Data Table on The Netherlands - Market size and forecast 2025-2030 ($ million)
Chart on The Netherlands - Year-over-year growth 2025-2030 (%)
Data Table on The Netherlands - Year-over-year growth 2025-2030 (%)

12.5.6 Spain - Market size and forecast 2025-2030

Chart on Spain - Market size and forecast 2025-2030 ($ million)
Data Table on Spain - Market size and forecast 2025-2030 ($ million)
Chart on Spain - Year-over-year growth 2025-2030 (%)
Data Table on Spain - Year-over-year growth 2025-2030 (%)

12.6 South America - Market size and forecast 2025-2030

Chart on South America - Market size and forecast 2025-2030 ($ million)
Data Table on South America - Market size and forecast 2025-2030 ($ million)
Chart on South America - Year-over-year growth 2025-2030 (%)
Data Table on South America - Year-over-year growth 2025-2030 (%)
Chart on Regional Comparison - South America
Data Table on Regional Comparison - South America

12.6.1 Brazil - Market size and forecast 2025-2030

Chart on Brazil - Market size and forecast 2025-2030 ($ million)
Data Table on Brazil - Market size and forecast 2025-2030 ($ million)
Chart on Brazil - Year-over-year growth 2025-2030 (%)
Data Table on Brazil - Year-over-year growth 2025-2030 (%)

12.6.2 Argentina - Market size and forecast 2025-2030

Chart on Argentina - Market size and forecast 2025-2030 ($ million)
Data Table on Argentina - Market size and forecast 2025-2030 ($ million)
Chart on Argentina - Year-over-year growth 2025-2030 (%)
Data Table on Argentina - Year-over-year growth 2025-2030 (%)

12.6.3 Chile - Market size and forecast 2025-2030

Chart on Chile - Market size and forecast 2025-2030 ($ million)
Data Table on Chile - Market size and forecast 2025-2030 ($ million)
Chart on Chile - Year-over-year growth 2025-2030 (%)
Data Table on Chile - Year-over-year growth 2025-2030 (%)

12.7 Middle East and Africa - Market size and forecast 2025-2030

Chart on Middle East and Africa - Market size and forecast 2025-2030 ($ million)
Data Table on Middle East and Africa - Market size and forecast 2025-2030 ($ million)
Chart on Middle East and Africa - Year-over-year growth 2025-2030 (%)
Data Table on Middle East and Africa - Year-over-year growth 2025-2030 (%)
Chart on Regional Comparison - Middle East and Africa
Data Table on Regional Comparison - Middle East and Africa

12.7.1 UAE - Market size and forecast 2025-2030

Chart on UAE - Market size and forecast 2025-2030 ($ million)
Data Table on UAE - Market size and forecast 2025-2030 ($ million)
Chart on UAE - Year-over-year growth 2025-2030 (%)
Data Table on UAE - Year-over-year growth 2025-2030 (%)

12.7.2 Saudi Arabia - Market size and forecast 2025-2030

Chart on Saudi Arabia - Market size and forecast 2025-2030 ($ million)
Data Table on Saudi Arabia - Market size and forecast 2025-2030 ($ million)
Chart on Saudi Arabia - Year-over-year growth 2025-2030 (%)
Data Table on Saudi Arabia - Year-over-year growth 2025-2030 (%)

12.7.3 South Africa - Market size and forecast 2025-2030

Chart on South Africa - Market size and forecast 2025-2030 ($ million)
Data Table on South Africa - Market size and forecast 2025-2030 ($ million)
Chart on South Africa - Year-over-year growth 2025-2030 (%)
Data Table on South Africa - Year-over-year growth 2025-2030 (%)

12.7.4 Israel - Market size and forecast 2025-2030

Chart on Israel - Market size and forecast 2025-2030 ($ million)
Data Table on Israel - Market size and forecast 2025-2030 ($ million)
Chart on Israel - Year-over-year growth 2025-2030 (%)
Data Table on Israel - Year-over-year growth 2025-2030 (%)

12.7.5 Egypt - Market size and forecast 2025-2030

Chart on Egypt - Market size and forecast 2025-2030 ($ million)
Data Table on Egypt - Market size and forecast 2025-2030 ($ million)
Chart on Egypt - Year-over-year growth 2025-2030 (%)
Data Table on Egypt - Year-over-year growth 2025-2030 (%)

12.8 Market opportunity by geography

Market opportunity by geography ($ million)
Data Tables on Market opportunity by geography ($ million)

13. Drivers, Challenges, and Opportunity

13.1 Market drivers

Strategic expansion of AI training and trillion-parameter model development
Rapid proliferation of AI inference workloads and near-edge deployment strategies
Evolution of distributed edge-inference and localized acceleration hubs

13.2 Market challenges

Supply chain volatility and structural shortage of high-bandwidth memory
Regulatory oversight and energy sovereignty crisis
Software ecosystem monopoly and barrier of code portability

13.3 Impact of drivers and challenges

Impact of drivers and challenges in 2025 and 2030

13.4 Market opportunities

Proliferation of liquid cooling architectures and high-density rack infrastructure
Structural transition toward memory-centric architectures and high-bandwidth integration
Expansion of AI sovereignty and custom silicon in regional data center corridors

14. Competitive Landscape

14.1 Overview

14.2

Overview on criticality of inputs and factors of differentiation

14.3 Landscape disruption

Overview on factors of disruption

14.4 Industry risks

Impact of key risks on business

15. Competitive Analysis

15.1 Companies profiled

Companies covered

15.2 Company ranking index

15.3 Market positioning of companies

Matrix on companies position and classification

15.4 Advanced Micro Devices Inc.

Advanced Micro Devices Inc. - Overview
Advanced Micro Devices Inc. - Business segments
Advanced Micro Devices Inc. - Key news
Advanced Micro Devices Inc. - Key offerings
Advanced Micro Devices Inc. - Segment focus
SWOT

15.5 Amazon Web Services Inc.

Amazon Web Services Inc. - Overview
Amazon Web Services Inc. - Product / Service
Amazon Web Services Inc. - Key news
Amazon Web Services Inc. - Key offerings
SWOT

15.6 Broadcom Inc.

Broadcom Inc. - Overview
Broadcom Inc. - Business segments
Broadcom Inc. - Key news
Broadcom Inc. - Key offerings
Broadcom Inc. - Segment focus
SWOT

15.7 Cerebras Systems Inc.

Cerebras Systems Inc. - Overview
Cerebras Systems Inc. - Product / Service
Cerebras Systems Inc. - Key offerings
SWOT

15.8 Fujitsu Ltd.

Fujitsu Ltd. - Overview
Fujitsu Ltd. - Business segments
Fujitsu Ltd. - Key news
Fujitsu Ltd. - Key offerings
Fujitsu Ltd. - Segment focus
SWOT

15.9 Google LLC

Google LLC - Overview
Google LLC - Product / Service
Google LLC - Key offerings
SWOT

15.10 Groq Inc.

Groq Inc. - Overview
Groq Inc. - Product / Service
Groq Inc. - Key offerings
SWOT

15.11 Huawei Technologies Co. Ltd.

Huawei Technologies Co. Ltd. - Overview
Huawei Technologies Co. Ltd. - Business segments
Huawei Technologies Co. Ltd. - Key news
Huawei Technologies Co. Ltd. - Key offerings
Huawei Technologies Co. Ltd. - Segment focus
SWOT

15.12 IBM Corp.

IBM Corp. - Overview
IBM Corp. - Business segments
IBM Corp. - Key news
IBM Corp. - Key offerings
IBM Corp. - Segment focus
SWOT

15.13 Intel Corp.

Intel Corp. - Overview
Intel Corp. - Business segments
Intel Corp. - Key news
Intel Corp. - Key offerings
Intel Corp. - Segment focus
SWOT

15.14 Microsoft Corp.

Microsoft Corp. - Overview
Microsoft Corp. - Business segments
Microsoft Corp. - Key news
Microsoft Corp. - Key offerings
Microsoft Corp. - Segment focus
SWOT

15.15 NVIDIA Corp.

NVIDIA Corp. - Overview
NVIDIA Corp. - Business segments
NVIDIA Corp. - Key news
NVIDIA Corp. - Key offerings
NVIDIA Corp. - Segment focus
SWOT

15.16 Qualcomm Inc.

Qualcomm Inc. - Overview
Qualcomm Inc. - Business segments
Qualcomm Inc. - Key news
Qualcomm Inc. - Key offerings
Qualcomm Inc. - Segment focus
SWOT

15.17 SambaNova Systems Inc.

SambaNova Systems Inc. - Overview
SambaNova Systems Inc. - Product / Service
SambaNova Systems Inc. - Key offerings
SWOT

15.18 Tenstorrent Inc.

Tenstorrent Inc. - Overview
Tenstorrent Inc. - Product / Service
Tenstorrent Inc. - Key offerings
SWOT

16. Appendix

16.1 Scope of the report

Market definition
Objectives
Notes and caveats

16.2 Inclusions and exclusions checklist

Inclusions checklist
Exclusions checklist

16.3 Currency conversion rates for US$

16.4 Research methodology

16.5 Data procurement

Information sources

16.6 Data validation

16.7 Validation techniques employed for market sizing

16.8 Data synthesis

16.9 360 degree market analysis

16.10 List of abbreviations

Research Methodology

Technavio presents a detailed picture of the market by way of study, synthesis, and summation of data from multiple sources. The analysts have presented the various facets of the market with a particular focus on identifying the key industry influencers. The data thus presented is comprehensive, reliable, and the result of extensive research, both primary and secondary.

INFORMATION SOURCES

Primary sources

  • Manufacturers and suppliers
  • Channel partners
  • Industry experts
  • Strategic decision makers

Secondary sources

  • Industry journals and periodicals
  • Government data
  • Financial reports of key industry players
  • Historical data
  • Press releases

DATA ANALYSIS

Data Synthesis

  • Collation of data
  • Estimation of key figures
  • Analysis of derived insights

Data Validation

  • Triangulation with data models
  • Reference against proprietary databases
  • Corroboration with industry experts

REPORT WRITING

Qualitative

  • Market drivers
  • Market challenges
  • Market trends
  • Five forces analysis

Quantitative

  • Market size and forecast
  • Market segmentation
  • Geographical insights
  • Competitive landscape

Interested in this report?

Get your sample now to see our research methodology and insights!

Download Now

Frequently Asked Questions

Data Center GPU market growth will increase by USD 125433.2 million during 2026-2030.

The Data Center GPU market is expected to grow at a CAGR of 15.8% during 2026-2030.

Data Center GPU market is segmented by Deployment (On-premises, Cloud) Type (Training, Inference) Technology (Generative AI, ML, NLP, Computer vision)

Advanced Micro Devices Inc., Alibaba Group Holding Ltd., Amazon Web Services Inc., Baidu Inc., Broadcom Inc., Cerebras Systems Inc., Etched, Fujitsu Ltd., Google LLC, Graphcore Ltd., Groq Inc., Huawei Technologies Co. Ltd., IBM Corp., Intel Corp., Microsoft Corp., NVIDIA Corp., Qualcomm Inc., Rivos Inc., SambaNova Systems Inc., Tenstorrent Inc. are a few of the key vendors in the Data Center GPU market.

North America will register the highest growth rate of 36.3% among the other regions. Therefore, the Data Center GPU market in North America is expected to garner significant business opportunities for the vendors during the forecast period.

US, Canada, Mexico, China, India, Japan, South Korea, Singapore, Australia, Germany, UK, France, Italy, The Netherlands, Spain, Brazil, Argentina, Chile, UAE, Saudi Arabia, South Africa, Israel, Egypt

  • Strategic expansion of AI training and trillion-parameter model development is the driving factor this market.

The Data Center GPU market vendors should focus on grabbing business opportunities from the Deployment segment as it accounted for the largest market share in the base year.