Education Hardware Market Analysis, Size, and Forecast 2024-2028: North America (Mexico), Europe (France, Germany, Italy, Spain, and UK), Middle East and Africa (UAE), APAC (Australia, China, India, Japan, and South Korea), South America (Brazil), and Rest of World (ROW)

Education Hardware Market Analysis, Size, and Forecast 2024-2028:
North America (Mexico), Europe (France, Germany, Italy, Spain, and UK), Middle East and Africa (UAE), APAC (Australia, China, India, Japan, and South Korea), South America (Brazil), and Rest of World (ROW)

Published: Dec 2023 162 Pages SKU: IRTNTR77105

Market Overview at a Glance

$40.45 B
Market Opportunity
13.45%
CAGR
12.46
YoY growth 2023-2024(%)

Education Hardware Market Size 2024-2028

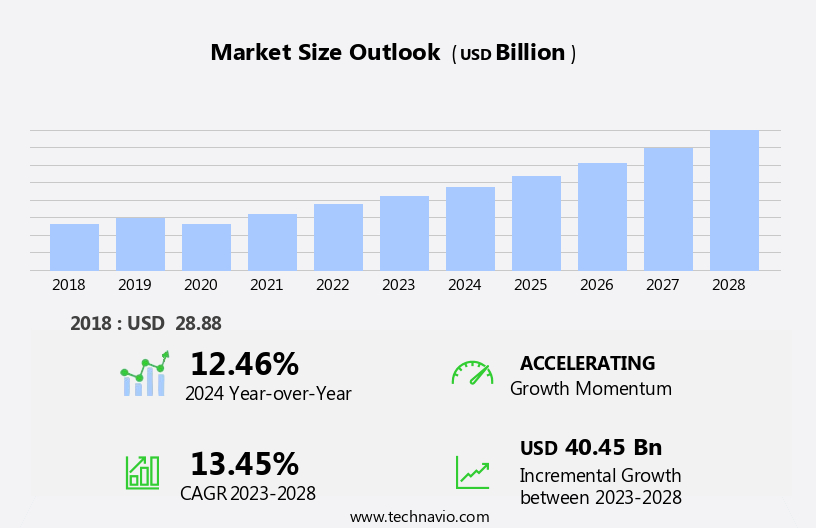
The education hardware market size is forecast to increase by USD 40.45 billion at a CAGR of 13.45% between 2023 and 2028.

  • The market is experiencing significant growth due to the increasing adoption of technology in educational institutions. Online learning platforms, digital content, and assessment tools are becoming increasingly popular, driving the demand for education hardware. This trend is particularly noticeable in the focus on Science, Technology, Engineering, and Mathematics (STEM) education, where advanced hardware is essential for delivering effective instruction. However, the high cost of education hardware remains a significant challenge for many institutions and students, limiting the widespread adoption of these technologies.
  • Despite this obstacle, companies seeking to capitalize on market opportunities in the market can focus on developing cost-effective solutions while maintaining the necessary performance and functionality to meet the demands of modern education. By addressing this challenge, these companies can help make technology-enhanced learning more accessible and affordable, expanding the market and driving growth.

What will be the Size of the Education Hardware Market during the forecast period?

Education Hardware Market Size

 Request Free Sample

  • The market continues to evolve, driven by advancements in technology and the shifting educational landscape. Digital resources, such as educational platforms, laptops, and interactive whiteboards, are increasingly integrated into curriculum development and educational institutions. Online learning and artificial intelligence are transforming higher education, enabling personalized learning experiences and enhancing student engagement. Communication tools and data privacy are crucial considerations in this digital age, ensuring secure and effective collaboration. Moreover, Education technology adoption extends to early childhood education, where digital literacy and interactive content are essential for fostering a strong foundation. K-12 education embraces digital textbooks, virtual labs, and assessment tools to enhance learning outcomes.
  • Secondary education and STEM education leverage technology for augmented reality tools and adaptive learning, while professional development opportunities equip teachers with the necessary skills to effectively integrate technology into their classrooms. Network connectivity, cloud computing, and wireless networks are essential infrastructure components, enabling seamless access to digital content and online assessments. Tablets and laptops offer versatility and portability, while interactive whiteboards and digital signage facilitate engaging and collaborative learning environments. E-learning platforms and educational apps cater to diverse learning styles and preferences, while machine learning and adaptive learning technologies enable customized instruction. The market is a dynamic and evolving space, with ongoing innovations shaping the future of education.
  • From primary to higher education, technology integration continues to redefine learning experiences, fostering digital citizenship and preparing students for the digital world.

How is this Education Hardware Industry segmented?

The education hardware industry research report provides comprehensive data (region-wise segment analysis), with forecasts and estimates in "USD billion" for the period 2024-2028, as well as historical data from 2018-2022 for the following segments.

  • Application
    • K-12 education
    • Higher education
  • Type
    • PCs
    • Interactive displays
    • Classroom wearables
    • VR/AR Device
  • Deployment Type
    • On-Premises
    • Cloud-Integrated
  • Service Mode
    • Classroom Learning
    • Remote Learning
    • STEM Education
    • Professional Development
  • Geography
    • North America
      • US
      • Mexico
    • Europe
      • France
      • Germany
      • Italy
      • Spain
      • UK
    • Middle East and Africa
      • UAE
    • APAC
      • Australia
      • China
      • India
      • Japan
      • South Korea
    • South America
      • Brazil
    • Rest of World (ROW)

By Application Insights

The k-12 education segment is estimated to witness significant growth during the forecast period.

The market is witnessing significant growth, particularly in the K-12 education segment. This sector's focus on interactive and technology-driven learning tools is propelling the demand for education hardware. Interactive displays and smart boards are leading the charge, enabling teachers to deliver engaging lessons through multimedia content and interactive activities. These technologies, including interactive whiteboards, are transforming classrooms by fostering collaboration and student engagement. Cloud computing, wireless networks, and digital textbooks are also essential components of the education hardware landscape, offering flexibility and convenience. Furthermore, artificial intelligence, machine learning, and adaptive learning are revolutionizing personalized education, while data privacy and security remain critical concerns.

Virtual reality headsets and educational games are also gaining popularity, adding a new dimension to learning experiences. Educational institutions are increasingly integrating technology into their curriculum development and teacher training programs, with e-learning platforms, communication tools, and student response systems becoming essential components. The higher education sector is also embracing technology, with laptops and tablets becoming standard tools for learning. The market is a dynamic and evolving space, with learning analytics, digital content, and online assessments playing crucial roles in enhancing learning outcomes.

Education Hardware Market Size

Request Free Sample

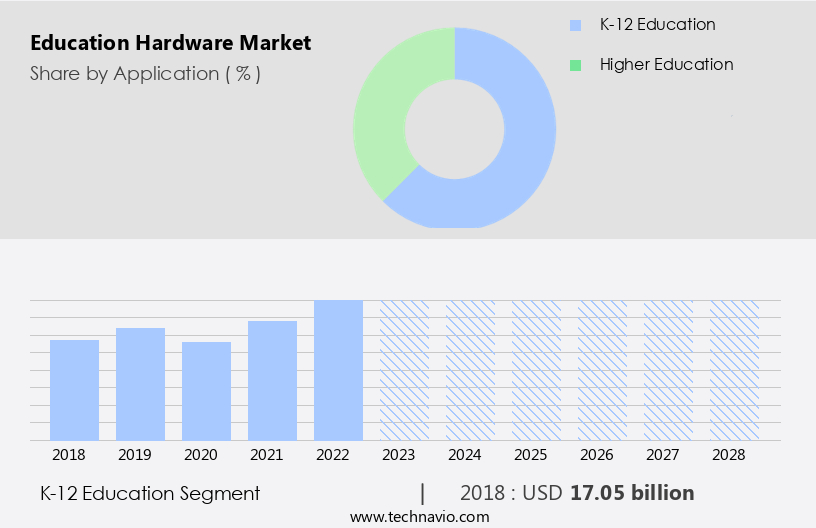
The K-12 education segment was valued at USD 17.05 billion in 2018 and showed a gradual increase during the forecast period.
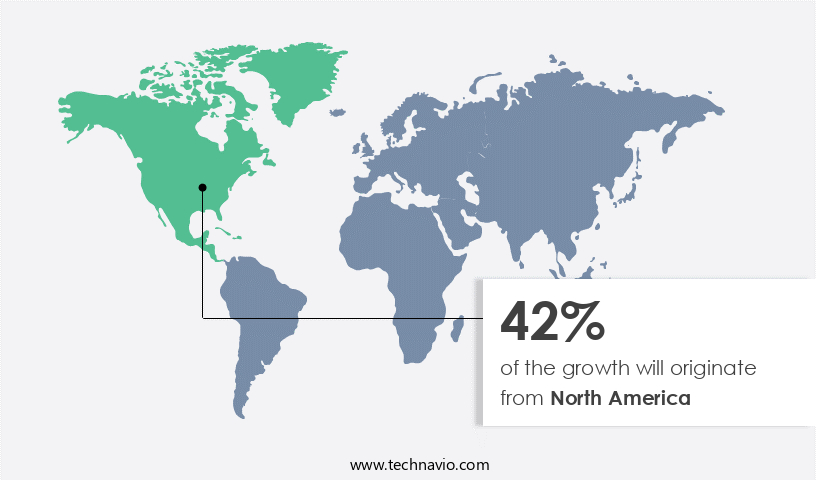
Regional Analysis

North America is estimated to contribute 42% to the growth of the global market during the forecast period.Technavio's analysts have elaborately explained the regional trends and drivers that shape the market during the forecast period.

Education Hardware Market Share by Geography

 Request Free Sample

In the dynamic realm of educational technology, big data is increasingly shaping learning experiences by providing valuable insights for curriculum development and personalized instruction. Network connectivity, a fundamental requirement for data exchange, is becoming ubiquitous in educational institutions, enabling real-time collaboration and online learning. Early childhood education is embracing digital textbooks and interactive content, while virtual labs offer hands-on experiences for students in STEM fields. Assessment tools and student response systems facilitate ongoing evaluation, enhancing learning outcomes. Teacher training programs are adopting technology, integrating artificial intelligence and machine learning for adaptive learning and professional development. Cloud computing and wireless networks ensure access to educational resources, enabling blended learning and online assessments.

Digital literacy and digital citizenship are essential skills for students, fostering collaboration through communication tools and educational apps. Virtual reality headsets and augmented reality tools offer immersive learning experiences, while educational software caters to K-12 and higher education. Learning management systems facilitate curriculum development and student engagement, while data privacy remains a crucial concern. Online learning platforms and e-learning apps cater to diverse learning styles, offering interactive content and personalized learning experiences. School districts and educational institutions are investing in technology integration, from laptops and tablets for education to interactive whiteboards and digital signage. Classroom technology, including student engagement tools and communication systems, fosters a harmonious learning environment. Technology adoption continues to emphasize the importance of learning analytics, enabling educators to optimize instruction and improve student performance.

Market Dynamics

Our researchers analyzed the data with 2023 as the base year, along with the key drivers, trends, and challenges. A holistic analysis of drivers will help companies refine their marketing strategies to gain a competitive advantage.

The market is evolving rapidly, fueled by demand for interactive whiteboards for classrooms and educational laptops for remote learning. As hybrid models expand, education hardware for hybrid learning and durable laptops for student use are becoming essential. Schools are adopting smart projectors for schools, classroom tablets for e-learning, and VR headsets for education to enrich student engagement. Key education hardware market trends include 3D printers for STEM education, AR devices for educational training, and AI-integrated classroom technology. Institutions are investing in cloud-connected classroom projectors, IoT-enabled classroom devices, and secure education hardware solutions. From portable devices for mobile learning to eco-friendly education hardware, the market supports digital transformation across K-12 and universities, with a focus on affordable tablets for schools and smartboards for interactive teaching.

What are the key market drivers leading to the rise in the adoption of Education Hardware Industry?

  • The increasing implementation of online learning platforms, digital content, and assessment tools within educational institutions is the primary market driver. 
  • The global education market has experienced notable growth in the implementation of digital tools and technologies, particularly in the realm of stem education and k-12 institutions. This shift is driven by the demand for more immersive, harmonious, and adaptive learning experiences. Educational software, such as machine learning and adaptive learning platforms, are increasingly utilized to cater to individual students' needs. Interactive content, educational apps, collaboration tools, and learning management systems are becoming integral components of modern educational practices. Schools and districts are investing in these solutions to provide students with a blended learning experience, combining traditional classroom instruction with digital resources.
  • This digital transformation is essential for enhancing the learning experience, making education more accessible, and preparing students for the future workforce.

What are the market trends shaping the Education Hardware Industry?

  • The growing emphasis on STEM  reflects a significant market trend. As a professional, it is essential to keep abreast of this development and adapt accordingly.
  • The market is experiencing significant growth due to the increasing prioritization of STEM (Science, Technology, Engineering, and Mathematics) education. This shift in focus is driven by the recognition of the importance of STEM fields in preparing students for future careers. One of the key areas of innovation in this space is the development of educational toys that promote STEM learning. These toys, which include coding and robotics kits, are in high demand as parents and educators seek to develop computational thinking and problem-solving abilities in students. Another significant trend in the market is the integration of technology into the classroom.
  • This includes the use of digital textbooks, virtual labs, assessment tools, and wireless networks. Cloud computing and tablet devices are also becoming increasingly popular, enabling access to vast amounts of educational resources and facilitating remote learning. Moreover, technology is also being used to enhance teacher training and professional development. Learning analytics and digital citizenship are key areas of focus, with virtual reality headsets and other immersive technologies being explored to create harmonious and engaging learning experiences. Overall, the market is undergoing a transformation, with a strong emphasis on innovation and the use of technology to enhance the learning experience.

What challenges does the Education Hardware Industry face during its growth?

  • The escalating costs of educational hardware pose a significant challenge to the industry's growth trajectory. The market faces a substantial challenge due to the high cost of acquiring and maintaining necessary technology solutions for educational institutions and students. This financial barrier restricts accessibility and equity in the adoption of essential education hardware, including laptops for various educational levels and purposes, interactive whiteboards, and educational games. For instance, the cost of a general-purpose computer for education may range from USD500 to USD1,000, while specialized hardware, such as graphic design computers, can cost upwards of USD2,000. Peripherals like monitors, printers, and software further increase the overall expense. Moreover, the integration of advanced technologies like artificial intelligence, online learning platforms, and e-learning tools in education has become increasingly important for curriculum development and digital literacy.
  • Communication tools and data privacy concerns are also essential considerations for educational institutions. Despite these challenges, the market for education hardware continues to evolve, with advancements in technology driving immersive and harmonious learning experiences. Online learning platforms and educational games offer engaging and interactive alternatives to traditional classroom settings. As educational institutions and students navigate the complexities of the market, understanding the costs and benefits of various technology solutions will be crucial for making informed decisions.

Exclusive Customer Landscape

The education hardware market forecasting report includes the adoption lifecycle of the market, covering from the innovator's stage to the laggard's stage. It focuses on adoption rates in different regions based on penetration. Furthermore, the education hardware market report also includes key purchase criteria and drivers of price sensitivity to help companies evaluate and develop their market growth analysis strategies.
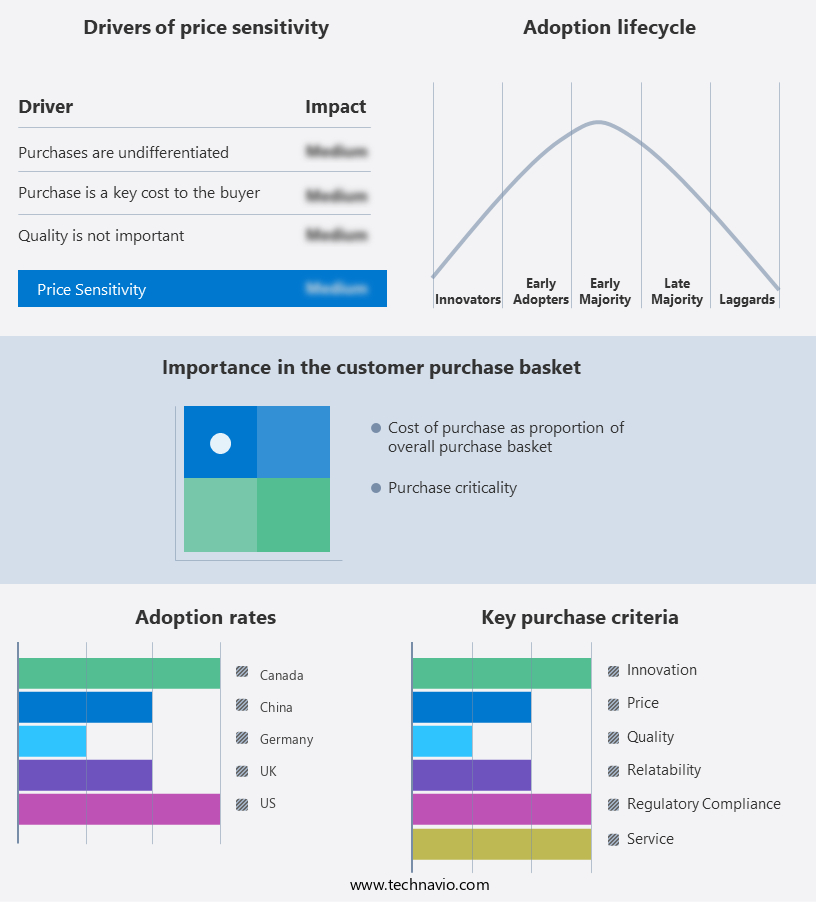
Education Hardware Market Share by Geography

 Customer Landscape

Key Companies & Market Insights

Companies are implementing various strategies, such as strategic alliances, education hardware market forecast, partnerships, mergers and acquisitions, geographical expansion, and product/service launches, to enhance their presence in the industry.

Acer - This company specializes in providing top-tier education hardware solutions. Among the offerings are the Acer Chromebook Spin 713 (model CP713 3W), Dell Latitude 7410 Chromebook Enterprise, and HP Elite Dragonfly 13.5 Chromebook. Each device is meticulously selected to ensure optimal performance and reliability in an educational setting.

The industry research and growth report includes detailed analyses of the competitive landscape of the market and information about key companies, including:

  • Acer
  • Apple
  • Asus
  • BenQ
  • Boxlight
  • Cisco Systems
  • Dell Technologies
  • Epson
  • Hitachi
  • HP Inc.
  • Lenovo
  • Microsoft
  • NEC Corporation
  • Panasonic
  • Promethean
  • Samsung Electronics
  • SMART Technologies
  • Sony
  • ViewSonic
  • Vivitek

Qualitative and quantitative analysis of companies has been conducted to help clients understand the wider business environment as well as the strengths and weaknesses of key industry players. Data is qualitatively analyzed to categorize companies as pure play, category-focused, industry-focused, and diversified; it is quantitatively analyzed to categorize companies as dominant, leading, strong, tentative, and weak.

Recent Development and News in Education Hardware Market

  • In January 2024, Microsoft Corporation announced the global availability of its new Surface Hub 2S interactive whiteboard, designed for modern classroom settings. This innovative hardware solution, featuring a 50.5-inch 4K+ touchscreen and improved pen technology, aims to enhance collaborative learning experiences (Microsoft Press Release, 2024).
  • In March 2025, Apple Inc. And Google joined forces to invest in a multi-year partnership with Clemson University to create a state-of-the-art facility for research and development in education technology. This collaboration will focus on integrating advanced hardware and software solutions to improve access to technology-driven education (Apple Newsroom, 2025).
  • In May 2024, Lenovo Group Ltd. Acquired MoboSystems, a leading provider of educational software and hardware solutions. This strategic acquisition will allow Lenovo to expand its product offerings and strengthen its position in the education market (Lenovo Press Release, 2024).

Research Analyst Overview

The market is experiencing significant shifts as technology integration becomes increasingly essential for student-centered learning. Tech support plays a crucial role in ensuring seamless implementation of mobile learning, online tutoring, and virtual classrooms. Differentiated instruction and personalized learning pathways are driving demand for IT infrastructure capable of handling data analytics and personalized learning recommendations. Green technology is gaining traction, with cloud-based solutions and live streaming enabling inclusive learning and reducing carbon footprints. Hybrid learning models combine the benefits of in-person and remote instruction, while project-based learning and video conferencing foster collaborative learning experiences.

Digital assessments and predictive analytics offer valuable insights, enhancing the effectiveness of instruction and addressing the digital divide. Open educational resources and digital literacy training ensure equitable access to quality education. The market's focus on inclusive learning and return on investment underscores the importance of investing in robust IT infrastructure and innovative solutions.

Dive into Technavio's robust research methodology, blending expert interviews, extensive data synthesis, and validated models for unparalleled Education Hardware Market insights. See full methodology.

Market Scope

Report Coverage

Details

Page number

162

Base year

2023

Historic period

2018-2022

Forecast period

2024-2028

Growth momentum & CAGR

Accelerate at a CAGR of 13.45%

Market growth 2024-2028

USD 40.45 billion

Market structure

Fragmented

YoY growth 2023-2024(%)

12.46

Key countries

US, China, Germany, Japan, UK, Australia, India, France, Brazil, UAE, Rest of World (ROW), Saudi Arabia, France, South Korea, Mexico, Italy, and Spain

Competitive landscape

Leading Companies, Market Positioning of Companies, Competitive Strategies, and Industry Risks

Request Free Sample

What are the Key Data Covered in this Education Hardware Market Research and Growth Report?

  • CAGR of the Education Hardware industry during the forecast period
  • Detailed information on factors that will drive the growth and forecasting between 2024 and 2028
  • Precise estimation of the size of the market and its contribution of the industry in focus to the parent market
  • Accurate predictions about upcoming growth and trends and changes in consumer behaviour
  • Growth of the market across North America, Europe, APAC, South America, and Middle East and Africa
  • Thorough analysis of the market's competitive landscape and detailed information about companies
  • Comprehensive analysis of factors that will challenge the education hardware market growth of industry companies

We can help! Our analysts can customize this education hardware market research report to meet your requirements.

Get in touch

1 Executive Summary

  • 1.1 Market overview
    • Exhibit 01: Executive Summary – Chart on Market Overview
    • Exhibit 02: Executive Summary – Data Table on Market Overview
    • Exhibit 03: Executive Summary – Chart on Global Market Characteristics
    • Exhibit 04: Executive Summary – Chart on Market by Geography
    • Exhibit 05: Executive Summary – Chart on Market Segmentation by Application
    • Exhibit 06: Executive Summary – Chart on Market Segmentation by Type
    • Exhibit 07: Executive Summary – Chart on Incremental Growth
    • Exhibit 08: Executive Summary – Data Table on Incremental Growth
    • Exhibit 09: Executive Summary – Chart on Vendor Market Positioning

2 Market Landscape

  • 2.1 Market ecosystem
    • Exhibit 10: Parent market
    • Exhibit 11: Market Characteristics

3 Market Sizing

  • 3.1 Market definition
    • Exhibit 12: Offerings of vendors included in the market definition
  • 3.2 Market segment analysis
    • Exhibit 13: Market segments
  • 3.3 Market size 2023
    • 3.4 Market outlook: Forecast for 2023-2028
      • Exhibit 14: Chart on Global - Market size and forecast 2023-2028 ($ million)
      • Exhibit 15: Data Table on Global - Market size and forecast 2023-2028 ($ million)
      • Exhibit 16: Chart on Global Market: Year-over-year growth 2023-2028 (%)
      • Exhibit 17: Data Table on Global Market: Year-over-year growth 2023-2028 (%)

    4 Historic Market Size

    • 4.1 Global education hardware market 2018 - 2022
      • Exhibit 18: Historic Market Size – Data Table on global education hardware market 2018 - 2022 ($ million)
    • 4.2 Application Segment Analysis 2018 - 2022
      • Exhibit 19: Historic Market Size – Application Segment 2018 - 2022 ($ million)
    • 4.3 Type Segment Analysis 2018 - 2022
      • Exhibit 20: Historic Market Size – Type Segment 2018 - 2022 ($ million)
    • 4.4 Geography Segment Analysis 2018 - 2022
      • Exhibit 21: Historic Market Size – Geography Segment 2018 - 2022 ($ million)
    • 4.5 Country Segment Analysis 2018 - 2022
      • Exhibit 22: Historic Market Size – Country Segment 2018 - 2022 ($ million)

    5 Five Forces Analysis

    • 5.1 Five forces summary
      • Exhibit 23: Five forces analysis - Comparison between 2023 and 2028
    • 5.2 Bargaining power of buyers
      • Exhibit 24: Chart on Bargaining power of buyers – Impact of key factors 2023 and 2028
    • 5.3 Bargaining power of suppliers
      • Exhibit 25: Bargaining power of suppliers – Impact of key factors in 2023 and 2028
    • 5.4 Threat of new entrants
      • Exhibit 26: Threat of new entrants – Impact of key factors in 2023 and 2028
    • 5.5 Threat of substitutes
      • Exhibit 27: Threat of substitutes – Impact of key factors in 2023 and 2028
    • 5.6 Threat of rivalry
      • Exhibit 28: Threat of rivalry – Impact of key factors in 2023 and 2028
    • 5.7 Market condition
      • Exhibit 29: Chart on Market condition - Five forces 2023 and 2028

    6 Market Segmentation by Application

    • 6.1 Market segments
      • Chart on Application - Market share (2023-2028) (%)
      • Data Table on Application - Market share (2023-2028) (%)
    • 6.2 Comparison by Application
      • Chart on Comparison by Application
      • Data Table on Comparison by Application
    • 6.3 K-12 education - Market size and forecast (2023-2028)
      • Chart on K-12 education - Market size and forecast (2023-2028) ($ million)
      • Data Table on K-12 education - Market size and forecast (2023-2028) ($ million)
      • Chart on K-12 education - Year-over-year growth (2023-2028) (%)
      • Data Table on K-12 education - Year-over-year growth (2023-2028) (%)
    • 6.4 Higher education - Market size and forecast (2023-2028)
      • Chart on Higher education - Market size and forecast (2023-2028) ($ million)
      • Data Table on Higher education - Market size and forecast (2023-2028) ($ million)
      • Chart on Higher education - Year-over-year growth (2023-2028) (%)
      • Data Table on Higher education - Year-over-year growth (2023-2028) (%)
    • 6.5 Market opportunity by Application
      • Market opportunity by Application ($ million)
      • Data Table on Market opportunity by Application ($ million)

    7 Market Segmentation by Type

    • 7.1 Market segments
      • Chart on Type - Market share (2023-2028) (%)
      • Data Table on Type - Market share (2023-2028) (%)
    • 7.2 Comparison by Type
      • Chart on Comparison by Type
      • Data Table on Comparison by Type
    • 7.3 PCs - Market size and forecast (2023-2028)
      • Chart on PCs - Market size and forecast (2023-2028) ($ million)
      • Data Table on PCs - Market size and forecast (2023-2028) ($ million)
      • Chart on PCs - Year-over-year growth (2023-2028) (%)
      • Data Table on PCs - Year-over-year growth (2023-2028) (%)
    • 7.4 Interactive displays - Market size and forecast (2023-2028)
      • Chart on Interactive displays - Market size and forecast (2023-2028) ($ million)
      • Data Table on Interactive displays - Market size and forecast (2023-2028) ($ million)
      • Chart on Interactive displays - Year-over-year growth (2023-2028) (%)
      • Data Table on Interactive displays - Year-over-year growth (2023-2028) (%)
    • 7.5 Classroom wearables - Market size and forecast (2023-2028)
      • Chart on Classroom wearables - Market size and forecast (2023-2028) ($ million)
      • Data Table on Classroom wearables - Market size and forecast (2023-2028) ($ million)
      • Chart on Classroom wearables - Year-over-year growth (2023-2028) (%)
      • Data Table on Classroom wearables - Year-over-year growth (2023-2028) (%)
    • 7.6 VR/AR Device - Market size and forecast (2023-2028)
      • Chart on VR/AR Device - Market size and forecast (2023-2028) ($ million)
      • Data Table on VR/AR Device - Market size and forecast (2023-2028) ($ million)
      • Chart on VR/AR Device - Year-over-year growth (2023-2028) (%)
      • Data Table on VR/AR Device - Year-over-year growth (2023-2028) (%)
    • 7.7 Market opportunity by Type
      • Market opportunity by Type ($ million)
      • Data Table on Market opportunity by Type ($ million)

    8 Market Segmentation by Deployment Type

    • 8.1 Market segments
      • Chart on Deployment Type - Market share (2023-2028) (%)
      • Data Table on Deployment Type - Market share (2023-2028) (%)
    • 8.2 Comparison by Deployment Type
      • Chart on Comparison by Deployment Type
      • Data Table on Comparison by Deployment Type
    • 8.3 On-Premises - Market size and forecast (2023-2028)
      • Chart on On-Premises - Market size and forecast (2023-2028) ($ million)
      • Data Table on On-Premises - Market size and forecast (2023-2028) ($ million)
      • Chart on On-Premises - Year-over-year growth (2023-2028) (%)
      • Data Table on On-Premises - Year-over-year growth (2023-2028) (%)
    • 8.4 Cloud-Integrated - Market size and forecast (2023-2028)
      • Chart on Cloud-Integrated - Market size and forecast (2023-2028) ($ million)
      • Data Table on Cloud-Integrated - Market size and forecast (2023-2028) ($ million)
      • Chart on Cloud-Integrated - Year-over-year growth (2023-2028) (%)
      • Data Table on Cloud-Integrated - Year-over-year growth (2023-2028) (%)
    • 8.5 Market opportunity by Deployment Type
      • Market opportunity by Deployment Type ($ million)
      • Data Table on Market opportunity by Deployment Type ($ million)

    9 Market Segmentation by Service Mode

    • 9.1 Market segments
      • Chart on Service Mode - Market share (2023-2028) (%)
      • Data Table on Service Mode - Market share (2023-2028) (%)
    • 9.2 Comparison by Service Mode
      • Chart on Comparison by Service Mode
      • Data Table on Comparison by Service Mode
    • 9.3 Classroom Learning - Market size and forecast (2023-2028)
      • Chart on Classroom Learning - Market size and forecast (2023-2028) ($ million)
      • Data Table on Classroom Learning - Market size and forecast (2023-2028) ($ million)
      • Chart on Classroom Learning - Year-over-year growth (2023-2028) (%)
      • Data Table on Classroom Learning - Year-over-year growth (2023-2028) (%)
    • 9.4 Remote Learning - Market size and forecast (2023-2028)
      • Chart on Remote Learning - Market size and forecast (2023-2028) ($ million)
      • Data Table on Remote Learning - Market size and forecast (2023-2028) ($ million)
      • Chart on Remote Learning - Year-over-year growth (2023-2028) (%)
      • Data Table on Remote Learning - Year-over-year growth (2023-2028) (%)
    • 9.5 STEM Education - Market size and forecast (2023-2028)
      • Chart on STEM Education - Market size and forecast (2023-2028) ($ million)
      • Data Table on STEM Education - Market size and forecast (2023-2028) ($ million)
      • Chart on STEM Education - Year-over-year growth (2023-2028) (%)
      • Data Table on STEM Education - Year-over-year growth (2023-2028) (%)
    • 9.6 Professional Development - Market size and forecast (2023-2028)
      • Chart on Professional Development - Market size and forecast (2023-2028) ($ million)
      • Data Table on Professional Development - Market size and forecast (2023-2028) ($ million)
      • Chart on Professional Development - Year-over-year growth (2023-2028) (%)
      • Data Table on Professional Development - Year-over-year growth (2023-2028) (%)
    • 9.7 Market opportunity by Service Mode
      • Market opportunity by Service Mode ($ million)
      • Data Table on Market opportunity by Service Mode ($ million)

    8 Customer Landscape

    • 8.1 Customer landscape overview
      • Exhibit 62: Analysis of price sensitivity, lifecycle, customer purchase basket, adoption rates, and purchase criteria

    9 Geographic Landscape

    • 9.1 Geographic segmentation
      • Exhibit 63: Chart on Market share by geography 2023-2028 (%)
      • Exhibit 64: Data Table on Market share by geography 2023-2028 (%)
    • 9.2 Geographic comparison
      • Exhibit 65: Chart on Geographic comparison
      • Exhibit 66: Data Table on Geographic comparison
    • 9.3 North America - Market size and forecast 2023-2028
      • Exhibit 67: Chart on North America - Market size and forecast 2023-2028 ($ million)
      • Exhibit 68: Data Table on North America - Market size and forecast 2023-2028 ($ million)
      • Exhibit 69: Chart on North America - Year-over-year growth 2023-2028 (%)
      • Exhibit 70: Data Table on North America - Year-over-year growth 2023-2028 (%)
    • 9.4 Europe - Market size and forecast 2023-2028
      • Exhibit 71: Chart on Europe - Market size and forecast 2023-2028 ($ million)
      • Exhibit 72: Data Table on Europe - Market size and forecast 2023-2028 ($ million)
      • Exhibit 73: Chart on Europe - Year-over-year growth 2023-2028 (%)
      • Exhibit 74: Data Table on Europe - Year-over-year growth 2023-2028 (%)
    • 9.5 APAC - Market size and forecast 2023-2028
      • Exhibit 75: Chart on APAC - Market size and forecast 2023-2028 ($ million)
      • Exhibit 76: Data Table on APAC - Market size and forecast 2023-2028 ($ million)
      • Exhibit 77: Chart on APAC - Year-over-year growth 2023-2028 (%)
      • Exhibit 78: Data Table on APAC - Year-over-year growth 2023-2028 (%)
    • 9.6 South America - Market size and forecast 2023-2028
      • Exhibit 79: Chart on South America - Market size and forecast 2023-2028 ($ million)
      • Exhibit 80: Data Table on South America - Market size and forecast 2023-2028 ($ million)
      • Exhibit 81: Chart on South America - Year-over-year growth 2023-2028 (%)
      • Exhibit 82: Data Table on South America - Year-over-year growth 2023-2028 (%)
    • 9.7 Middle East and Africa - Market size and forecast 2023-2028
      • Exhibit 83: Chart on Middle East and Africa - Market size and forecast 2023-2028 ($ million)
      • Exhibit 84: Data Table on Middle East and Africa - Market size and forecast 2023-2028 ($ million)
      • Exhibit 85: Chart on Middle East and Africa - Year-over-year growth 2023-2028 (%)
      • Exhibit 86: Data Table on Middle East and Africa - Year-over-year growth 2023-2028 (%)
    • 9.8 US - Market size and forecast 2023-2028
      • Exhibit 87: Chart on US - Market size and forecast 2023-2028 ($ million)
      • Exhibit 88: Data Table on US - Market size and forecast 2023-2028 ($ million)
      • Exhibit 89: Chart on US - Year-over-year growth 2023-2028 (%)
      • Exhibit 90: Data Table on US - Year-over-year growth 2023-2028 (%)
    • 9.9 China - Market size and forecast 2023-2028
      • Exhibit 91: Chart on China - Market size and forecast 2023-2028 ($ million)
      • Exhibit 92: Data Table on China - Market size and forecast 2023-2028 ($ million)
      • Exhibit 93: Chart on China - Year-over-year growth 2023-2028 (%)
      • Exhibit 94: Data Table on China - Year-over-year growth 2023-2028 (%)
    • 9.10 Germany - Market size and forecast 2023-2028
      • Exhibit 95: Chart on Germany - Market size and forecast 2023-2028 ($ million)
      • Exhibit 96: Data Table on Germany - Market size and forecast 2023-2028 ($ million)
      • Exhibit 97: Chart on Germany - Year-over-year growth 2023-2028 (%)
      • Exhibit 98: Data Table on Germany - Year-over-year growth 2023-2028 (%)
    • 9.11 Canada - Market size and forecast 2023-2028
      • Exhibit 99: Chart on Canada - Market size and forecast 2023-2028 ($ million)
      • Exhibit 100: Data Table on Canada - Market size and forecast 2023-2028 ($ million)
      • Exhibit 101: Chart on Canada - Year-over-year growth 2023-2028 (%)
      • Exhibit 102: Data Table on Canada - Year-over-year growth 2023-2028 (%)
    • 9.12 UK - Market size and forecast 2023-2028
      • Exhibit 103: Chart on UK - Market size and forecast 2023-2028 ($ million)
      • Exhibit 104: Data Table on UK - Market size and forecast 2023-2028 ($ million)
      • Exhibit 105: Chart on UK - Year-over-year growth 2023-2028 (%)
      • Exhibit 106: Data Table on UK - Year-over-year growth 2023-2028 (%)
    • 9.13 Market opportunity by geography
      • Exhibit 107: Market opportunity by geography ($ million)
      • Exhibit 108: Data Tables on Market opportunity by geography ($ million)
    • 11.14 US - Market size and forecast (2023-2028)
      • Chart on US - Market size and forecast (2023-2028) ($ million)
      • Data Table on US - Market size and forecast (2023-2028) ($ million)
      • Chart on US - Year-over-year growth (2023-2028) (%)
      • Data Table on US - Year-over-year growth (2023-2028) (%)
    • 11.15 Japan - Market size and forecast (2023-2028)
      • Chart on Japan - Market size and forecast (2023-2028) ($ million)
      • Data Table on Japan - Market size and forecast (2023-2028) ($ million)
      • Chart on Japan - Year-over-year growth (2023-2028) (%)
      • Data Table on Japan - Year-over-year growth (2023-2028) (%)
    • 11.16 Australia - Market size and forecast (2023-2028)
      • Chart on Australia - Market size and forecast (2023-2028) ($ million)
      • Data Table on Australia - Market size and forecast (2023-2028) ($ million)
      • Chart on Australia - Year-over-year growth (2023-2028) (%)
      • Data Table on Australia - Year-over-year growth (2023-2028) (%)
    • 11.17 India - Market size and forecast (2023-2028)
      • Chart on India - Market size and forecast (2023-2028) ($ million)
      • Data Table on India - Market size and forecast (2023-2028) ($ million)
      • Chart on India - Year-over-year growth (2023-2028) (%)
      • Data Table on India - Year-over-year growth (2023-2028) (%)
    • 11.18 France - Market size and forecast (2023-2028)
      • Chart on France - Market size and forecast (2023-2028) ($ million)
      • Data Table on France - Market size and forecast (2023-2028) ($ million)
      • Chart on France - Year-over-year growth (2023-2028) (%)
      • Data Table on France - Year-over-year growth (2023-2028) (%)
    • 11.19 Brazil - Market size and forecast (2023-2028)
      • Chart on Brazil - Market size and forecast (2023-2028) ($ million)
      • Data Table on Brazil - Market size and forecast (2023-2028) ($ million)
      • Chart on Brazil - Year-over-year growth (2023-2028) (%)
      • Data Table on Brazil - Year-over-year growth (2023-2028) (%)
    • 11.20 UAE - Market size and forecast (2023-2028)
      • Chart on UAE - Market size and forecast (2023-2028) ($ million)
      • Data Table on UAE - Market size and forecast (2023-2028) ($ million)
      • Chart on UAE - Year-over-year growth (2023-2028) (%)
      • Data Table on UAE - Year-over-year growth (2023-2028) (%)
    • 11.21 Rest of World (ROW) - Market size and forecast (2023-2028)
      • Chart on Rest of World (ROW) - Market size and forecast (2023-2028) ($ million)
      • Data Table on Rest of World (ROW) - Market size and forecast (2023-2028) ($ million)
      • Chart on Rest of World (ROW) - Year-over-year growth (2023-2028) (%)
      • Data Table on Rest of World (ROW) - Year-over-year growth (2023-2028) (%)
    • 11.22 Saudi Arabia - Market size and forecast (2023-2028)
      • Chart on Saudi Arabia - Market size and forecast (2023-2028) ($ million)
      • Data Table on Saudi Arabia - Market size and forecast (2023-2028) ($ million)
      • Chart on Saudi Arabia - Year-over-year growth (2023-2028) (%)
      • Data Table on Saudi Arabia - Year-over-year growth (2023-2028) (%)
    • 11.23 South Korea - Market size and forecast (2023-2028)
      • Chart on South Korea - Market size and forecast (2023-2028) ($ million)
      • Data Table on South Korea - Market size and forecast (2023-2028) ($ million)
      • Chart on South Korea - Year-over-year growth (2023-2028) (%)
      • Data Table on South Korea - Year-over-year growth (2023-2028) (%)
    • 11.24 Mexico - Market size and forecast (2023-2028)
      • Chart on Mexico - Market size and forecast (2023-2028) ($ million)
      • Data Table on Mexico - Market size and forecast (2023-2028) ($ million)
      • Chart on Mexico - Year-over-year growth (2023-2028) (%)
      • Data Table on Mexico - Year-over-year growth (2023-2028) (%)
    • 11.25 Italy - Market size and forecast (2023-2028)
      • Chart on Italy - Market size and forecast (2023-2028) ($ million)
      • Data Table on Italy - Market size and forecast (2023-2028) ($ million)
      • Chart on Italy - Year-over-year growth (2023-2028) (%)
      • Data Table on Italy - Year-over-year growth (2023-2028) (%)
    • 11.26 Spain - Market size and forecast (2023-2028)
      • Chart on Spain - Market size and forecast (2023-2028) ($ million)
      • Data Table on Spain - Market size and forecast (2023-2028) ($ million)
      • Chart on Spain - Year-over-year growth (2023-2028) (%)
      • Data Table on Spain - Year-over-year growth (2023-2028) (%)

    10 Drivers, Challenges, and Trends

    • 10.1 Market drivers
      • 10.2 Market challenges
        • 10.3 Impact of drivers and challenges
          • Exhibit 109: Impact of drivers and challenges in 2023 and 2028
        • 10.4 Market trends

          11 Vendor Landscape

          • 11.1 Overview
            • 11.2 Vendor landscape
              • Exhibit 110: Overview on Criticality of inputs and Factors of differentiation
            • 11.3 Landscape disruption
              • Exhibit 111: Overview on factors of disruption
            • 11.4 Industry risks
              • Exhibit 112: Impact of key risks on business

            14 Competitive Analysis

            • 14.1 Companies profiled
              • Companies covered
            • 14.2 Market positioning of companies
              • Matrix on companies position and classification
            • 14.3 Acer
              • Acer - Overview
              • Acer - Product / Service
              • Acer - Key offerings
            • 14.4 Apple
              • Apple - Overview
              • Apple - Product / Service
              • Apple - Key offerings
            • 14.5 Asus
              • Asus - Overview
              • Asus - Product / Service
              • Asus - Key offerings
            • 14.6 BenQ
              • BenQ - Overview
              • BenQ - Product / Service
              • BenQ - Key offerings
            • 14.7 Boxlight
              • Boxlight - Overview
              • Boxlight - Product / Service
              • Boxlight - Key offerings
            • 14.8 Cisco Systems
              • Cisco Systems - Overview
              • Cisco Systems - Product / Service
              • Cisco Systems - Key offerings
            • 14.9 Dell Technologies
              • Dell Technologies - Overview
              • Dell Technologies - Product / Service
              • Dell Technologies - Key offerings
            • 14.10 Epson
              • Epson - Overview
              • Epson - Product / Service
              • Epson - Key offerings
            • 14.11 Hitachi
              • Hitachi - Overview
              • Hitachi - Product / Service
              • Hitachi - Key offerings
            • 14.12 HP Inc.
              • HP Inc. - Overview
              • HP Inc. - Product / Service
              • HP Inc. - Key offerings
            • 14.13 Lenovo
              • Lenovo - Overview
              • Lenovo - Product / Service
              • Lenovo - Key offerings
            • 14.14 Microsoft
              • Microsoft - Overview
              • Microsoft - Product / Service
              • Microsoft - Key offerings
            • 14.15 NEC Corporation
              • NEC Corporation - Overview
              • NEC Corporation - Product / Service
              • NEC Corporation - Key offerings
            • 14.16 Panasonic
              • Panasonic - Overview
              • Panasonic - Product / Service
              • Panasonic - Key offerings
            • 14.17 Promethean
              • Promethean - Overview
              • Promethean - Product / Service
              • Promethean - Key offerings
            • 14.18 Samsung Electronics
              • Samsung Electronics - Overview
              • Samsung Electronics - Product / Service
              • Samsung Electronics - Key offerings
            • 14.19 SMART Technologies
              • SMART Technologies - Overview
              • SMART Technologies - Product / Service
              • SMART Technologies - Key offerings
            • 14.20 Sony
              • Sony - Overview
              • Sony - Product / Service
              • Sony - Key offerings
            • 14.21 ViewSonic
              • ViewSonic - Overview
              • ViewSonic - Product / Service
              • ViewSonic - Key offerings
            • 14.22 Vivitek
              • Vivitek - Overview
              • Vivitek - Product / Service
              • Vivitek - Key offerings
            • 14.23 AAZTEC INDIA SOLIUTION PVT LTD.
              • AAZTEC INDIA SOLIUTION PVT LTD. - Overview
              • AAZTEC INDIA SOLIUTION PVT LTD. - Product / Service
              • AAZTEC INDIA SOLIUTION PVT LTD. - Key offerings
            • 14.24 Alphabet Inc.
              • Alphabet Inc. - Overview
              • Alphabet Inc. - Product / Service
              • Alphabet Inc. - Key offerings
            • 14.25 Apple Inc.
              • Apple Inc. - Overview
              • Apple Inc. - Product / Service
              • Apple Inc. - Key offerings
            • 14.26 ASUSTeK Computer Inc.
              • ASUSTeK Computer Inc. - Overview
              • ASUSTeK Computer Inc. - Product / Service
              • ASUSTeK Computer Inc. - Key offerings
            • 14.27 Avocor Group
              • Avocor Group - Overview
              • Avocor Group - Product / Service
              • Avocor Group - Key offerings
            • 14.28 BenQ Corp.
              • BenQ Corp. - Overview
              • BenQ Corp. - Product / Service
              • BenQ Corp. - Key offerings
            • 14.29 Clevertouch
              • Clevertouch - Overview
              • Clevertouch - Product / Service
              • Clevertouch - Key offerings
            • 14.30 Dell Technologies Inc.
              • Dell Technologies Inc. - Overview
              • Dell Technologies Inc. - Product / Service
              • Dell Technologies Inc. - Key offerings
            • 14.31 HP Inc.
              • HP Inc. - Overview
              • HP Inc. - Product / Service
              • HP Inc. - Key offerings
            • 14.32 Lenovo Group Ltd.
              • Lenovo Group Ltd. - Overview
              • Lenovo Group Ltd. - Product / Service
              • Lenovo Group Ltd. - Key offerings
            • 14.33 Microsoft Corp.
              • Microsoft Corp. - Overview
              • Microsoft Corp. - Product / Service
              • Microsoft Corp. - Key offerings
            • 14.34 Newline Interactive Inc.
              • Newline Interactive Inc. - Overview
              • Newline Interactive Inc. - Product / Service
              • Newline Interactive Inc. - Key offerings
            • 14.35 Panasonic Holdings Corp.
              • Panasonic Holdings Corp. - Overview
              • Panasonic Holdings Corp. - Product / Service
              • Panasonic Holdings Corp. - Key offerings
            • 14.36 Promethean World Ltd.
              • Promethean World Ltd. - Overview
              • Promethean World Ltd. - Product / Service
              • Promethean World Ltd. - Key offerings
            • 14.37 Samsung Electronics Co. Ltd.
              • Samsung Electronics Co. Ltd. - Overview
              • Samsung Electronics Co. Ltd. - Product / Service
              • Samsung Electronics Co. Ltd. - Key offerings
            • 14.38 Sharp Corp.
              • Sharp Corp. - Overview
              • Sharp Corp. - Product / Service
              • Sharp Corp. - Key offerings
            • 14.39 SMART Technologies ULC
              • SMART Technologies ULC - Overview
              • SMART Technologies ULC - Product / Service
              • SMART Technologies ULC - Key offerings
            • 14.40 Sony Group Corp.
              • Sony Group Corp. - Overview
              • Sony Group Corp. - Product / Service
              • Sony Group Corp. - Key offerings
            • 14.41 ViewSonic Corp.
              • ViewSonic Corp. - Overview
              • ViewSonic Corp. - Product / Service
              • ViewSonic Corp. - Key offerings
            • 14.42 Zenzero Solutions Ltd.
              • Zenzero Solutions Ltd. - Overview
              • Zenzero Solutions Ltd. - Product / Service
              • Zenzero Solutions Ltd. - Key offerings

            13 Appendix

            • 13.1 Scope of the report
              • 13.2 Inclusions and exclusions checklist
                • Exhibit 180: Inclusions checklist
                • Exhibit 181: Exclusions checklist
              • 13.3 Currency conversion rates for US$
                • Exhibit 182: Currency conversion rates for US$
              • 13.4 Research methodology
                • Exhibit 183: Research methodology
                • Exhibit 184: Validation techniques employed for market sizing
                • Exhibit 185: Information sources
              • 13.5 List of abbreviations
                • Exhibit 186: List of abbreviations

              Research Methodology

              Technavio presents a detailed picture of the market by way of study, synthesis, and summation of data from multiple sources. The analysts have presented the various facets of the market with a particular focus on identifying the key industry influencers. The data thus presented is comprehensive, reliable, and the result of extensive research, both primary and secondary.

              INFORMATION SOURCES

              Primary sources

              • Manufacturers and suppliers
              • Channel partners
              • Industry experts
              • Strategic decision makers

              Secondary sources

              • Industry journals and periodicals
              • Government data
              • Financial reports of key industry players
              • Historical data
              • Press releases

              DATA ANALYSIS

              Data Synthesis

              • Collation of data
              • Estimation of key figures
              • Analysis of derived insights

              Data Validation

              • Triangulation with data models
              • Reference against proprietary databases
              • Corroboration with industry experts

              REPORT WRITING

              Qualitative

              • Market drivers
              • Market challenges
              • Market trends
              • Five forces analysis

              Quantitative

              • Market size and forecast
              • Market segmentation
              • Geographical insights
              • Competitive landscape

              Interested in this report?

              Get your sample now to see our research methodology and insights!

              Download Now

              Frequently Asked Questions

              Education Hardware market growth will increase by $ 40.45 bn during 2024-2028 .

              The Education Hardware market is expected to grow at a CAGR of 13.45% during 2024-2028 .

              Education Hardware market is segmented by Application( K-12 education, Higher education) Type( PCs, Interactive displays, Classroom wearables, VR/AR Device)

              Acer, Apple, Asus, BenQ, Boxlight, Cisco Systems, Dell Technologies, Epson, Hitachi, HP Inc., Lenovo, Microsoft, NEC Corporation, Panasonic, Promethean, Samsung Electronics, SMART Technologies, Sony, ViewSonic, Vivitek are a few of the key vendors in the Education Hardware market.

              North America will register the highest growth rate of 42% among the other regions. Therefore, the Education Hardware market in North America is expected to garner significant business opportunities for the vendors during the forecast period.

              US, China, Germany, Japan, UK, Australia, India, France, Brazil, UAE, Rest of World (ROW), Saudi Arabia, France, South Korea, Mexico, Italy, Spain

              • Rise in adoption of online learning platforms is the driving factor this market.
              • digital content and assessment tools within educational institutionsThe global education hardware market has witnessed a significant rise in the adoption of online learning platforms is the driving factor this market.
              • digital content and assessment tools within educational institutions. This surge in adoption reflects a fundamental shift towards digital transformation in the education sector is the driving factor this market.
              • driven by the need for more engaging is the driving factor this market.
              • personalized is the driving factor this market.
              • and efficient learning experiences. One key driver behind this trend is the increasing availability and accessibility of digital educational content. Educational institutions are embracing digital textbooks is the driving factor this market.
              • e-books is the driving factor this market.
              • multimedia resources is the driving factor this market.
              • and interactive learning software as part of their curriculum. For example is the driving factor this market.
              • schools and universities are integrating digital content into their courses is the driving factor this market.
              • enabling students to access a wealth of educational materials in digital formats is the driving factor this market.
              • thereby enhancing the availability of resources and reducing reliance on traditional printed materials. The adoption of online learning platforms has revolutionized the way education is delivered and accessed. Virtual learning environments is the driving factor this market.
              • learning management systems is the driving factor this market.
              • and online course platforms have become integral components of the education landscape. For instance is the driving factor this market.
              • many educational institutions have implemented online learning platforms that offer virtual classrooms is the driving factor this market.
              • interactive resources is the driving factor this market.
              • and seamless communication tools is the driving factor this market.
              • enabling students to engage in distance learning and hybrid learning models. In addition is the driving factor this market.
              • the incorporation of digital assessment tools has transformed the evaluation and grading processes within educational institutions. Online assessment platforms is the driving factor this market.
              • digital testing software is the driving factor this market.
              • and interactive evaluation tools are being utilized to conduct formative assessments is the driving factor this market.
              • quizzes is the driving factor this market.
              • and examinations. For example is the driving factor this market.
              • universities and colleges are integrating with digital assessment tools is the driving factor this market.
              • which allow automated grading is the driving factor this market.
              • immediate feedback is the driving factor this market.
              • and data-driven insights is the driving factor this market.
              • leading to more efficient and effective assessment practices. Moreover is the driving factor this market.
              • the rise in the adoption of digital content is the driving factor this market.
              • online learning platforms is the driving factor this market.
              • and digital assessment tools has been particularly accelerated by recent global events that necessitated a shift towards remote and hybrid learning models. Educational institutions worldwide have swiftly adapted to the use of digital tools to ensure continuity of learning during challenging times is the driving factor this market.
              • further driving the demand for education hardware to support these digital initiatives. Thus is the driving factor this market.
              • the above-mentioned factors are expected to increase the adoption of online learning platforms is the driving factor this market.
              • digital content is the driving factor this market.
              • and assessment tools is the driving factor this market.
              • which will propel the growth of the global education hardware market during the forecast period. is the driving factor this market.

              The Education Hardware market vendors should focus on grabbing business opportunities from the K-12 education segment as it accounted for the largest market share in the base year.