Embedded Systems Power Amplifier Market Analysis APAC, North America, Europe, South America, Middle East and Africa - US, China, Japan, South Korea, Germany - Size and Forecast 2024-2028

Embedded Systems Power Amplifier Market Analysis APAC, North America, Europe, South America, Middle East and Africa - US, China, Japan, South Korea, Germany - Size and Forecast 2024-2028

Published: Feb 2024 160 Pages SKU: IRTNTR77588

Market Overview at a Glance

$2.06 B
Market Opportunity
6.55%
CAGR
5.85
YoY growth 2023-2024(%)

Embedded Systems Power Amplifier Market Size 2024-2028

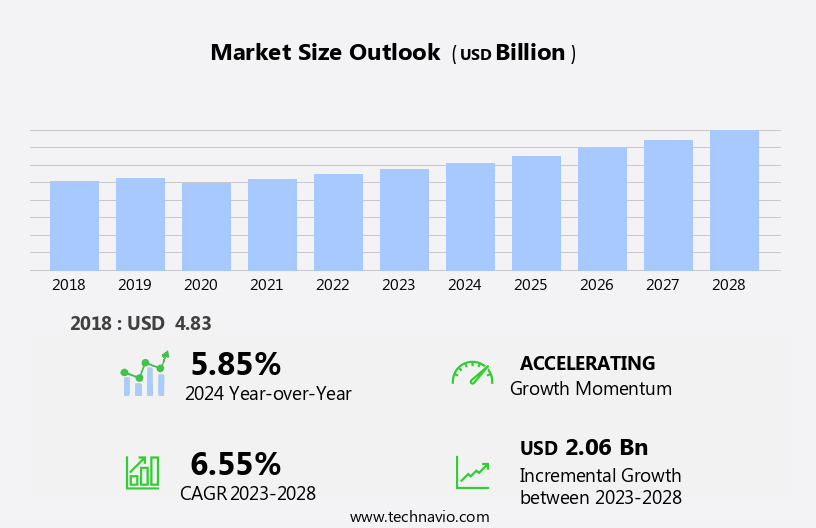
The embedded systems power amplifier market size is forecast to increase by USD 2.06 billion at a CAGR of 6.55% between 2023 and 2028.

  • Embedded systems power amplifiers have witnessed significant growth in recent years, driven by the increasing adoption of Internet of Things (IoT) technology and the integration of power amplifiers into various IoT devices. GaN (Gallium Nitride) technology is another trend In the market, as it offers advantages such as high power density, efficiency, and reliability. However, the high energy consumption of embedded systems power amplifiers remains a challenge that requires ongoing research and development to improve energy efficiency and reduce power consumption. As IoT continues to expand and GaN technology gains wider acceptance, the market is expected to experience continued growth.
  • The market analysis report provides a comprehensive study of these trends and growth factors, offering valuable insights for stakeholders and industry participants.

  • What will be the Size of the Embedded Systems Power Amplifier Market During the Forecast Period?

    Embedded Systems Power Amplifier Market Size

     Request Free Sample

  • The market is experiencing significant growth due to the increasing demand for next-generation wireless communication standards, such as 5G, and the proliferation of Internet of Things (IoT) devices. Power amplifiers play a crucial role in wireless communication systems by boosting output signals and ensuring base station efficiency. The market is driven by trends towards infrastructure modernization, RF communication optimization, and wireless network optimization. Power amplifier technologies, including linear amplifier technology and wideband power amplifiers, are evolving to address the challenges of RF front-end design, power supply current management, and signal processing algorithms. Gallium arsenide (GaAs), silicon germanium (SiGe), and gallium nitride (GaN) are popular power semiconductor applications for power amplifier design.
  • The market is also influenced by semiconductor technology trends, such as the development of high-power amplifiers, linear amplifier technology, and power amplifier simulation tools. Power amplifier modules and research are essential for RF communication applications, including Bluetooth Low Energy, mobile broadband performance, and RF ablation treatment. Additionally, power amplifier trends include RF communication in space exploration technology and smart home automation. Overall, the market is expected to continue growing due to the increasing demand for wireless connectivity solutions and the need for signal boosting in various industries. Power amplifier testing and development are ongoing to ensure optimal performance and efficiency in RF communication systems.

  • How is this Embedded Systems Power Amplifier Industry segmented and which is the largest segment?

    The embedded systems power amplifier industry research report provides comprehensive data (region-wise segment analysis), with forecasts and estimates in "USD billion" for the period 2024-2028, as well as historical data from 2018-2022 for the following segments.

    • Application
      • Consumer electronics
      • Wireless communication
      • Industrial
    • Technology
      • CMOS
      • GaAs/GaN/SiGe
    • Geography
      • APAC
        • China
        • Japan
        • South Korea
      • North America
        • US
      • Europe
        • Germany
      • South America
        • Middle East and Africa

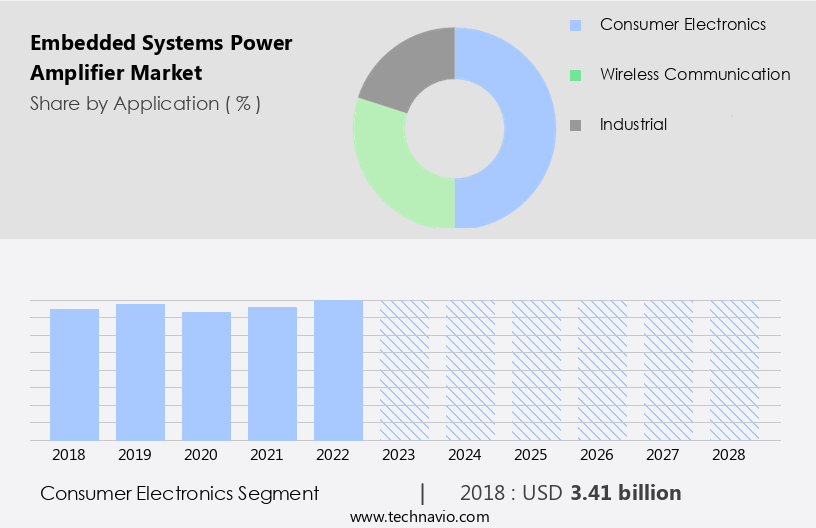
        By Application Insights

        The consumer electronics segment is estimated to witness significant growth during the forecast period. The market is experiencing significant growth, particularly In the consumer electronics sector. The proliferation of smartphones, tablets, smart TVs, wearables, and other wireless devices has fueled the demand for integrated power amplifiers. These amplifiers enhance audio quality, signal processing, and overall performance in consumer electronics. The increasing consumer preference for high-definition audio experiences and advanced connectivity features bolsters the importance of embedded power amplifiers in this industry. Moreover, the adoption of power-efficient amplifiers extends battery life in portable devices. As innovation continues to shape the consumer electronics landscape, the demand for embedded power amplifiers is anticipated to increase, propelling the expansion of the consumer electronics segment and driving market growth during the forecast period.

        Key applications include wireless communication technologies, such as 5G networks, Bluetooth, and Wi-Fi, as well as infrastructure development for smart cities, IoT devices, and industrial activities. The market is expected to be driven by the increasing demand for high-power levels, low distortion, and high efficiency in various applications, including audio systems, automotive, military & defense, and medical devices. Power semiconductors, such as gallium nitride and gallium arsenide, are crucial components In the development of high-performance power amplifiers.


        Embedded Systems Power Amplifier Market Size

        Get a glance at the market report of various segments Request Free Sample

        The Consumer electronics segment was valued at USD 3.41 billion in 2018 and showed a gradual increase during the forecast period.

        Regional Analysis

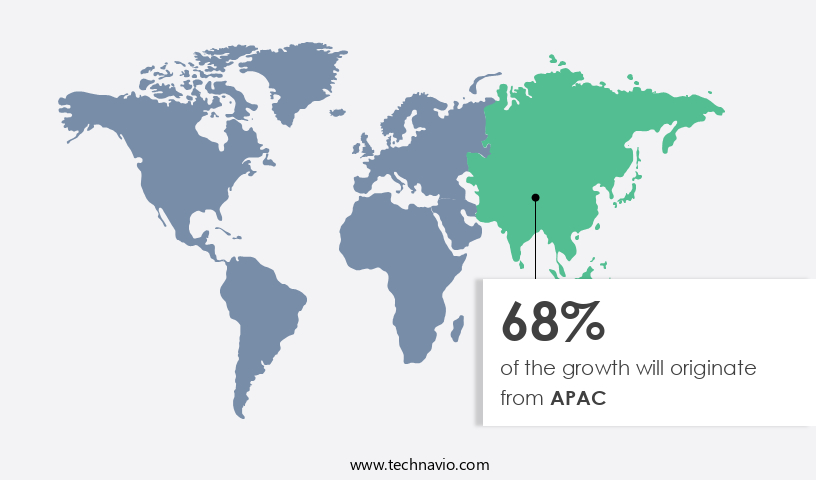
        APAC is estimated to contribute 68% to the growth of the global market during the forecast period. Technavio’s analysts have elaborately explained the regional trends and drivers that shape the market during the forecast period.

        Embedded Systems Power Amplifier Market Share by Geography

        For more insights on the market size of various regions, Request Free Sample

        The market In the Asia Pacific (APAC) region is experiencing significant growth due to the expanding electronics sector, increased usage of smart devices, and rising industrial automation. With a large and growing customer base in countries like China and India, there is a surging demand for smartphones, Internet of Things (IoT) devices, and automotive applications, which necessitates the use of embedded power amplifiers. The region's focus on implementing 5G technology is also driving market growth, as power amplifiers play a crucial role in enhancing communication capacities. Additionally, government initiatives promoting Industry 4.0 and smart city development are further fueling market expansion.

        Key applications include wireless communication technologies such as Bluetooth, Wi-Fi, and 5G, virtual and augmented reality, base stations, and various electronic devices. Power amplifiers are essential for maintaining signal quality and ensuring efficient transmission, particularly in high-data-rate applications and small cells. The market is driven by factors such as increasing consumer awareness, demand for low distortion and high power levels, and the adoption of power semiconductors like gallium nitride and gallium arsenide. Applications span across various industries, including consumer electronics, automotive, military & defense, and industrial activities.


        Market Dynamics

        Our researchers analyzed the data with 2023 as the base year, along with the key drivers, trends, and challenges. A holistic analysis of drivers will help companies refine their marketing strategies to gain a competitive advantage.

        What are the key market drivers leading to the rise In the adoption of Embedded Systems Power Amplifier Industry?

        • Increasing adoption of IoT is the key driver of the market.The global market for embedded systems power amplifiers is experiencing significant growth due to the increasing deployment of Internet of Things (IoT) devices. IoT devices, such as smart sensors and connected appliances, operate in diverse environments with varying communication ranges. Efficient signal transmission and reception over long distances are crucial for these devices. Embedded systems power amplifiers play a vital role in ensuring reliable communication, enhancing the overall performance of IoT devices, and facilitating the seamless integration of various applications. As IoT applications expand into sectors like healthcare, smart cities, and industrial automation, the demand for compact and power-efficient amplification solutions is increasing.

          Embedded power amplifiers, which are essential for IoT devices, enable linearity and high efficiency, contributing to the expansion of the market during the forecast period. These amplifiers are also integral to wireless communication technologies, including 5G wireless networks, Bluetooth, and Wi-Fi, as well as virtual and augmented reality applications, motor control systems, base stations, and infrastructure projects. Additionally, they are used in various electronic devices, such as laptops, televisions, audio systems, and medical devices, requiring high power levels and low distortion. Power semiconductors, such as gallium nitride and gallium arsenide, are widely used In the production of RF power amplifiers for various applications, including wireless communication, instrumentation, and energy amplifiers.

          The market is expected to grow further due to the increasing adoption of power amplifiers in smart grids, smart city initiatives, high-energy physics, and military & defense applications.

        What are the market trends shaping the Embedded Systems Power Amplifier market?

        • Increasing adoption of GaN technology in power amplifiers is the upcoming market trend.The market is experiencing notable growth, driven by the adoption of GaN (gallium nitride) technology. GaN power amplifiers offer superior efficiency and high-frequency operational capabilities, making them ideal for compact and energy-efficient embedded devices in various industries. Communication systems, radar systems, and other electronic devices benefit significantly from GaN technology's power density and reliability. As industries focus on downsizing and enhanced performance, the utilization of GaN power amplifiers is poised to increase further, fostering market expansion during the forecast period. GaN technology's efficiency at high frequencies is particularly advantageous for wireless communication technologies, including 5G wireless networks, virtual and augmented reality, Bluetooth, and Wi-Fi.

          Additionally, GaN power amplifiers are suitable for powering small cells, IoT devices, and other wireless devices, as well as audio power amplifiers, electronic apparatus, and linear power amplifiers. GaN power amplifiers' high power levels and low distortion make them suitable for applications in consumer electronics devices, such as televisions, laptops, and tablets, as well as industrial activities, automotive, military & defense, and space. The increasing demand for high-speed data rates, broadband amplifiers, energy amplifiers, and RF power amplifiers further bolsters market growth. GaN technology's applicability to various industries, including medical devices, smart grids, smart city initiatives, high-energy physics, and smart home gadgets, underscores its significance In the market.

        What challenges does the Embedded Systems Power Amplifier Industry face during its growth?

        • High energy consumption by embedded systems power amplifier is a key challenge affecting the industry growth.In the market, the demand for efficient power usage is paramount, especially in battery-powered devices. Power amplifiers are essential components in embedded systems, enabling optimal performance and energy efficiency. With consumers prioritizing longer battery life and portable devices, manufacturers face increasing pressure to deliver power amplifiers that offer superior performance while minimizing energy consumption. This balance is crucial for the integration of embedded systems in IoT devices, wearables, and other battery-operated gadgets. Achieving this equilibrium necessitates innovative design approaches, advanced power management techniques, and the adoption of energy-efficient technologies. Failure to address this challenge adequately may hinder the expansion of embedded systems, limiting the growth potential of the market during the forecast period.

          Key market dynamics include the integration of power amplifiers in 5G wireless networks, wireless communication technologies such as Bluetooth, virtual reality, and augmented reality, and the increasing use of power amplifiers in infrastructure like base stations and antennas. Additionally, power amplifiers are increasingly being used in various electronic devices, including motor control systems, instrumentation, and audio systems, as well as in industrial activities, automotive applications, and military & defense systems. The demand for power amplifiers is further driven by the need for high power levels, low distortion, and high efficiency in various applications, including mobile broadband, RF power amplifiers, and energy amplifiers.

          The use of power semiconductors, such as gallium nitride and gallium arsenide, is also driving market growth. The integration of power amplifiers in smart grids, smart city initiatives, high-energy physics, and various consumer electronics devices, including laptops, televisions, tablets, and smart home devices, is further fueling market growth. The market is also witnessing significant advancements in linear power amplifiers and audio power amplifiers, which offer improved signal amplification and linearity standards. The Internet of Things (IoT) and the increasing number of IoT devices are also expected to boost market growth. In summary, The market is witnessing significant growth due to the increasing demand for efficient power usage, the integration of power amplifiers in various applications, and the adoption of advanced technologies.

        Exclusive Customer Landscape

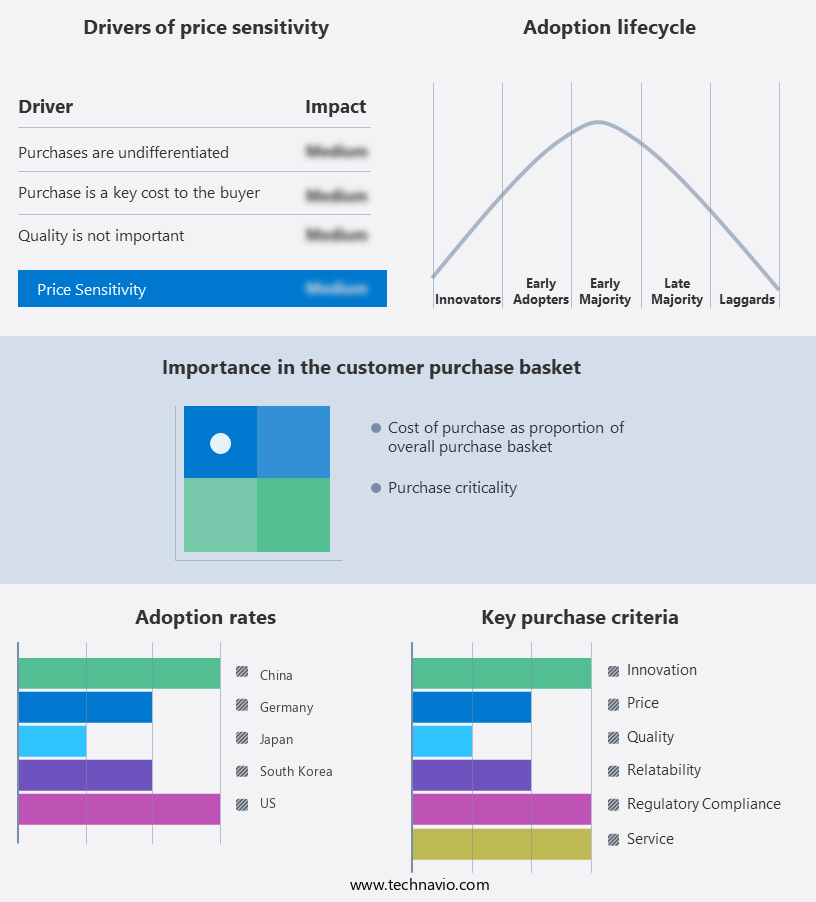
        The embedded systems power amplifier market forecasting report includes the adoption lifecycle of the market, covering from the innovator’s stage to the laggard’s stage. It focuses on adoption rates in different regions based on penetration. Furthermore, the embedded systems power amplifier market report also includes key purchase criteria and drivers of price sensitivity to help companies evaluate and develop their market growth analysis strategies.

        Embedded Systems Power Amplifier Market Share by Geography

         Customer Landscape

        Key Companies & Market Insights

        Companies are implementing various strategies, such as strategic alliances, embedded systems power amplifier market forecast, partnerships, mergers and acquisitions, geographical expansion, and product/service launches, to enhance their presence In the industry.

        Amcom Communications Inc. - Embedded systems power amplifiers, featuring GaN and GaAs semiconductor technology, span the frequency range from kilohertz to 95GHz. These amplifiers, an essential component of various communication and industrial applications, deliver high power efficiency and gain. GaN technology, with its superior power handling capabilities and high electron mobility, is increasingly adopted for high power applications. GaAs semiconductors, known for their high saturation velocity and excellent microwave properties, are favored for applications requiring high linearity and low noise figures. The integration of these advanced semiconductor technologies into embedded systems power amplifiers enhances system performance and reliability, making them a preferred choice for numerous industries.

        The industry research and growth report includes detailed analyses of the competitive landscape of the market and information about key companies, including:

        • Amcom Communications Inc.
        • Analog Devices Inc.
        • Broadcom Inc.
        • Ciao Wireless Inc.
        • Infineon Technologies AG
        • Microchip Technology Inc.
        • NuWaves RF Solutions
        • NXP Semiconductors NV
        • ON Semiconductor Corp.
        • Qorvo Inc.
        • RFHIC Corp.
        • ROHM Co. Ltd.
        • Silicon Laboratories Inc.
        • Skyworks Solutions Inc.
        • STMicroelectronics International NV
        • TE Connectivity Ltd.
        • Renesas Electronics Corp.
        • Texas Instruments Inc.

        Qualitative and quantitative analysis of companies has been conducted to help clients understand the wider business environment as well as the strengths and weaknesses of key industry players. Data is qualitatively analyzed to categorize companies as pure play, category-focused, industry-focused, and diversified; it is quantitatively analyzed to categorize companies as dominant, leading, strong, tentative, and weak.

        Research Analyst Overview

        Embedded systems have become an integral part of modern wireless communication networks, enabling the transmission and reception of data at high speeds and frequencies. One crucial component of these systems is the power amplifier, which plays a vital role in amplifying the output power of electronic devices to ensure efficient and effective wireless communication. Power amplifiers are essential for various applications, including wireless communication technologies such as 5G networks, virtual and augmented reality, and the Internet of Things (IoT). These systems require high power levels and low distortion to maintain signal quality and ensure reliable communication. The power amplifier market is driven by the growing demand for wireless connectivity in various industries, including consumer electronics, automotive, and industrial activities.

        The increasing adoption of wireless communication technologies, such as Bluetooth, Wi-Fi, and cellular networks, is fueling the growth of the power amplifier market. Moreover, the proliferation of wireless devices, including smartphones, tablets, laptops, and smart home gadgets, is driving the need for efficient and high-performance power amplifiers. The demand for power amplifiers is also increasing in sectors such as military & defense, healthcare, and smart grids. The power amplifier market is characterized by technological advancements, with semiconductor companies investing heavily in research and development to improve the efficiency and linearity of power amplifiers. Gallium nitride (GaN) and gallium arsenide (GaAs) are popular materials used in power amplifier design due to their high power handling capabilities and high electron mobility.

        The market for power amplifiers is also influenced by regulatory requirements, such as linearity standards, which ensure that the amplified output signal maintains a consistent and high-quality signal. This is particularly important in applications where signal quality is critical, such as in medical devices and military & defense applications. The power amplifier market is expected to grow significantly In the coming years, driven by the increasing demand for wireless communication and the need for more efficient and high-performance power amplifiers. The market is also being shaped by emerging technologies, such as 5G networks, which require high-power and high-efficiency power amplifiers to support the massive connectivity and high data rates required by these networks.

        In conclusion, the power amplifier market is a dynamic and growing market, driven by the increasing demand for wireless communication and the need for more efficient and high-performance power amplifiers. The market is characterized by technological advancements, regulatory requirements, and the adoption of emerging technologies, such as 5G networks and the Internet of Things. The market is expected to continue growing In the coming years, driven by these trends and the increasing demand for wireless connectivity in various industries.


        Market Scope

        Report Coverage

        Details

        Page number

        160

        Base year

        2023

        Historic period

        2018-2022

        Forecast period

        2024-2028

        Growth momentum & CAGR

        Accelerate at a CAGR of 6.55%

        Market growth 2024-2028

        USD 2.06 billion

        Market structure

        Fragmented

        YoY growth 2023-2024(%)

        5.85

        Key countries

        US, China, Japan, South Korea, and Germany

        Competitive landscape

        Leading Companies, Market Positioning of Companies, Competitive Strategies, and Industry Risks

        Request Free Sample

        What are the Key Data Covered in this Embedded Systems Power Amplifier Market Research and Growth Report?

        • CAGR of the Embedded Systems Power Amplifier industry during the forecast period
        • Detailed information on factors that will drive the growth and forecasting between 2024 and 2028
        • Precise estimation of the size of the market and its contribution of the industry in focus to the parent market
        • Accurate predictions about upcoming growth and trends and changes in consumer behaviour
        • Growth of the market across APAC, North America, Europe, South America, and Middle East and Africa
        • Thorough analysis of the market’s competitive landscape and detailed information about companies
        • Comprehensive analysis of factors that will challenge the embedded systems power amplifier market growth of industry companies

        We can help! Our analysts can customize this embedded systems power amplifier market research report to meet your requirements.

        Get in touch


        1 Executive Summary

        • 1.1 Market overview
          • Exhibit 01: Executive Summary – Chart on Market Overview
          • Exhibit 02: Executive Summary – Data Table on Market Overview
          • Exhibit 03: Executive Summary – Chart on Global Market Characteristics
          • Exhibit 04: Executive Summary – Chart on Market by Geography
          • Exhibit 05: Executive Summary – Chart on Market Segmentation by Application
          • Exhibit 06: Executive Summary – Chart on Market Segmentation by Technology
          • Exhibit 07: Executive Summary – Chart on Incremental Growth
          • Exhibit 08: Executive Summary – Data Table on Incremental Growth
          • Exhibit 09: Executive Summary – Chart on Vendor Market Positioning

        2 Market Landscape

        • 2.1 Market ecosystem
          • Exhibit 10: Parent market
          • Exhibit 11: Market Characteristics

        3 Market Sizing

        • 3.1 Market definition
          • Exhibit 12: Offerings of vendors included in the market definition
        • 3.2 Market segment analysis
          • Exhibit 13: Market segments
        • 3.3 Market size 2023
          • 3.4 Market outlook: Forecast for 2023-2028
            • Exhibit 14: Chart on Global - Market size and forecast 2023-2028 ($ billion)
            • Exhibit 15: Data Table on Global - Market size and forecast 2023-2028 ($ billion)
            • Exhibit 16: Chart on Global Market: Year-over-year growth 2023-2028 (%)
            • Exhibit 17: Data Table on Global Market: Year-over-year growth 2023-2028 (%)

          4 Historic Market Size

          • 4.1 Global embedded systems power amplifier market 2018 - 2022
            • Exhibit 18: Historic Market Size – Data Table on global embedded systems power amplifier market 2018 - 2022 ($ billion)
          • 4.2 Application Segment Analysis 2018 - 2022
            • Exhibit 19: Historic Market Size – Application Segment 2018 - 2022 ($ billion)
          • 4.3 Technology Segment Analysis 2018 - 2022
            • Exhibit 20: Historic Market Size – Technology Segment 2018 - 2022 ($ billion)
          • 4.4 Geography Segment Analysis 2018 - 2022
            • Exhibit 21: Historic Market Size – Geography Segment 2018 - 2022 ($ billion)
          • 4.5 Country Segment Analysis 2018 - 2022
            • Exhibit 22: Historic Market Size – Country Segment 2018 - 2022 ($ billion)

          5 Five Forces Analysis

          • 5.1 Five forces summary
            • Exhibit 23: Five forces analysis - Comparison between 2023 and 2028
          • 5.2 Bargaining power of buyers
            • Exhibit 24: Chart on Bargaining power of buyers – Impact of key factors 2023 and 2028
          • 5.3 Bargaining power of suppliers
            • Exhibit 25: Bargaining power of suppliers – Impact of key factors in 2023 and 2028
          • 5.4 Threat of new entrants
            • Exhibit 26: Threat of new entrants – Impact of key factors in 2023 and 2028
          • 5.5 Threat of substitutes
            • Exhibit 27: Threat of substitutes – Impact of key factors in 2023 and 2028
          • 5.6 Threat of rivalry
            • Exhibit 28: Threat of rivalry – Impact of key factors in 2023 and 2028
          • 5.7 Market condition
            • Exhibit 29: Chart on Market condition - Five forces 2023 and 2028

          6 Market Segmentation by Application

          • 6.1 Market segments
            • Exhibit 30: Chart on Application - Market share 2023-2028 (%)
            • Exhibit 31: Data Table on Application - Market share 2023-2028 (%)
          • 6.2 Comparison by Application
            • Exhibit 32: Chart on Comparison by Application
            • Exhibit 33: Data Table on Comparison by Application
          • 6.3 Consumer electronics - Market size and forecast 2023-2028
            • Exhibit 34: Chart on Consumer electronics - Market size and forecast 2023-2028 ($ billion)
            • Exhibit 35: Data Table on Consumer electronics - Market size and forecast 2023-2028 ($ billion)
            • Exhibit 36: Chart on Consumer electronics - Year-over-year growth 2023-2028 (%)
            • Exhibit 37: Data Table on Consumer electronics - Year-over-year growth 2023-2028 (%)
          • 6.4 Wireless communication - Market size and forecast 2023-2028
            • Exhibit 38: Chart on Wireless communication - Market size and forecast 2023-2028 ($ billion)
            • Exhibit 39: Data Table on Wireless communication - Market size and forecast 2023-2028 ($ billion)
            • Exhibit 40: Chart on Wireless communication - Year-over-year growth 2023-2028 (%)
            • Exhibit 41: Data Table on Wireless communication - Year-over-year growth 2023-2028 (%)
          • 6.5 Industrial - Market size and forecast 2023-2028
            • Exhibit 42: Chart on Industrial - Market size and forecast 2023-2028 ($ billion)
            • Exhibit 43: Data Table on Industrial - Market size and forecast 2023-2028 ($ billion)
            • Exhibit 44: Chart on Industrial - Year-over-year growth 2023-2028 (%)
            • Exhibit 45: Data Table on Industrial - Year-over-year growth 2023-2028 (%)
          • 6.6 Market opportunity by Application
            • Exhibit 46: Market opportunity by Application ($ billion)
            • Exhibit 47: Data Table on Market opportunity by Application ($ billion)

          7 Market Segmentation by Technology

          • 7.1 Market segments
            • Exhibit 48: Chart on Technology - Market share 2023-2028 (%)
            • Exhibit 49: Data Table on Technology - Market share 2023-2028 (%)
          • 7.2 Comparison by Technology
            • Exhibit 50: Chart on Comparison by Technology
            • Exhibit 51: Data Table on Comparison by Technology
          • 7.3 CMOS - Market size and forecast 2023-2028
            • Exhibit 52: Chart on CMOS - Market size and forecast 2023-2028 ($ billion)
            • Exhibit 53: Data Table on CMOS - Market size and forecast 2023-2028 ($ billion)
            • Exhibit 54: Chart on CMOS - Year-over-year growth 2023-2028 (%)
            • Exhibit 55: Data Table on CMOS - Year-over-year growth 2023-2028 (%)
          • 7.4 GaAs/GaN/SiGe - Market size and forecast 2023-2028
            • Exhibit 56: Chart on GaAs/GaN/SiGe - Market size and forecast 2023-2028 ($ billion)
            • Exhibit 57: Data Table on GaAs/GaN/SiGe - Market size and forecast 2023-2028 ($ billion)
            • Exhibit 58: Chart on GaAs/GaN/SiGe - Year-over-year growth 2023-2028 (%)
            • Exhibit 59: Data Table on GaAs/GaN/SiGe - Year-over-year growth 2023-2028 (%)
          • 7.5 Market opportunity by Technology
            • Exhibit 60: Market opportunity by Technology ($ billion)
            • Exhibit 61: Data Table on Market opportunity by Technology ($ billion)

          8 Customer Landscape

          • 8.1 Customer landscape overview
            • Exhibit 62: Analysis of price sensitivity, lifecycle, customer purchase basket, adoption rates, and purchase criteria

          9 Geographic Landscape

          • 9.1 Geographic segmentation
            • Exhibit 63: Chart on Market share by geography 2023-2028 (%)
            • Exhibit 64: Data Table on Market share by geography 2023-2028 (%)
          • 9.2 Geographic comparison
            • Exhibit 65: Chart on Geographic comparison
            • Exhibit 66: Data Table on Geographic comparison
          • 9.3 APAC - Market size and forecast 2023-2028
            • Exhibit 67: Chart on APAC - Market size and forecast 2023-2028 ($ billion)
            • Exhibit 68: Data Table on APAC - Market size and forecast 2023-2028 ($ billion)
            • Exhibit 69: Chart on APAC - Year-over-year growth 2023-2028 (%)
            • Exhibit 70: Data Table on APAC - Year-over-year growth 2023-2028 (%)
          • 9.4 North America - Market size and forecast 2023-2028
            • Exhibit 71: Chart on North America - Market size and forecast 2023-2028 ($ billion)
            • Exhibit 72: Data Table on North America - Market size and forecast 2023-2028 ($ billion)
            • Exhibit 73: Chart on North America - Year-over-year growth 2023-2028 (%)
            • Exhibit 74: Data Table on North America - Year-over-year growth 2023-2028 (%)
          • 9.5 Europe - Market size and forecast 2023-2028
            • Exhibit 75: Chart on Europe - Market size and forecast 2023-2028 ($ billion)
            • Exhibit 76: Data Table on Europe - Market size and forecast 2023-2028 ($ billion)
            • Exhibit 77: Chart on Europe - Year-over-year growth 2023-2028 (%)
            • Exhibit 78: Data Table on Europe - Year-over-year growth 2023-2028 (%)
          • 9.6 South America - Market size and forecast 2023-2028
            • Exhibit 79: Chart on South America - Market size and forecast 2023-2028 ($ billion)
            • Exhibit 80: Data Table on South America - Market size and forecast 2023-2028 ($ billion)
            • Exhibit 81: Chart on South America - Year-over-year growth 2023-2028 (%)
            • Exhibit 82: Data Table on South America - Year-over-year growth 2023-2028 (%)
          • 9.7 Middle East and Africa - Market size and forecast 2023-2028
            • Exhibit 83: Chart on Middle East and Africa - Market size and forecast 2023-2028 ($ billion)
            • Exhibit 84: Data Table on Middle East and Africa - Market size and forecast 2023-2028 ($ billion)
            • Exhibit 85: Chart on Middle East and Africa - Year-over-year growth 2023-2028 (%)
            • Exhibit 86: Data Table on Middle East and Africa - Year-over-year growth 2023-2028 (%)
          • 9.8 China - Market size and forecast 2023-2028
            • Exhibit 87: Chart on China - Market size and forecast 2023-2028 ($ billion)
            • Exhibit 88: Data Table on China - Market size and forecast 2023-2028 ($ billion)
            • Exhibit 89: Chart on China - Year-over-year growth 2023-2028 (%)
            • Exhibit 90: Data Table on China - Year-over-year growth 2023-2028 (%)
          • 9.9 US - Market size and forecast 2023-2028
            • Exhibit 91: Chart on US - Market size and forecast 2023-2028 ($ billion)
            • Exhibit 92: Data Table on US - Market size and forecast 2023-2028 ($ billion)
            • Exhibit 93: Chart on US - Year-over-year growth 2023-2028 (%)
            • Exhibit 94: Data Table on US - Year-over-year growth 2023-2028 (%)
          • 9.10 Japan - Market size and forecast 2023-2028
            • Exhibit 95: Chart on Japan - Market size and forecast 2023-2028 ($ billion)
            • Exhibit 96: Data Table on Japan - Market size and forecast 2023-2028 ($ billion)
            • Exhibit 97: Chart on Japan - Year-over-year growth 2023-2028 (%)
            • Exhibit 98: Data Table on Japan - Year-over-year growth 2023-2028 (%)
          • 9.11 South Korea - Market size and forecast 2023-2028
            • Exhibit 99: Chart on South Korea - Market size and forecast 2023-2028 ($ billion)
            • Exhibit 100: Data Table on South Korea - Market size and forecast 2023-2028 ($ billion)
            • Exhibit 101: Chart on South Korea - Year-over-year growth 2023-2028 (%)
            • Exhibit 102: Data Table on South Korea - Year-over-year growth 2023-2028 (%)
          • 9.12 Germany - Market size and forecast 2023-2028
            • Exhibit 103: Chart on Germany - Market size and forecast 2023-2028 ($ billion)
            • Exhibit 104: Data Table on Germany - Market size and forecast 2023-2028 ($ billion)
            • Exhibit 105: Chart on Germany - Year-over-year growth 2023-2028 (%)
            • Exhibit 106: Data Table on Germany - Year-over-year growth 2023-2028 (%)
          • 9.13 Market opportunity by geography
            • Exhibit 107: Market opportunity by geography ($ billion)
            • Exhibit 108: Data Tables on Market opportunity by geography ($ billion)

          10 Drivers, Challenges, and Trends

          • 10.1 Market drivers
            • 10.2 Market challenges
              • 10.3 Impact of drivers and challenges
                • Exhibit 109: Impact of drivers and challenges in 2023 and 2028
              • 10.4 Market trends

                11 Vendor Landscape

                • 11.1 Overview
                  • 11.2 Vendor landscape
                    • Exhibit 110: Overview on Criticality of inputs and Factors of differentiation
                  • 11.3 Landscape disruption
                    • Exhibit 111: Overview on factors of disruption
                  • 11.4 Industry risks
                    • Exhibit 112: Impact of key risks on business

                  12 Vendor Analysis

                  • 12.1 Vendors covered
                    • Exhibit 113: Vendors covered
                  • 12.2 Market positioning of vendors
                    • Exhibit 114: Matrix on vendor position and classification
                  • 12.3 Analog Devices Inc.
                    • Exhibit 115: Analog Devices Inc. - Overview
                    • Exhibit 116: Analog Devices Inc. - Business segments
                    • Exhibit 117: Analog Devices Inc. - Key news
                    • Exhibit 118: Analog Devices Inc. - Key offerings
                    • Exhibit 119: Analog Devices Inc. - Segment focus
                  • 12.4 Broadcom Inc.
                    • Exhibit 120: Broadcom Inc. - Overview
                    • Exhibit 121: Broadcom Inc. - Business segments
                    • Exhibit 122: Broadcom Inc. - Key news
                    • Exhibit 123: Broadcom Inc. - Key offerings
                    • Exhibit 124: Broadcom Inc. - Segment focus
                  • 12.5 Infineon Technologies AG
                    • Exhibit 125: Infineon Technologies AG - Overview
                    • Exhibit 126: Infineon Technologies AG - Business segments
                    • Exhibit 127: Infineon Technologies AG - Key news
                    • Exhibit 128: Infineon Technologies AG - Key offerings
                    • Exhibit 129: Infineon Technologies AG - Segment focus
                  • 12.6 Microchip Technology Inc.
                    • Exhibit 130: Microchip Technology Inc. - Overview
                    • Exhibit 131: Microchip Technology Inc. - Business segments
                    • Exhibit 132: Microchip Technology Inc. - Key offerings
                    • Exhibit 133: Microchip Technology Inc. - Segment focus
                  • 12.7 NXP Semiconductors NV
                    • Exhibit 134: NXP Semiconductors NV - Overview
                    • Exhibit 135: NXP Semiconductors NV - Product / Service
                    • Exhibit 136: NXP Semiconductors NV - Key news
                    • Exhibit 137: NXP Semiconductors NV - Key offerings
                  • 12.8 ON Semiconductor Corp.
                    • Exhibit 138: ON Semiconductor Corp. - Overview
                    • Exhibit 139: ON Semiconductor Corp. - Business segments
                    • Exhibit 140: ON Semiconductor Corp. - Key news
                    • Exhibit 141: ON Semiconductor Corp. - Key offerings
                    • Exhibit 142: ON Semiconductor Corp. - Segment focus
                  • 12.9 Qorvo Inc.
                    • Exhibit 143: Qorvo Inc. - Overview
                    • Exhibit 144: Qorvo Inc. - Business segments
                    • Exhibit 145: Qorvo Inc. - Key news
                    • Exhibit 146: Qorvo Inc. - Key offerings
                    • Exhibit 147: Qorvo Inc. - Segment focus
                  • 12.10 Renesas Electronics Corp.
                    • Exhibit 148: Renesas Electronics Corp. - Overview
                    • Exhibit 149: Renesas Electronics Corp. - Business segments
                    • Exhibit 150: Renesas Electronics Corp. - Key news
                    • Exhibit 151: Renesas Electronics Corp. - Key offerings
                    • Exhibit 152: Renesas Electronics Corp. - Segment focus
                  • 12.11 RFHIC Corp.
                    • Exhibit 153: RFHIC Corp. - Overview
                    • Exhibit 154: RFHIC Corp. - Product / Service
                    • Exhibit 155: RFHIC Corp. - Key offerings
                  • 12.12 ROHM Co. Ltd.
                    • Exhibit 156: ROHM Co. Ltd. - Overview
                    • Exhibit 157: ROHM Co. Ltd. - Business segments
                    • Exhibit 158: ROHM Co. Ltd. - Key news
                    • Exhibit 159: ROHM Co. Ltd. - Key offerings
                    • Exhibit 160: ROHM Co. Ltd. - Segment focus
                  • 12.13 Silicon Laboratories Inc.
                    • Exhibit 161: Silicon Laboratories Inc. - Overview
                    • Exhibit 162: Silicon Laboratories Inc. - Product / Service
                    • Exhibit 163: Silicon Laboratories Inc. - Key news
                    • Exhibit 164: Silicon Laboratories Inc. - Key offerings
                  • 12.14 Skyworks Solutions Inc.
                    • Exhibit 165: Skyworks Solutions Inc. - Overview
                    • Exhibit 166: Skyworks Solutions Inc. - Product / Service
                    • Exhibit 167: Skyworks Solutions Inc. - Key offerings
                  • 12.15 STMicroelectronics International NV
                    • Exhibit 168: STMicroelectronics International NV - Overview
                    • Exhibit 169: STMicroelectronics International NV - Business segments
                    • Exhibit 170: STMicroelectronics International NV - Key news
                    • Exhibit 171: STMicroelectronics International NV - Key offerings
                    • Exhibit 172: STMicroelectronics International NV - Segment focus
                  • 12.16 TE Connectivity Ltd.
                    • Exhibit 173: TE Connectivity Ltd. - Overview
                    • Exhibit 174: TE Connectivity Ltd. - Business segments
                    • Exhibit 175: TE Connectivity Ltd. - Key news
                    • Exhibit 176: TE Connectivity Ltd. - Key offerings
                    • Exhibit 177: TE Connectivity Ltd. - Segment focus
                  • 12.17 Texas Instruments Inc.
                    • Exhibit 178: Texas Instruments Inc. - Overview
                    • Exhibit 179: Texas Instruments Inc. - Business segments
                    • Exhibit 180: Texas Instruments Inc. - Key news
                    • Exhibit 181: Texas Instruments Inc. - Key offerings
                    • Exhibit 182: Texas Instruments Inc. - Segment focus

                  13 Appendix

                  • 13.1 Scope of the report
                    • 13.2 Inclusions and exclusions checklist
                      • Exhibit 183: Inclusions checklist
                      • Exhibit 184: Exclusions checklist
                    • 13.3 Currency conversion rates for US$
                      • Exhibit 185: Currency conversion rates for US$
                    • 13.4 Research methodology
                      • Exhibit 186: Research methodology
                      • Exhibit 187: Validation techniques employed for market sizing
                      • Exhibit 188: Information sources
                    • 13.5 List of abbreviations
                      • Exhibit 189: List of abbreviations

                    Research Methodology

                    Technavio presents a detailed picture of the market by way of study, synthesis, and summation of data from multiple sources. The analysts have presented the various facets of the market with a particular focus on identifying the key industry influencers. The data thus presented is comprehensive, reliable, and the result of extensive research, both primary and secondary.

                    INFORMATION SOURCES

                    Primary sources

                    • Manufacturers and suppliers
                    • Channel partners
                    • Industry experts
                    • Strategic decision makers

                    Secondary sources

                    • Industry journals and periodicals
                    • Government data
                    • Financial reports of key industry players
                    • Historical data
                    • Press releases

                    DATA ANALYSIS

                    Data Synthesis

                    • Collation of data
                    • Estimation of key figures
                    • Analysis of derived insights

                    Data Validation

                    • Triangulation with data models
                    • Reference against proprietary databases
                    • Corroboration with industry experts

                    REPORT WRITING

                    Qualitative

                    • Market drivers
                    • Market challenges
                    • Market trends
                    • Five forces analysis

                    Quantitative

                    • Market size and forecast
                    • Market segmentation
                    • Geographical insights
                    • Competitive landscape

                    Interested in this report?

                    Get your sample now to see our research methodology and insights!

                    Download Now

                    Frequently Asked Questions

                    Embedded Systems Power Amplifier market growth will increase by $ 2.06 bn during 2024-2028.

                    The Embedded Systems Power Amplifier market is expected to grow at a CAGR of 6.55% during 2024-2028.

                    Embedded Systems Power Amplifier market is segmented by Application( Consumer electronics, Wireless communication, Industrial) Technology( CMOS, GaAs/GaN/SiGe)

                    Amcom Communications Inc., Analog Devices Inc., Broadcom Inc., Ciao Wireless Inc., Infineon Technologies AG, Microchip Technology Inc., NuWaves RF Solutions, NXP Semiconductors NV, ON Semiconductor Corp., Qorvo Inc., RFHIC Corp., ROHM Co. Ltd., Silicon Laboratories Inc., Skyworks Solutions Inc., STMicroelectronics International NV, TE Connectivity Ltd., Renesas Electronics Corp., Texas Instruments Inc. are a few of the key vendors in the Embedded Systems Power Amplifier market.

                    APAC will register the highest growth rate of 68% among the other regions. Therefore, the Embedded Systems Power Amplifier market in APAC is expected to garner significant business opportunities for the vendors during the forecast period.

                    US, China, Japan, South Korea, Germany

                    • Increasing adoption of IoTThe growing deployment of IoT devices is driving global demand for embedded systems power amplifiers. IoT devices is the driving factor this market.
                    • such as smart sensors and linked appliances is the driving factor this market.
                    • frequently operate in varied contexts with varying communication ranges. Embedded systems power amplifiers are critical to ensure that these devices can transmit and receive signals efficiently over long distances. As IoT applications increase in areas such as healthcare is the driving factor this market.
                    • smart cities is the driving factor this market.
                    • and industrial automation is the driving factor this market.
                    • the demand for compact and power-efficient amplification solutions grows. Embedded power amplifiers allow dependable communication is the driving factor this market.
                    • improve the overall performance of IoT devices is the driving factor this market.
                    • and contribute to the seamless integration of varied applications is the driving factor this market.
                    • hence expected to drive the growth of the global embedded systems power amplifier market during the forecast period. is the driving factor this market.

                    The Embedded Systems Power Amplifier market vendors should focus on grabbing business opportunities from the Consumer electronics segment as it accounted for the largest market share in the base year.