Enterprise Mobility Services Market Size 2024-2028
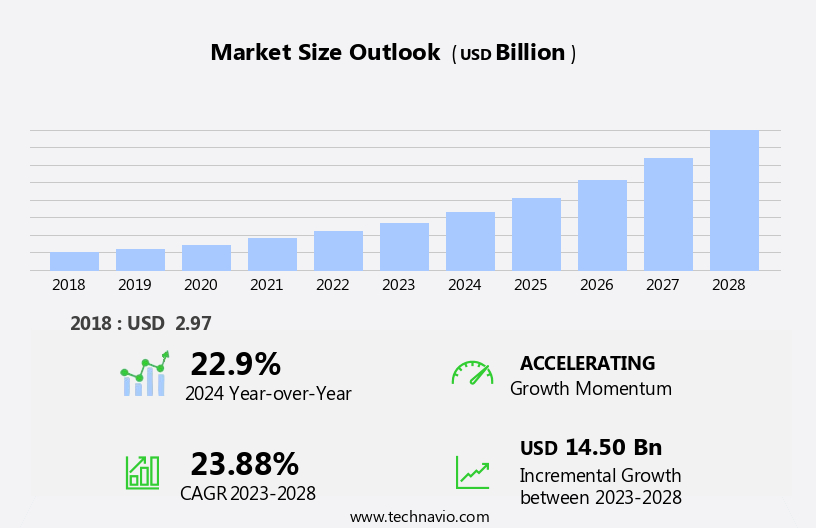
The enterprise mobility services market size is forecast to increase by USD 14.50 billion at a CAGR of 23.88% between 2023 and 2028.
- The market is experiencing significant growth due to the increasing use of mobile devices in businesses to enhance productivity and efficiency. The adoption of smartphone technologies is a strategic response to the evolving work landscape, enabling remote work and real-time collaboration. However, this trend comes with challenges. Privacy and compliance risks are major concerns for enterprises implementing mobility services. Ensuring data security and adherence to regulatory frameworks are essential to mitigate potential risks and maintain trust with customers and stakeholders.
- Companies seeking to capitalize on the market opportunities and navigate challenges effectively must prioritize robust security measures and compliance strategies. By addressing these concerns, enterprises can reap the benefits of enterprise mobility services, including increased agility, improved employee engagement, and enhanced customer experience.
What will be the Size of the Enterprise Mobility Services Market during the forecast period?

Request Free Sample
- The market continues to evolve, driven by the increasing adoption of mobile technologies in businesses across various sectors. Mobile data security remains a top priority, with encryption solutions safeguarding sensitive information during transmission and storage. Mobile device authentication and management ensure secure access to corporate networks and applications. Mobile collaboration tools facilitate remote workforces, enhancing employee productivity and enabling seamless communication. Mobile content and application management enable organizations to control and secure digital assets. Mobile network optimization and reporting provide insights into network performance and usage patterns. Mobile threat defense solutions protect against cyber attacks, while mobile device updates ensure the latest security patches are applied.
- Data loss prevention solutions safeguard against accidental or intentional data leaks. Field workforces benefit from mobile productivity tools and mobile device troubleshooting capabilities. Mobile network security solutions protect against external threats. Mobile analytics provide valuable insights into business operations and user behavior. Enterprise mobility services continue to unfold, with new patterns and applications emerging as businesses adapt to the evolving mobile landscape.
How is this Enterprise Mobility Services Industry segmented?
The enterprise mobility services industry research report provides comprehensive data (region-wise segment analysis), with forecasts and estimates in "USD billion" for the period 2024-2028, as well as historical data from 2018-2022 for the following segments.
- Application
- Large enterprises
- Small and medium sized enterprises
- End-user
- BFSI
- Retail and e-commerce
- IT and telecom
- Healthcare and life sciences
- Government and others
- Deployment
- Cloud
- On-premises
- On-premises
- Component
- Service Type
- Mobile Device Management
- Mobile Application Management
- Mobile Security
- Consulting
- Geography
- North America
- Europe
- France
- Germany
- Italy
- Spain
- The Netherlands
- UK
- Middle East and Africa
- APAC
- China
- India
- Japan
- South Korea
- South America
- Rest of World (ROW)
By Application Insights
The large enterprises segment is estimated to witness significant growth during the forecast period.
In today's business landscape, large enterprises rely on enterprise mobility services to foster communication, collaboration, and productivity among their remote workforce. With the increasing use of mobile devices and the shift towards remote work arrangements, these services enable employees to securely access corporate resources, applications, and data from their smartphones or tablets, irrespective of their locations. This flexibility empowers employees to attend virtual meetings, collaborate in real time, and work efficiently from anywhere, leading to enhanced business agility and responsiveness. Enterprise mobility services encompass various solutions such as mobile device authentication, mobile device management, mobile content management, mobile application management, mobile data analytics, and mobile security.
Mobile applications for enterprise resource planning (ERP), customer relationship management (CRM), and business intelligence enable employees to access critical information, analyze data, and make informed decisions on the go, thereby accelerating business workflows and driving innovation. Moreover, mobile device updates, mobile data encryption, mobile data backup, mobile app authentication, mobile access management, mobile identity management, mobile device provisioning, mobile app security, mobile network optimization, mobile reporting, mobile threat defense, mobile data management, data loss prevention, and mobile device support are integral components of enterprise mobility services. These solutions ensure the security and privacy of corporate data, maintain mobile device performance, and provide seamless user experiences.
Cloud-based mobility and on-premises mobility options cater to the diverse needs of large enterprises, while hybrid mobility enables a smooth transition between these two environments. Mobile network management and mobile network security solutions optimize network performance and protect against potential threats. Mobile device troubleshooting and mobile app updates ensure uninterrupted access to enterprise applications and services. In essence, enterprise mobility services are a game-changer for large enterprises, enabling them to leverage the power of mobile technology to enhance productivity, streamline business processes, and gain a competitive edge.

Request Free Sample
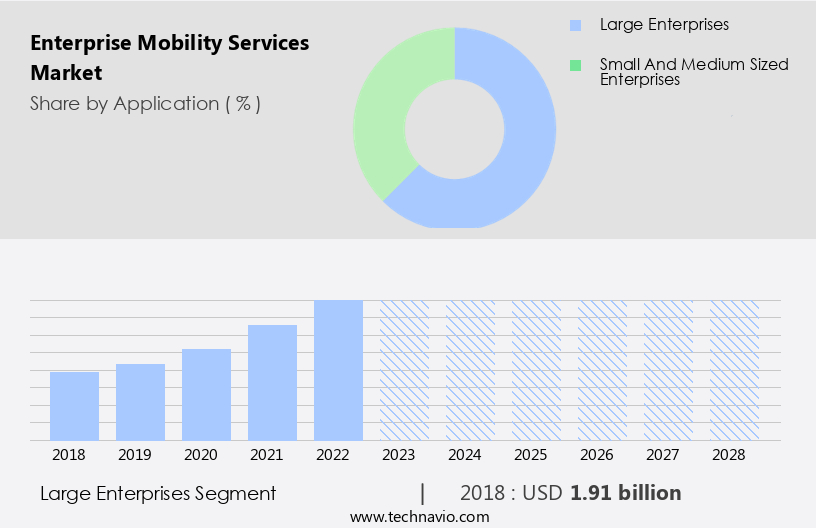
The Large enterprises segment was valued at USD 1.91 billion in 2018 and showed a gradual increase during the forecast period.
Regional Analysis
North America is estimated to contribute 31% to the growth of the global market during the forecast period.Technavio's analysts have elaborately explained the regional trends and drivers that shape the market during the forecast period.

Request Free Sample
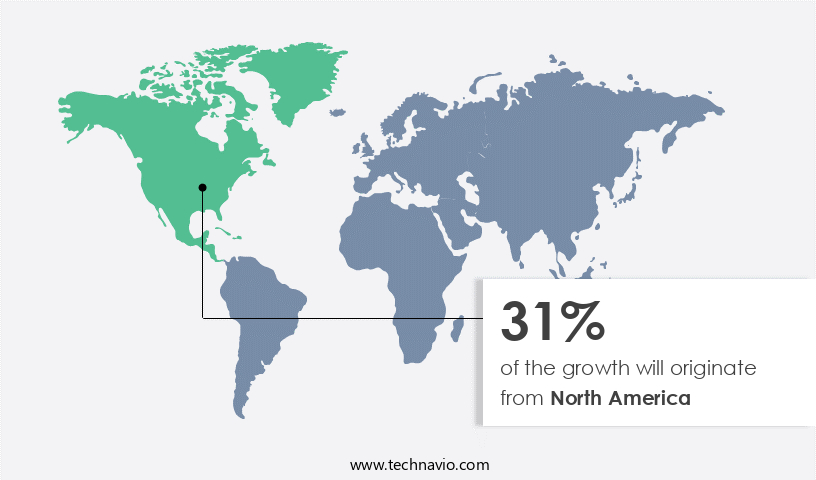
The market is experiencing significant growth, particularly in North America, where large IT and telecom companies and technological advances, including digitization and smartphone penetration, are driving adoption. Mobile data security, collaboration, device authentication, management, content management, application management, data analytics, and network optimization are integral components of enterprise mobility services, catering to the needs of remote and field workforces. Enterprise mobility management encompasses these services, enabling employee productivity and data security for enterprise apps and mobile devices. Mobile app authentication, encryption, access management, and provisioning ensure secure application distribution and updates.
Hybrid mobility solutions enable seamless integration of on-premises and cloud-based mobility, while mobile network management and security address the challenges of mobile connectivity and data protection. Mobile reporting, threat defense, data management, and analytics provide valuable insights for businesses. The market's evolution reflects the increasing importance of mobile technologies in enterprise operations.
Market Dynamics
Our researchers analyzed the data with 2023 as the base year, along with the key drivers, trends, and challenges. A holistic analysis of drivers will help companies refine their marketing strategies to gain a competitive advantage.
Mobile access and identity management secure user access to enterprise applications and data. Mobile device provisioning streamlines the deployment of new devices and applications. Mobile app security and development are crucial, with encryption and authentication ensuring data privacy and application integrity. Cloud-based mobility and on-premises solutions offer flexibility and control, respectively. Mobile user experience and training are essential for successful adoption and utilization of enterprise mobility services. Hybrid mobility solutions offer a balance between on-premises and cloud-based offerings. Mobile app distribution and updates ensure employees have access to the latest tools and features. Mobile network management and support ensure optimal network performance and user experience.
What are the key market drivers leading to the rise in the adoption of Enterprise Mobility Services Industry?
- The escalating prevalence of mobile devices in businesses serves as the primary catalyst for market growth. The market experiences continuous expansion due to the increasing reliance on mobile devices for business operations. With the widespread use of smartphones, tablets, and other mobile devices, employees demand the ability to work remotely and access corporate resources seamlessly. Enterprise mobility services offer the necessary infrastructure and tools to enable this level of mobility, ensuring productivity regardless of location. Mobile network security is a critical component of enterprise mobility services, protecting sensitive business data from cyber threats. Cloud-based mobility allows for easy access to business applications and data from anywhere, while mobile app updates ensure that employees have the latest tools at their disposal.
- On-premises mobility provides an alternative for businesses that prefer to maintain control over their data, while mobile device support ensures that all devices are optimally functioning. Moreover, mobile analytics enable businesses to gain valuable insights from mobile data, enhancing decision-making capabilities. Mobile device training equips employees with the necessary skills to effectively use mobile devices for business purposes, while mobile app development allows businesses to create custom applications tailored to their unique needs. Data loss prevention is another essential feature of enterprise mobility services, safeguarding against accidental or intentional data breaches. In conclusion, the market is driven by the need to accommodate the mobile-centric work landscape and provide employees with the tools they need to remain productive on the go.
- The market encompasses a range of services, from mobile network security and analytics to mobile app development and device support, ensuring that businesses can effectively leverage mobile technology to drive growth and innovation.
What are the market trends shaping the Enterprise Mobility Services Industry?
- The increasing need for workforce productivity and efficiency among enterprises represents a significant market trend. This demand is driven by the pursuit of maximizing output and minimizing costs in business operations.
- In today's business landscape, the need for flexibility and productivity is paramount. Enterprise mobility services have emerged as a critical solution to meet these demands, enabling employees to work efficiently from anywhere, at any time, using their mobile devices. The global market for enterprise mobility services is experiencing significant growth due to the increasing requirement for secure and seamless access to business-critical data and applications. Mobile data security, device authentication, management, content management, application management, and analytics are essential components of enterprise mobility services. These solutions enable organizations to ensure the security of their data, manage and update mobile devices, and control access to enterprise apps.
- The ability to authenticate mobile apps adds an additional layer of security, while mobile device updates ensure that devices are running the latest software. The remote workforce trend is another significant factor driving the growth of enterprise mobility services. With more employees working outside of traditional office environments, the need for secure and efficient mobile solutions is becoming increasingly important. Enterprise mobility management (EMM) solutions provide organizations with the tools they need to manage and secure mobile devices and applications, ensuring business continuity and productivity. In conclusion, The market is experiencing significant growth due to the increasing need for productivity, flexibility, and security in today's business environment.
- Mobile devices have become essential tools for employees to stay connected and productive outside of traditional office environments, and enterprise mobility services provide organizations with the solutions they need to manage and secure these devices and the data they access.
What challenges does the Enterprise Mobility Services Industry face during its growth?
- Enterprise mobility services face significant challenges from privacy and compliance risks, which are crucial concerns threatening industry growth. These issues necessitate rigorous attention and adherence to regulations to mitigate potential risks and ensure secure implementation and usage of these services.
- In The market, privacy and compliance are paramount concerns. With the increasing adoption of enterprise mobility services to manage and secure mobile ecosystems, organizations must ensure they comply with data protection regulations and industry-specific compliance requirements. These services handle sensitive information, such as employee data, device information, and corporate data accessed through mobile devices. Organizations operating in diverse jurisdictions are subject to various data protection regulations, including the European Union's General Data Protection Regulation (GDPR) and the California Consumer Privacy Act (CCPA). Additionally, sector-specific regulations, like the Health Insurance Portability and Accountability Act (HIPAA) for the healthcare industry, must be adhered to.
- Enterprise mobility services encompass mobile data encryption, mobile device encryption, mobile data backup, mobile security, mobile app encryption, mobile access management, mobile identity management, mobile device provisioning, mobile app security, mobile network optimization, mobile reporting, and mobile threat defense. Implementing these services helps organizations maintain data security, protect user privacy, and ensure regulatory compliance. Privacy and compliance are essential aspects of enterprise mobility services, and organizations must prioritize these considerations to safeguard their mobile ecosystems and mitigate potential risks.
Exclusive Customer Landscape
The enterprise mobility services market forecasting report includes the adoption lifecycle of the market, covering from the innovator's stage to the laggard's stage. It focuses on adoption rates in different regions based on penetration. Furthermore, the enterprise mobility services market report also includes key purchase criteria and drivers of price sensitivity to help companies evaluate and develop their market growth analysis strategies.
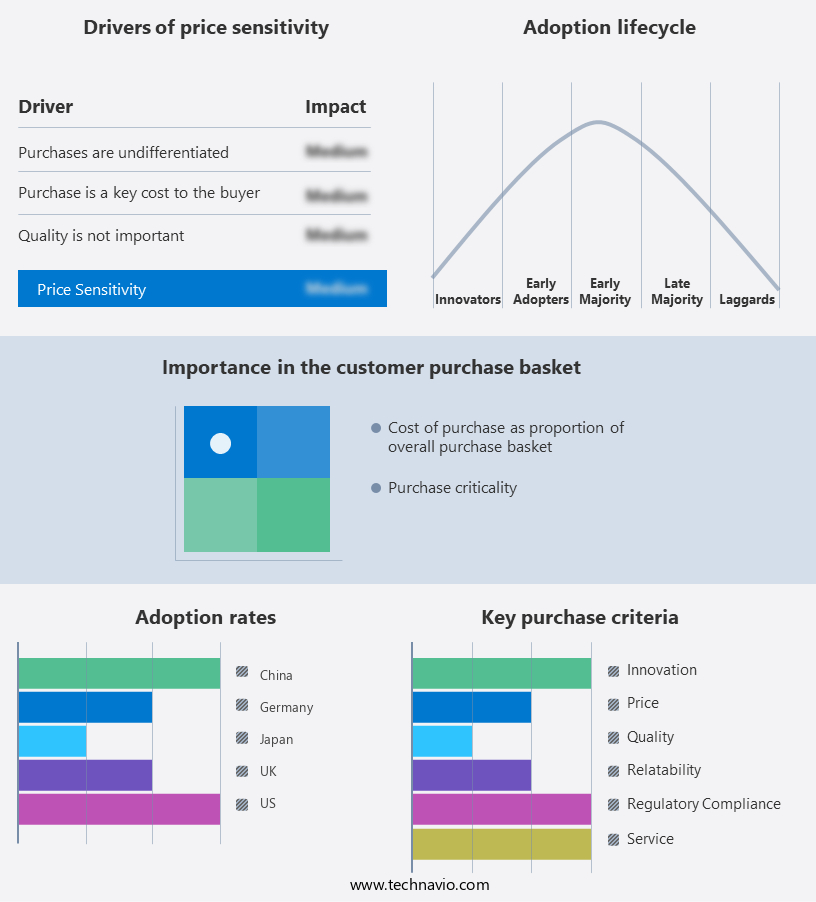
Customer Landscape
Key Companies & Market Insights
Companies are implementing various strategies, such as strategic alliances, enterprise mobility services market forecast, partnerships, mergers and acquisitions, geographical expansion, and product/service launches, to enhance their presence in the industry.
IBM Corporation - The company delivers enterprise mobility solutions via platforms including BlackBerry Control, Proxy, UEM Cloud, and 2FA. These offerings enable businesses to manage and secure their mobile devices and applications, ensuring productivity and data protection. BlackBerry Control offers remote device management, while Proxy ensures secure access to corporate networks. UEM Cloud facilitates unified endpoint management, and 2FA strengthens authentication processes. By utilizing these platforms, organizations can effectively manage their mobile environments and maintain a secure digital workspace.
The industry research and growth report includes detailed analyses of the competitive landscape of the market and information about key companies, including:
- IBM Corporation
- Microsoft Corporation
- Cisco Systems Inc.
- VMware Inc.
- Citrix Systems Inc.
- MobileIron Inc.
- SAP SE
- Atos SE
- Capgemini SE
- Computacenter plc
- Fujitsu Limited
- NTT Data Corporation
- Toshiba Digital Solutions Corporation
- NEC Corporation
- Huawei Technologies Co., Ltd.
- ZTE Corporation
- Lenovo Group Ltd.
- Xiaomi Corporation
- Oppo Mobile Telecommunications Corp.
- TietoEVRY Corporation
Qualitative and quantitative analysis of companies has been conducted to help clients understand the wider business environment as well as the strengths and weaknesses of key industry players. Data is qualitatively analyzed to categorize companies as pure play, category-focused, industry-focused, and diversified; it is quantitatively analyzed to categorize companies as dominant, leading, strong, tentative, and weak.
Recent Development and News in Enterprise Mobility Services Market
- In February 2024, IBM announced the launch of its new Watson Workspace Pro, an enterprise mobility solution that integrates AI capabilities to enhance productivity and collaboration among remote teams. This offering aims to streamline business processes and improve decision-making through advanced analytics and automation (IBM Press Release, 2024).
- In October 2024, Microsoft and Google formed a strategic partnership to expand their enterprise mobility services. Microsoft Teams users gained the ability to access Google Workspace apps directly within their Teams interface, while Google Workspace users could use Teams for communication and collaboration. This collaboration aimed to provide a more integrated and seamless experience for businesses using both platforms (Microsoft Press Release, 2024).
- In March 2025, VMware completed the acquisition of Carbon Black, a leading cybersecurity firm, for approximately USD2.1 billion. This acquisition significantly strengthened VMware's security offerings in the enterprise mobility space, providing advanced threat detection and response capabilities to its customers (VMware Press Release, 2025).
Research Analyst Overview
The market is experiencing significant growth, driven by the increasing adoption of mobile devices in the business world. With cloud computing at the forefront, mobile payments and digital transformation are becoming essential components of enterprise mobility. Windows Mobile and other mobile operating systems enable flexible work arrangements, enhancing customer experience and operational efficiency. The Internet of Things (IoT) and digital workplace integration are key trends, with API management and machine learning facilitating mobility strategy. Enterprise agility is crucial in today's business landscape, necessitating biometric authentication and multi-factor authentication for secure remote work.
Big data and business intelligence are transforming enterprise mobility, providing valuable insights to drive strategic decision-making. Mobile adoption continues to grow, with mobility policy shaping the future of the digital workplace.
Dive into Technavio's robust research methodology, blending expert interviews, extensive data synthesis, and validated models for unparalleled Enterprise Mobility Services Market insights. See full methodology.
Market Scope
|
Report Coverage
|
Details
|
Page number
|
179
|
Base year
|
2023
|
Historic period
|
2018-2022 |
Forecast period
|
2024-2028
|
Growth momentum & CAGR
|
Accelerate at a CAGR of 23.88%
|
Market growth 2024-2028
|
USD 14.50 billion
|
Market structure
|
Fragmented
|
YoY growth 2023-2024(%)
|
22.9
|
Key countries
|
US, China, Germany, Canada, India, South Korea, France, Japan, Italy, Brazil, UAE, UK, Spain, Mexico, and The Netherlands
|
Competitive landscape
|
Leading Companies, Market Positioning of Companies, Competitive Strategies, and Industry Risks
|
Request Free Sample
What are the Key Data Covered in this Enterprise Mobility Services Market Research and Growth Report?
- CAGR of the Enterprise Mobility Services industry during the forecast period
- Detailed information on factors that will drive the growth and forecasting between 2024 and 2028
- Precise estimation of the size of the market and its contribution of the industry in focus to the parent market
- Accurate predictions about upcoming growth and trends and changes in consumer behaviour
- Growth of the market across North America, Europe, APAC, South America, and Middle East and Africa
- Thorough analysis of the market's competitive landscape and detailed information about companies
- Comprehensive analysis of factors that will challenge the enterprise mobility services market growth of industry companies
We can help! Our analysts can customize this enterprise mobility services market research report to meet your requirements.
Get in touch
1 Executive Summary
- 1.1 Market overview
- Exhibit 01: Executive Summary – Chart on Market Overview
- Exhibit 02: Executive Summary – Data Table on Market Overview
- Exhibit 03: Executive Summary – Chart on Global Market Characteristics
- Exhibit 04: Executive Summary – Chart on Market by Geography
- Exhibit 05: Executive Summary – Chart on Market Segmentation by Application
- Exhibit 06: Executive Summary – Chart on Market Segmentation by End-user
- Exhibit 07: Executive Summary – Chart on Incremental Growth
- Exhibit 08: Executive Summary – Data Table on Incremental Growth
- Exhibit 09: Executive Summary – Chart on Vendor Market Positioning
2 Market Landscape
- 2.1 Market ecosystem
- Exhibit 10: Parent market
- Exhibit 11: Market Characteristics
3 Market Sizing
- 3.1 Market definition
- Exhibit 12: Offerings of vendors included in the market definition
- 3.2 Market segment analysis
- Exhibit 13: Market segments
- 3.4 Market outlook: Forecast for 2023-2028
- Exhibit 14: Chart on Global - Market size and forecast 2023-2028 ($ million)
- Exhibit 15: Data Table on Global - Market size and forecast 2023-2028 ($ million)
- Exhibit 16: Chart on Global Market: Year-over-year growth 2023-2028 (%)
- Exhibit 17: Data Table on Global Market: Year-over-year growth 2023-2028 (%)
4 Historic Market Size
- 4.1 Global enterprise mobility services market 2018 - 2022
- Exhibit 18: Historic Market Size – Data Table on global enterprise mobility services market 2018 - 2022 ($ million)
- 4.2 Application Segment Analysis 2018 - 2022
- Exhibit 19: Historic Market Size – Application Segment 2018 - 2022 ($ million)
- 4.3 End-user Segment Analysis 2018 - 2022
- Exhibit 20: Historic Market Size – End-user Segment 2018 - 2022 ($ million)
- 4.4 Geography Segment Analysis 2018 - 2022
- Exhibit 21: Historic Market Size – Geography Segment 2018 - 2022 ($ million)
- 4.5 Country Segment Analysis 2018 - 2022
- Exhibit 22: Historic Market Size – Country Segment 2018 - 2022 ($ million)
5 Five Forces Analysis
- 5.1 Five forces summary
- Exhibit 23: Five forces analysis - Comparison between 2023 and 2028
- 5.2 Bargaining power of buyers
- Exhibit 24: Chart on Bargaining power of buyers – Impact of key factors 2023 and 2028
- 5.3 Bargaining power of suppliers
- Exhibit 25: Bargaining power of suppliers – Impact of key factors in 2023 and 2028
- 5.4 Threat of new entrants
- Exhibit 26: Threat of new entrants – Impact of key factors in 2023 and 2028
- 5.5 Threat of substitutes
- Exhibit 27: Threat of substitutes – Impact of key factors in 2023 and 2028
- 5.6 Threat of rivalry
- Exhibit 28: Threat of rivalry – Impact of key factors in 2023 and 2028
- 5.7 Market condition
- Exhibit 29: Chart on Market condition - Five forces 2023 and 2028
6 Market Segmentation by Application
- 6.1 Market segments
- Chart on Application - Market share (2023-2028) (%)
- Data Table on Application - Market share (2023-2028) (%)
- 6.2 Comparison by Application
- Chart on Comparison by Application
- Data Table on Comparison by Application
- 6.3 Large enterprises - Market size and forecast (2023-2028)
- Chart on Large enterprises - Market size and forecast (2023-2028) ($ million)
- Data Table on Large enterprises - Market size and forecast (2023-2028) ($ million)
- Chart on Large enterprises - Year-over-year growth (2023-2028) (%)
- Data Table on Large enterprises - Year-over-year growth (2023-2028) (%)
- 6.4 Small and medium sized enterprises - Market size and forecast (2023-2028)
- Chart on Small and medium sized enterprises - Market size and forecast (2023-2028) ($ million)
- Data Table on Small and medium sized enterprises - Market size and forecast (2023-2028) ($ million)
- Chart on Small and medium sized enterprises - Year-over-year growth (2023-2028) (%)
- Data Table on Small and medium sized enterprises - Year-over-year growth (2023-2028) (%)
- 6.5 Market opportunity by Application
- Market opportunity by Application ($ million)
- Data Table on Market opportunity by Application ($ million)
7 Market Segmentation by End-user
- 7.1 Market segments
- Chart on End-user - Market share (2023-2028) (%)
- Data Table on End-user - Market share (2023-2028) (%)
- 7.2 Comparison by End-user
- Chart on Comparison by End-user
- Data Table on Comparison by End-user
- 7.3 BFSI - Market size and forecast (2023-2028)
- Chart on BFSI - Market size and forecast (2023-2028) ($ million)
- Data Table on BFSI - Market size and forecast (2023-2028) ($ million)
- Chart on BFSI - Year-over-year growth (2023-2028) (%)
- Data Table on BFSI - Year-over-year growth (2023-2028) (%)
- 7.4 Retail and e-commerce - Market size and forecast (2023-2028)
- Chart on Retail and e-commerce - Market size and forecast (2023-2028) ($ million)
- Data Table on Retail and e-commerce - Market size and forecast (2023-2028) ($ million)
- Chart on Retail and e-commerce - Year-over-year growth (2023-2028) (%)
- Data Table on Retail and e-commerce - Year-over-year growth (2023-2028) (%)
- 7.5 IT and telecom - Market size and forecast (2023-2028)
- Chart on IT and telecom - Market size and forecast (2023-2028) ($ million)
- Data Table on IT and telecom - Market size and forecast (2023-2028) ($ million)
- Chart on IT and telecom - Year-over-year growth (2023-2028) (%)
- Data Table on IT and telecom - Year-over-year growth (2023-2028) (%)
- 7.6 Healthcare and life sciences - Market size and forecast (2023-2028)
- Chart on Healthcare and life sciences - Market size and forecast (2023-2028) ($ million)
- Data Table on Healthcare and life sciences - Market size and forecast (2023-2028) ($ million)
- Chart on Healthcare and life sciences - Year-over-year growth (2023-2028) (%)
- Data Table on Healthcare and life sciences - Year-over-year growth (2023-2028) (%)
- 7.7 Government and others - Market size and forecast (2023-2028)
- Chart on Government and others - Market size and forecast (2023-2028) ($ million)
- Data Table on Government and others - Market size and forecast (2023-2028) ($ million)
- Chart on Government and others - Year-over-year growth (2023-2028) (%)
- Data Table on Government and others - Year-over-year growth (2023-2028) (%)
- 7.8 Market opportunity by End-user
- Market opportunity by End-user ($ million)
- Data Table on Market opportunity by End-user ($ million)
8 Market Segmentation by Deployment
- 8.1 Market segments
- Chart on Deployment - Market share (2023-2028) (%)
- Data Table on Deployment - Market share (2023-2028) (%)
- 8.2 Comparison by Deployment
- Chart on Comparison by Deployment
- Data Table on Comparison by Deployment
- 8.3 Cloud - Market size and forecast (2023-2028)
- Chart on Cloud - Market size and forecast (2023-2028) ($ million)
- Data Table on Cloud - Market size and forecast (2023-2028) ($ million)
- Chart on Cloud - Year-over-year growth (2023-2028) (%)
- Data Table on Cloud - Year-over-year growth (2023-2028) (%)
- 8.4 On-premises - Market size and forecast (2023-2028)
- Chart on On-premises - Market size and forecast (2023-2028) ($ million)
- Data Table on On-premises - Market size and forecast (2023-2028) ($ million)
- Chart on On-premises - Year-over-year growth (2023-2028) (%)
- Data Table on On-premises - Year-over-year growth (2023-2028) (%)
- 8.5 Market opportunity by Deployment
- Market opportunity by Deployment ($ million)
- Data Table on Market opportunity by Deployment ($ million)
9 Market Segmentation by Component
- 9.1 Market segments
- Chart on Component - Market share (2023-2028) (%)
- Data Table on Component - Market share (2023-2028) (%)
- 9.2 Comparison by Component
- Chart on Comparison by Component
- Data Table on Comparison by Component
- 9.3 Solution - Market size and forecast (2023-2028)
- Chart on Solution - Market size and forecast (2023-2028) ($ million)
- Data Table on Solution - Market size and forecast (2023-2028) ($ million)
- Chart on Solution - Year-over-year growth (2023-2028) (%)
- Data Table on Solution - Year-over-year growth (2023-2028) (%)
- 9.4 Services - Market size and forecast (2023-2028)
- Chart on Services - Market size and forecast (2023-2028) ($ million)
- Data Table on Services - Market size and forecast (2023-2028) ($ million)
- Chart on Services - Year-over-year growth (2023-2028) (%)
- Data Table on Services - Year-over-year growth (2023-2028) (%)
- 9.5 Market opportunity by Component
- Market opportunity by Component ($ million)
- Data Table on Market opportunity by Component ($ million)
10 Market Segmentation by Service Type
- 10.1 Market segments
- Chart on Service Type - Market share (2023-2028) (%)
- Data Table on Service Type - Market share (2023-2028) (%)
- 10.2 Comparison by Service Type
- Chart on Comparison by Service Type
- Data Table on Comparison by Service Type
- 10.3 Mobile Device Management - Market size and forecast (2023-2028)
- Chart on Mobile Device Management - Market size and forecast (2023-2028) ($ million)
- Data Table on Mobile Device Management - Market size and forecast (2023-2028) ($ million)
- Chart on Mobile Device Management - Year-over-year growth (2023-2028) (%)
- Data Table on Mobile Device Management - Year-over-year growth (2023-2028) (%)
- 10.4 Mobile Application Management - Market size and forecast (2023-2028)
- Chart on Mobile Application Management - Market size and forecast (2023-2028) ($ million)
- Data Table on Mobile Application Management - Market size and forecast (2023-2028) ($ million)
- Chart on Mobile Application Management - Year-over-year growth (2023-2028) (%)
- Data Table on Mobile Application Management - Year-over-year growth (2023-2028) (%)
- 10.5 Mobile Security - Market size and forecast (2023-2028)
- Chart on Mobile Security - Market size and forecast (2023-2028) ($ million)
- Data Table on Mobile Security - Market size and forecast (2023-2028) ($ million)
- Chart on Mobile Security - Year-over-year growth (2023-2028) (%)
- Data Table on Mobile Security - Year-over-year growth (2023-2028) (%)
- 10.6 Consulting - Market size and forecast (2023-2028)
- Chart on Consulting - Market size and forecast (2023-2028) ($ million)
- Data Table on Consulting - Market size and forecast (2023-2028) ($ million)
- Chart on Consulting - Year-over-year growth (2023-2028) (%)
- Data Table on Consulting - Year-over-year growth (2023-2028) (%)
- 10.7 Market opportunity by Service Type
- Market opportunity by Service Type ($ million)
- Data Table on Market opportunity by Service Type ($ million)
8 Customer Landscape
- 8.1 Customer landscape overview
- Exhibit 70: Analysis of price sensitivity, lifecycle, customer purchase basket, adoption rates, and purchase criteria
9 Geographic Landscape
- 9.1 Geographic segmentation
- Exhibit 71: Chart on Market share by geography 2023-2028 (%)
- Exhibit 72: Data Table on Market share by geography 2023-2028 (%)
- 9.2 Geographic comparison
- Exhibit 73: Chart on Geographic comparison
- Exhibit 74: Data Table on Geographic comparison
- 9.3 North America - Market size and forecast 2023-2028
- Exhibit 75: Chart on North America - Market size and forecast 2023-2028 ($ million)
- Exhibit 76: Data Table on North America - Market size and forecast 2023-2028 ($ million)
- Exhibit 77: Chart on North America - Year-over-year growth 2023-2028 (%)
- Exhibit 78: Data Table on North America - Year-over-year growth 2023-2028 (%)
- 9.4 Europe - Market size and forecast 2023-2028
- Exhibit 79: Chart on Europe - Market size and forecast 2023-2028 ($ million)
- Exhibit 80: Data Table on Europe - Market size and forecast 2023-2028 ($ million)
- Exhibit 81: Chart on Europe - Year-over-year growth 2023-2028 (%)
- Exhibit 82: Data Table on Europe - Year-over-year growth 2023-2028 (%)
- 9.5 APAC - Market size and forecast 2023-2028
- Exhibit 83: Chart on APAC - Market size and forecast 2023-2028 ($ million)
- Exhibit 84: Data Table on APAC - Market size and forecast 2023-2028 ($ million)
- Exhibit 85: Chart on APAC - Year-over-year growth 2023-2028 (%)
- Exhibit 86: Data Table on APAC - Year-over-year growth 2023-2028 (%)
- 9.6 South America - Market size and forecast 2023-2028
- Exhibit 87: Chart on South America - Market size and forecast 2023-2028 ($ million)
- Exhibit 88: Data Table on South America - Market size and forecast 2023-2028 ($ million)
- Exhibit 89: Chart on South America - Year-over-year growth 2023-2028 (%)
- Exhibit 90: Data Table on South America - Year-over-year growth 2023-2028 (%)
- 9.7 Middle East and Africa - Market size and forecast 2023-2028
- Exhibit 91: Chart on Middle East and Africa - Market size and forecast 2023-2028 ($ million)
- Exhibit 92: Data Table on Middle East and Africa - Market size and forecast 2023-2028 ($ million)
- Exhibit 93: Chart on Middle East and Africa - Year-over-year growth 2023-2028 (%)
- Exhibit 94: Data Table on Middle East and Africa - Year-over-year growth 2023-2028 (%)
- 9.8 US - Market size and forecast 2023-2028
- Exhibit 95: Chart on US - Market size and forecast 2023-2028 ($ million)
- Exhibit 96: Data Table on US - Market size and forecast 2023-2028 ($ million)
- Exhibit 97: Chart on US - Year-over-year growth 2023-2028 (%)
- Exhibit 98: Data Table on US - Year-over-year growth 2023-2028 (%)
- 9.9 China - Market size and forecast 2023-2028
- Exhibit 99: Chart on China - Market size and forecast 2023-2028 ($ million)
- Exhibit 100: Data Table on China - Market size and forecast 2023-2028 ($ million)
- Exhibit 101: Chart on China - Year-over-year growth 2023-2028 (%)
- Exhibit 102: Data Table on China - Year-over-year growth 2023-2028 (%)
- 9.10 UK - Market size and forecast 2023-2028
- Exhibit 103: Chart on UK - Market size and forecast 2023-2028 ($ million)
- Exhibit 104: Data Table on UK - Market size and forecast 2023-2028 ($ million)
- Exhibit 105: Chart on UK - Year-over-year growth 2023-2028 (%)
- Exhibit 106: Data Table on UK - Year-over-year growth 2023-2028 (%)
- 9.11 Germany - Market size and forecast 2023-2028
- Exhibit 107: Chart on Germany - Market size and forecast 2023-2028 ($ million)
- Exhibit 108: Data Table on Germany - Market size and forecast 2023-2028 ($ million)
- Exhibit 109: Chart on Germany - Year-over-year growth 2023-2028 (%)
- Exhibit 110: Data Table on Germany - Year-over-year growth 2023-2028 (%)
- 9.12 Japan - Market size and forecast 2023-2028
- Exhibit 111: Chart on Japan - Market size and forecast 2023-2028 ($ million)
- Exhibit 112: Data Table on Japan - Market size and forecast 2023-2028 ($ million)
- Exhibit 113: Chart on Japan - Year-over-year growth 2023-2028 (%)
- Exhibit 114: Data Table on Japan - Year-over-year growth 2023-2028 (%)
- 9.13 Market opportunity by geography
- Exhibit 115: Market opportunity by geography ($ million)
- Exhibit 116: Data Tables on Market opportunity by geography ($ million)
- 12.14 Canada - Market size and forecast (2023-2028)
- Chart on Canada - Market size and forecast (2023-2028) ($ million)
- Data Table on Canada - Market size and forecast (2023-2028) ($ million)
- Chart on Canada - Year-over-year growth (2023-2028) (%)
- Data Table on Canada - Year-over-year growth (2023-2028) (%)
- 12.15 India - Market size and forecast (2023-2028)
- Chart on India - Market size and forecast (2023-2028) ($ million)
- Data Table on India - Market size and forecast (2023-2028) ($ million)
- Chart on India - Year-over-year growth (2023-2028) (%)
- Data Table on India - Year-over-year growth (2023-2028) (%)
- 12.16 South Korea - Market size and forecast (2023-2028)
- Chart on South Korea - Market size and forecast (2023-2028) ($ million)
- Data Table on South Korea - Market size and forecast (2023-2028) ($ million)
- Chart on South Korea - Year-over-year growth (2023-2028) (%)
- Data Table on South Korea - Year-over-year growth (2023-2028) (%)
- 12.17 France - Market size and forecast (2023-2028)
- Chart on France - Market size and forecast (2023-2028) ($ million)
- Data Table on France - Market size and forecast (2023-2028) ($ million)
- Chart on France - Year-over-year growth (2023-2028) (%)
- Data Table on France - Year-over-year growth (2023-2028) (%)
- 12.18 Italy - Market size and forecast (2023-2028)
- Chart on Italy - Market size and forecast (2023-2028) ($ million)
- Data Table on Italy - Market size and forecast (2023-2028) ($ million)
- Chart on Italy - Year-over-year growth (2023-2028) (%)
- Data Table on Italy - Year-over-year growth (2023-2028) (%)
- 12.19 Brazil - Market size and forecast (2023-2028)
- Chart on Brazil - Market size and forecast (2023-2028) ($ million)
- Data Table on Brazil - Market size and forecast (2023-2028) ($ million)
- Chart on Brazil - Year-over-year growth (2023-2028) (%)
- Data Table on Brazil - Year-over-year growth (2023-2028) (%)
- 12.20 UAE - Market size and forecast (2023-2028)
- Chart on UAE - Market size and forecast (2023-2028) ($ million)
- Data Table on UAE - Market size and forecast (2023-2028) ($ million)
- Chart on UAE - Year-over-year growth (2023-2028) (%)
- Data Table on UAE - Year-over-year growth (2023-2028) (%)
- 12.21 Spain - Market size and forecast (2023-2028)
- Chart on Spain - Market size and forecast (2023-2028) ($ million)
- Data Table on Spain - Market size and forecast (2023-2028) ($ million)
- Chart on Spain - Year-over-year growth (2023-2028) (%)
- Data Table on Spain - Year-over-year growth (2023-2028) (%)
- 12.22 Mexico - Market size and forecast (2023-2028)
- Chart on Mexico - Market size and forecast (2023-2028) ($ million)
- Data Table on Mexico - Market size and forecast (2023-2028) ($ million)
- Chart on Mexico - Year-over-year growth (2023-2028) (%)
- Data Table on Mexico - Year-over-year growth (2023-2028) (%)
- 12.23 The Netherlands - Market size and forecast (2023-2028)
- Chart on The Netherlands - Market size and forecast (2023-2028) ($ million)
- Data Table on The Netherlands - Market size and forecast (2023-2028) ($ million)
- Chart on The Netherlands - Year-over-year growth (2023-2028) (%)
- Data Table on The Netherlands - Year-over-year growth (2023-2028) (%)
- 12.24 Rest of World (ROW) - Market size and forecast (2023-2028)
- Chart on Rest of World (ROW) - Market size and forecast (2023-2028) ($ million)
- Data Table on Rest of World (ROW) - Market size and forecast (2023-2028) ($ million)
- Chart on Rest of World (ROW) - Year-over-year growth (2023-2028) (%)
- Data Table on Rest of World (ROW) - Year-over-year growth (2023-2028) (%)
10 Drivers, Challenges, and Trends
- 10.3 Impact of drivers and challenges
- Exhibit 117: Impact of drivers and challenges in 2023 and 2028
11 Vendor Landscape
- 11.2 Vendor landscape
- Exhibit 118: Overview on Criticality of inputs and Factors of differentiation
- 11.3 Landscape disruption
- Exhibit 119: Overview on factors of disruption
- 11.4 Industry risks
- Exhibit 120: Impact of key risks on business
15 Competitive Analysis
- 15.2 Market positioning of companies
- Matrix on companies position and classification
- 15.3 IBM Corporation
- IBM Corporation - Overview
- IBM Corporation - Product / Service
- IBM Corporation - Key offerings
- 15.4 Microsoft Corporation
- Microsoft Corporation - Overview
- Microsoft Corporation - Product / Service
- Microsoft Corporation - Key offerings
- 15.5 Cisco Systems Inc.
- Cisco Systems Inc. - Overview
- Cisco Systems Inc. - Product / Service
- Cisco Systems Inc. - Key offerings
- 15.6 VMware Inc.
- VMware Inc. - Overview
- VMware Inc. - Product / Service
- VMware Inc. - Key offerings
- 15.7 Citrix Systems Inc.
- Citrix Systems Inc. - Overview
- Citrix Systems Inc. - Product / Service
- Citrix Systems Inc. - Key offerings
- 15.8 MobileIron Inc.
- MobileIron Inc. - Overview
- MobileIron Inc. - Product / Service
- MobileIron Inc. - Key offerings
- 15.9 SAP SE
- SAP SE - Overview
- SAP SE - Product / Service
- SAP SE - Key offerings
- 15.10 Atos SE
- Atos SE - Overview
- Atos SE - Product / Service
- Atos SE - Key offerings
- 15.11 Capgemini SE
- Capgemini SE - Overview
- Capgemini SE - Product / Service
- Capgemini SE - Key offerings
- 15.12 Computacenter plc
- Computacenter plc - Overview
- Computacenter plc - Product / Service
- Computacenter plc - Key offerings
- 15.13 Fujitsu Limited
- Fujitsu Limited - Overview
- Fujitsu Limited - Product / Service
- Fujitsu Limited - Key offerings
- 15.14 NTT Data Corporation
- NTT Data Corporation - Overview
- NTT Data Corporation - Product / Service
- NTT Data Corporation - Key offerings
- 15.15 Toshiba Digital Solutions Corporation
- Toshiba Digital Solutions Corporation - Overview
- Toshiba Digital Solutions Corporation - Product / Service
- Toshiba Digital Solutions Corporation - Key offerings
- 15.16 NEC Corporation
- NEC Corporation - Overview
- NEC Corporation - Product / Service
- NEC Corporation - Key offerings
- 15.17 Huawei Technologies Co., Ltd.
- Huawei Technologies Co., Ltd. - Overview
- Huawei Technologies Co., Ltd. - Product / Service
- Huawei Technologies Co., Ltd. - Key offerings
- 15.18 ZTE Corporation
- ZTE Corporation - Overview
- ZTE Corporation - Product / Service
- ZTE Corporation - Key offerings
- 15.19 Lenovo Group Ltd.
- Lenovo Group Ltd. - Overview
- Lenovo Group Ltd. - Product / Service
- Lenovo Group Ltd. - Key offerings
- 15.20 Xiaomi Corporation
- Xiaomi Corporation - Overview
- Xiaomi Corporation - Product / Service
- Xiaomi Corporation - Key offerings
- 15.21 Oppo Mobile Telecommunications Corp.
- Oppo Mobile Telecommunications Corp. - Overview
- Oppo Mobile Telecommunications Corp. - Product / Service
- Oppo Mobile Telecommunications Corp. - Key offerings
- 15.22 TietoEVRY Corporation
- TietoEVRY Corporation - Overview
- TietoEVRY Corporation - Product / Service
- TietoEVRY Corporation - Key offerings
- 15.23 IBM Corporation (United States)
- IBM Corporation (United States) - Overview
- IBM Corporation (United States) - Product / Service
- IBM Corporation (United States) - Key offerings
- 15.24 Microsoft Corporation (United States)
- Microsoft Corporation (United States) - Overview
- Microsoft Corporation (United States) - Product / Service
- Microsoft Corporation (United States) - Key offerings
- 15.25 Cisco Systems Inc. (United States)
- Cisco Systems Inc. (United States) - Overview
- Cisco Systems Inc. (United States) - Product / Service
- Cisco Systems Inc. (United States) - Key offerings
- 15.26 VMware Inc. (United States)
- VMware Inc. (United States) - Overview
- VMware Inc. (United States) - Product / Service
- VMware Inc. (United States) - Key offerings
- 15.27 Citrix Systems Inc. (United States)
- Citrix Systems Inc. (United States) - Overview
- Citrix Systems Inc. (United States) - Product / Service
- Citrix Systems Inc. (United States) - Key offerings
- 15.28 MobileIron Inc. (United States)
- MobileIron Inc. (United States) - Overview
- MobileIron Inc. (United States) - Product / Service
- MobileIron Inc. (United States) - Key offerings
- 15.29 SAP SE (Germany)
- SAP SE (Germany) - Overview
- SAP SE (Germany) - Product / Service
- SAP SE (Germany) - Key offerings
- 15.30 Atos SE (Germany)
- Atos SE (Germany) - Overview
- Atos SE (Germany) - Product / Service
- Atos SE (Germany) - Key offerings
- 15.31 Capgemini SE (Germany, operations)
- Capgemini SE (Germany, operations) - Overview
- Capgemini SE (Germany, operations) - Product / Service
- Capgemini SE (Germany, operations) - Key offerings
- 15.32 Computacenter plc (United Kingdom)
- Computacenter plc (United Kingdom) - Overview
- Computacenter plc (United Kingdom) - Product / Service
- Computacenter plc (United Kingdom) - Key offerings
- 15.33 Fujitsu Limited (Japan)
- Fujitsu Limited (Japan) - Overview
- Fujitsu Limited (Japan) - Product / Service
- Fujitsu Limited (Japan) - Key offerings
- 15.34 NTT Data Corporation (Japan)
- NTT Data Corporation (Japan) - Overview
- NTT Data Corporation (Japan) - Product / Service
- NTT Data Corporation (Japan) - Key offerings
- 15.35 Toshiba Digital Solutions Corporation (Japan)
- Toshiba Digital Solutions Corporation (Japan) - Overview
- Toshiba Digital Solutions Corporation (Japan) - Product / Service
- Toshiba Digital Solutions Corporation (Japan) - Key offerings
- 15.36 NEC Corporation (Japan)
- NEC Corporation (Japan) - Overview
- NEC Corporation (Japan) - Product / Service
- NEC Corporation (Japan) - Key offerings
- 15.37 Huawei Technologies Co., Ltd. (China)
- Huawei Technologies Co., Ltd. (China) - Overview
- Huawei Technologies Co., Ltd. (China) - Product / Service
- Huawei Technologies Co., Ltd. (China) - Key offerings
- 15.38 ZTE Corporation (China)
- ZTE Corporation (China) - Overview
- ZTE Corporation (China) - Product / Service
- ZTE Corporation (China) - Key offerings
- 15.39 Lenovo Group Ltd. (China)
- Lenovo Group Ltd. (China) - Overview
- Lenovo Group Ltd. (China) - Product / Service
- Lenovo Group Ltd. (China) - Key offerings
- 15.40 Xiaomi Corporation (China)
- Xiaomi Corporation (China) - Overview
- Xiaomi Corporation (China) - Product / Service
- Xiaomi Corporation (China) - Key offerings
- 15.41 Oppo Mobile Telecommunications Corp. (China)
- Oppo Mobile Telecommunications Corp. (China) - Overview
- Oppo Mobile Telecommunications Corp. (China) - Product / Service
- Oppo Mobile Telecommunications Corp. (China) - Key offerings
- 15.42 TietoEVRY Corporation (United Kingdom, operations)
- TietoEVRY Corporation (United Kingdom, operations) - Overview
- TietoEVRY Corporation (United Kingdom, operations) - Product / Service
- TietoEVRY Corporation (United Kingdom, operations) - Key offerings
13 Appendix
- 13.2 Inclusions and exclusions checklist
- Exhibit 180: Inclusions checklist
- Exhibit 181: Exclusions checklist
- 13.3 Currency conversion rates for US$
- Exhibit 182: Currency conversion rates for US$
- 13.4 Research methodology
- Exhibit 183: Research methodology
- Exhibit 184: Validation techniques employed for market sizing
- Exhibit 185: Information sources
- 13.5 List of abbreviations
- Exhibit 186: List of abbreviations