Fish Processing Equipment Market Size 2025-2029
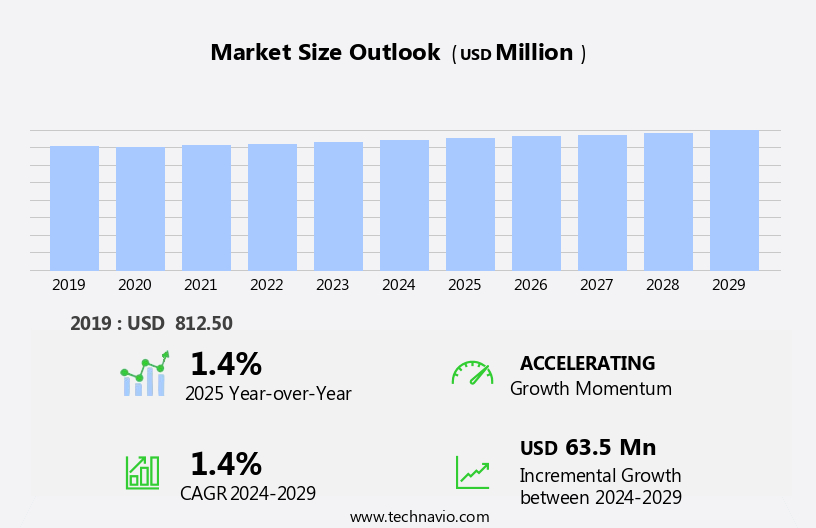
The fish processing equipment market size is forecast to increase by USD 63.5 million, at a CAGR of 1.4% between 2024 and 2029.
- The market is witnessing significant growth due to the increasing consumption and demand for canned seafood, catering services, and nutraceuticals. The expansion of aquaculture and the production of salmon, a rich source of vitamin D, collagen, protein, and feed additives, are major drivers for this market. However, the risk of contamination and subsequent product recalls remains a challenge, necessitating the use of advanced stainless steel fish processing equipment for slaughtering, packaging, and ensuring food safety. The demand for fish feed, which is essential for the growth of the aquaculture industry, is also driving the need for efficient and effective fish processing equipment. In addition, the rising trend of using fish and fish products as dietary supplements and in the production of various nutraceuticals is further boosting market growth.
What will be the Size of the Fish Processing Equipment Market During the Forecast Period?
- The global fish processing market is experiencing strong growth, driven by the increasing demand for seafood and its nutritional benefits, particularly omega-3 fatty acids. The fish oil market and aquaculture therapeutics also contribute significantly to market expansion. Automation and advanced technology are transforming fish processing facilities, reducing labor costs and enhancing product quality. However, challenges such as bacterial illnesses and waste management persist. Processing byproducts, including larger solids and wastewater, pose environmental concerns, with implications for biological oxygen demand and seafood export.
- Food safety, hygiene, and environmental sustainability are paramount, as regulatory bodies like the FDA authorize stricter regulations. Salmon, pollock, and other fish species remain popular, with seafood sourcing a critical consideration for restaurants and catering services. Overfishing, bycatch, and seafood sourcing sustainability are also key issues shaping market dynamics.
How is this Fish Processing Equipment Industry segmented and which is the largest segment?
The fish processing equipment industry research report provides comprehensive data (region-wise segment analysis), with forecasts and estimates in "USD million" for the period 2025-2029, as well as historical data from 2019-2023 for the following segments.
- Product
- Filleting and skinning equipment
- De-heading and gutting equipment
- Grading equipment
- Scaling equipment
- Others
- Distribution Channel
- Online distribution channel
- Offline distribution channel
- Type
- Fresh and chilled fish
- Dried fish
- Frozen fish
- Canned fish
- Technology
- Automated equipment
- Semi-automated equipment
- Manual
- Geography
- APAC
- China
- India
- Vietnam
- Europe
- Germany
- UK
- France
- Norway
- North America
- Canada
- US
- Middle East and Africa
- South America
- Chile
- APAC
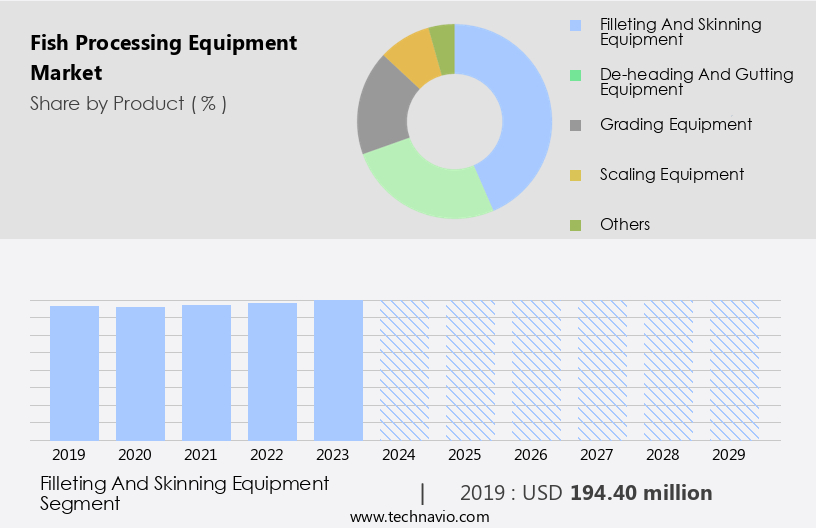
By Product Insights
- The filleting and skinning equipment segment is estimated to witness significant growth during the forecast period.
Fish filleting equipment is essential in the fish processing industry for producing fillets, which consist of dorsal and abdominal muscles. Fillets are popular fish products due to their wide availability and nutritional value, including omega-3 fatty acids, vitamin D, and vitamin B2. Traditional hand filleting is labor-intensive and costly, leading to the adoption of filleting equipment. This machinery uses two-disc knives that maintain a distance equal to the fish's backbone width. The gentle handling provided by filleting equipment prevents downgrading or damage to the fish. Additionally, automation in fish processing facilitates the production of value-added items like fish sauce, pet food, and collagen. Aquaculture species, such as salmon and pollock, are increasingly raised for their nutritional benefits, leading to an increase in demand for fish processing equipment.
Fish processing facilities must adhere to food safety regulations and hygiene standards. Process water, larger solids, and waste volume are critical considerations in designing and managing these facilities. The use of sustainable practices, such as those promoted by the Sustainable Ocean Alliance, is essential to minimize wastewater's biological oxygen demand, total suspended solids, and odor control. Consumer lifestyles and health consciousness have led to an increased demand for nutritious pet food and seafood products. As a result, seafood processing technologies and packaging solutions have become increasingly automated to meet the growing demand for convenience and efficiency.
Get a glance at the Fish Processing Equipment Industry report of share of various segments Request Free Sample
The filleting and skinning equipment segment was valued at USD 194.40 million in 2019 and showed a gradual increase during the forecast period.
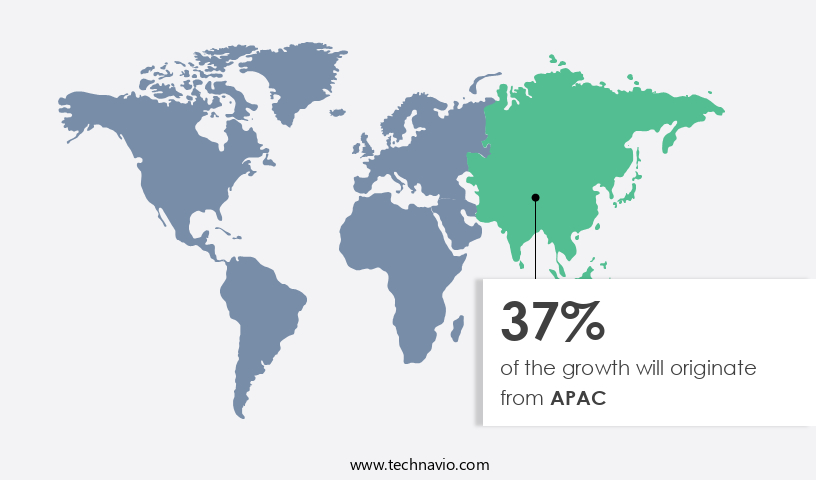
Regional Analysis
- APAC is estimated to contribute 37% to the growth of the global market during the forecast period.
Technavio's analysts have elaborately explained the regional trends and drivers that shape the market during the forecast period.
For more insights on the market share of various regions, Request Free Sample
The market in APAC is experiencing significant growth due to the increasing population and changing consumer preferences in countries like China and India. The need for processed meals to accommodate busy lifestyles has resulted in a rise in food production, particularly in fish processing. Key species include salmon, pollock, and various aquaculture species. Fish processing facilities in APAC, such as China, Thailand, Vietnam, India, South Korea, Indonesia, New Zealand, Bangladesh, and Pakistan, handle large volumes of fish and generate substantial wastewater with high biological oxygen demand and total suspended solids. To address these challenges, the market is witnessing the adoption of automation, sustainable practices, and packaging solutions.
Omega 3 fatty acids, Vitamin D, and Vitamin B2 are valuable byproducts of fish processing, contributing to the fish oil market and aquaculture therapeutics. The FDA's authorization of fish collagen and fish collagens for use in pet food and nutritious human food further boosts market growth. Seafood processors are implementing hygiene features, food safety regulations, and traceability systems, such as QR tags, to ensure the sustainability and quality of their products. The market is segmented into finfish, crustaceans, and mollusks, with automated equipment used for gutting, scaling, skinning, deboning, filleting, and sorting. The frozen seafood segment and direct sales segment are major contributors to the market, with foodservice establishments and supermarkets being significant consumers.
Market Dynamics
Our researchers analyzed the data with 2024 as the base year, along with the key drivers, trends, and challenges. A holistic analysis of drivers will help companies refine their marketing strategies to gain a competitive advantage.
What are the key market drivers leading to the rise in the adoption of Fish Processing Equipment Industry?
Increasing consumption and demand for fish and fish products is the key driver of the market.
- The market is experiencing significant growth due to the rising consumption of fish and fish products for their nutritional value. Fish is a primary source of high-quality protein and essential minerals such as zinc, iodine, and selenium. Omega-3 fatty acids, abundant in fish species like mackerel, herring, sardines, fresh tuna, salmon, and trout, contribute to improved brain function and overall health. The fish oil market and aquaculture therapeutics also benefit from this trend, as they utilize fish byproducts for various applications. Automation and hygiene features are crucial in fish processing, ensuring food safety and reducing bacterial illness risks.
- Seafood processors prioritize stainless steel equipment for its durability and ease of cleaning. The market caters to various segments, including finfish, crustaceans, and mollusks, with processing methods ranging from gutting, scaling, skinning, deboning, filleting, to sorting and packaging. Seafood processors face challenges such as managing wastewater, controlling odor, and ensuring sustainable practices. Processing byproducts can be utilized for various purposes, such as fish collagen production and the creation of nutritious pet food. The seafood industry's focus on sustainability, traceability, and environmental consciousness is driving the adoption of advanced processing technologies and packaging solutions. The health consciousness of consumers and the pet humanization trend have led to increased demand for nutritious seafood products.
- The market serves various sectors, including food specialty stores, convenience stores, restaurants, catering services, and foodservice establishments. Automated filleting, sorting, and packaging systems are increasingly popular to meet the growing demand for value-added items and seafood export. Food safety regulations and hygiene features are essential considerations for fish processing facilities. The fully automatic segment and frozen seafood segment dominate the market, with seafood processing plants and direct sales being significant contributors to the industry.
What are the market trends shaping the Fish Processing Equipment Industry?
Expansion of fish processing plants is the upcoming market trend.
- The fish processing market is experiencing growth as companies expand their operations to cater to the nutritional demands of various industries. The fish oil market, which includes Omega 3 fatty acids, is a significant driver due to its therapeutic applications in aquaculture and human health. FDA authorization of fish oil supplements for nutritional value adds to the market's growth. Aquaculture species, such as salmon and pollock, are the focus of automation in fish processing, with machines for gutting, scaling, skinning, deboning, filleting, and packaging solutions. Automation also addresses bacterial illness concerns and ensures food safety and hygiene. The fish sauce market and the production of vitamins D, B2, and collagen from fish byproducts contribute to the market's sustainability.
- The pet humanization trend increases demand for nutritious pet food, further boosting the market. Seafood processors are implementing QR tags for seafood traceability, ensuring environmental sustainability and combating overfishing. The Sustainable Ocean Alliance and food safety regulations promote the use of stainless steel and automated equipment in seafood processing facilities. The larger solids and waste volume from fish processing require efficient process water management, addressing biological oxygen demand, total suspended solids, and odor control. Lifestyles and health consciousness fuel the demand for nutritious seafood products. Finfish, crustaceans, and mollusks are processed using various technologies, including automated filleting, sorting, and packaging systems.
What challenges does the Fish Processing Equipment Industry face during its growth?
The risk of contamination followed by product recalls is a key challenge affecting the industry growth.
- The market is driven by the increasing demand for nutritional value-added seafood products, particularly in the fish oil market and aquaculture therapeutics. With FDA authorization and growing consumer awareness of Omega 3 fatty acids, Vitamin D, Vitamin B2, and other essential nutrients, the market for fish processing machines is expanding. Aquaculture species such as salmon, pollock, and others are in high demand, leading to an increase in waste volume and larger solids. Bacterial illness is a significant challenge in the fish processing industry, necessitating automation and hygiene features in fish processing facilities. The fish sauce market and pet humanization trends also contribute to the market growth.
- Sustainable practices, such as those promoted by the Sustainable Ocean Alliance, are essential in seafood processing technologies and packaging solutions. Seafood processors must adhere to food safety and hygiene regulations, ensuring that processing byproducts are disposed of properly. Process water treatment and odor control are crucial aspects of fish processing facilities. Lifestyles and health consciousness are driving the demand for nutritious pet food and value-added seafood products. Automated equipment for gutting, scaling, skinning, deboning, filleting, sorting, and packaging systems are essential for food safety and efficiency. The frozen seafood segment and fully automatic segment are major contributors to the market.
- Seafood processing plants, supermarket operations, and foodservice establishments are significant end-users. The direct sales segment and food specialty stores, convenient stores, and catering services are also growing markets.
Exclusive Customer Landscape
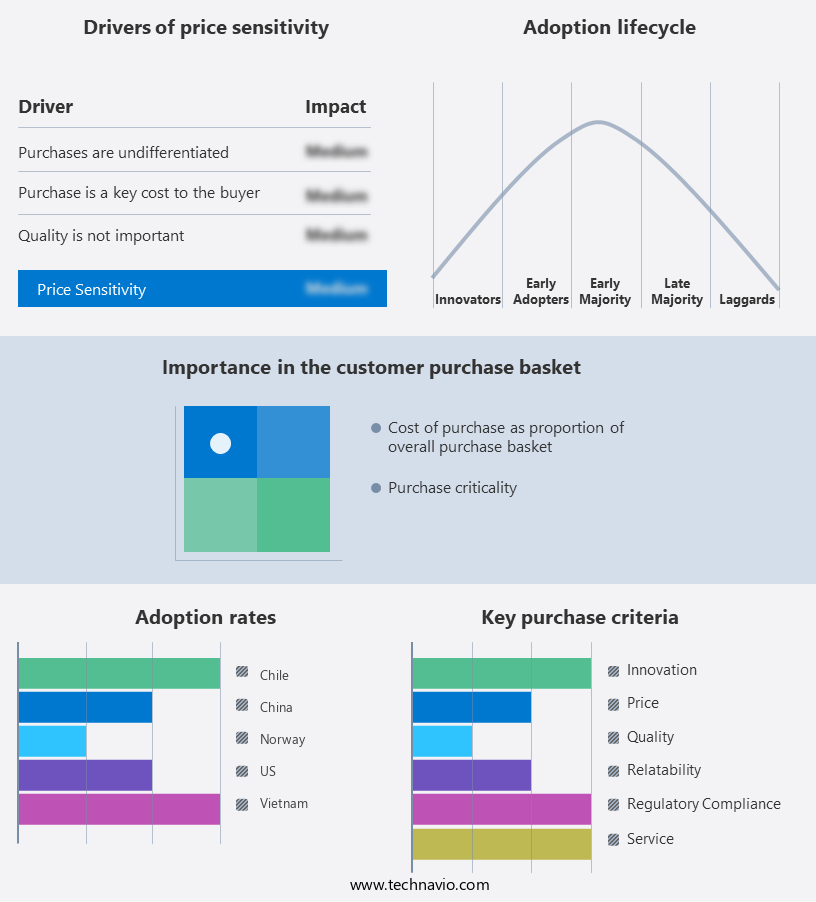
The market forecasting report includes the adoption lifecycle of the market, covering from the innovator's stage to the laggard's stage. It focuses on adoption rates in different regions based on penetration. Furthermore, the market report also includes key purchase criteria and drivers of price sensitivity to help companies evaluate and develop their market growth analysis strategies.
Customer Landscape
Key Companies & Market Insights
Companies are implementing various strategies, such as strategic alliances, market forecast, partnerships, mergers and acquisitions, geographical expansion, and product/service launches, to enhance their presence in the industry.
Arcos - The company offers fish processing equipment such as machines for scaling, gutting, filleting, and packaging fish.
The industry research and growth report includes detailed analyses of the competitive landscape of the market and information about key companies, including:
- Baader Global SE
- Carnitec
- Carsoe Seafood ApS
- Coastline Equipment Inc.
- CTB Inc.
- GEA Group AG
- Marel Group
- Martak Canada Ltd
- Optimar AS
- Pisces Fish Machinery Inc.
- Royale Kitchen Machineries
- Trifisk Manufacturing Inc.
- Uni Food Technic
- Zhengda Food Machinery Co. Ltd.
Qualitative and quantitative analysis of companies has been conducted to help clients understand the wider business environment as well as the strengths and weaknesses of key industry players. Data is qualitatively analyzed to categorize companies as pure play, category-focused, industry-focused, and diversified; it is quantitatively analyzed to categorize companies as dominant, leading, strong, tentative, and weak.
Research Analyst Overview
The market encompasses a broad range of technologies and machinery utilized in the transformation of raw fish into value-added products for various industries. This sector plays a crucial role in the global food industry, supplying essential nutrients and contributing to the growth of markets such as aquaculture therapeutics and nutritional supplements. Aquaculture, the farming of aquatic organisms, has significantly expanded the fish processing industry's scope. With the increasing demand for omega-3 fatty acids, fish oil production has become a significant market segment. The production process involves the extraction of oil from the fish's body, typically through mechanical pressing or solvent extraction.
Further, fish processing machines come in various forms, catering to different species and applications. For instance, gutting, scaling, skinning, deboning, filleting, and portioning equipment are essential for finfish processing. Crustaceans and mollusks require specialized machinery to handle their unique characteristics. Automation has become a key trend in the fish processing industry, with automated filleting, sorting, and packaging systems gaining popularity. These technologies improve efficiency, reduce labor costs, and enhance product quality. Stainless steel is a common material choice for fish processing equipment due to its resistance to corrosion and ease of cleaning. The seafood processing industry is influenced by several factors.
Moreover, lifestyles and health consciousness have led to an increased demand for nutritious pet food and seafood products. Seafood processing technologies and packaging solutions have evolved to cater to these trends, with a focus on food safety, hygiene, and environmental sustainability. Seafood processors operate in various segments, including food specialty stores, convenience stores, and supermarkets. Export and foodservice establishments, such as restaurants and catering services, are significant consumers of seafood products. Fish processing facilities generate substantial waste volumes, primarily in the form of process water, larger solids, and wastewater. Proper management of these byproducts is essential to minimize environmental impact and comply with food safety regulations.
|
Market Scope |
|
|
Report Coverage |
Details |
|
Page number |
248 |
|
Base year |
2024 |
|
Historic period |
2019-2023 |
|
Forecast period |
2025-2029 |
|
Growth momentum & CAGR |
Accelerate at a CAGR of 1.4% |
|
Market growth 2025-2029 |
USD 63.5 million |
|
Market structure |
Fragmented |
|
YoY growth 2024-2025(%) |
1.4 |
|
Key countries |
US, China, Norway, Vietnam, Germany, India, UK, Canada, France, and Chile |
|
Competitive landscape |
Leading Companies, Market Positioning of Companies, Competitive Strategies, and Industry Risks |
What are the Key Data Covered in this Market Research and Growth Report?
- CAGR of the Fish Processing Equipment industry during the forecast period
- Detailed information on factors that will drive the market growth and forecasting between 2025 and 2029
- Precise estimation of the size of the market and its contribution of the industry in focus to the parent market
- Accurate predictions about upcoming growth and trends and changes in consumer behaviour
- Growth of the market across APAC, Europe, North America, Middle East and Africa, and South America
- Thorough analysis of the market's competitive landscape and detailed information about companies
- Comprehensive analysis of factors that will challenge the market growth of industry companies
We can help! Our analysts can customize this market research report to meet your requirements.
 RIA -
RIA - 
