Generative AI In Manufacturing Sector Market Size 2025-2029
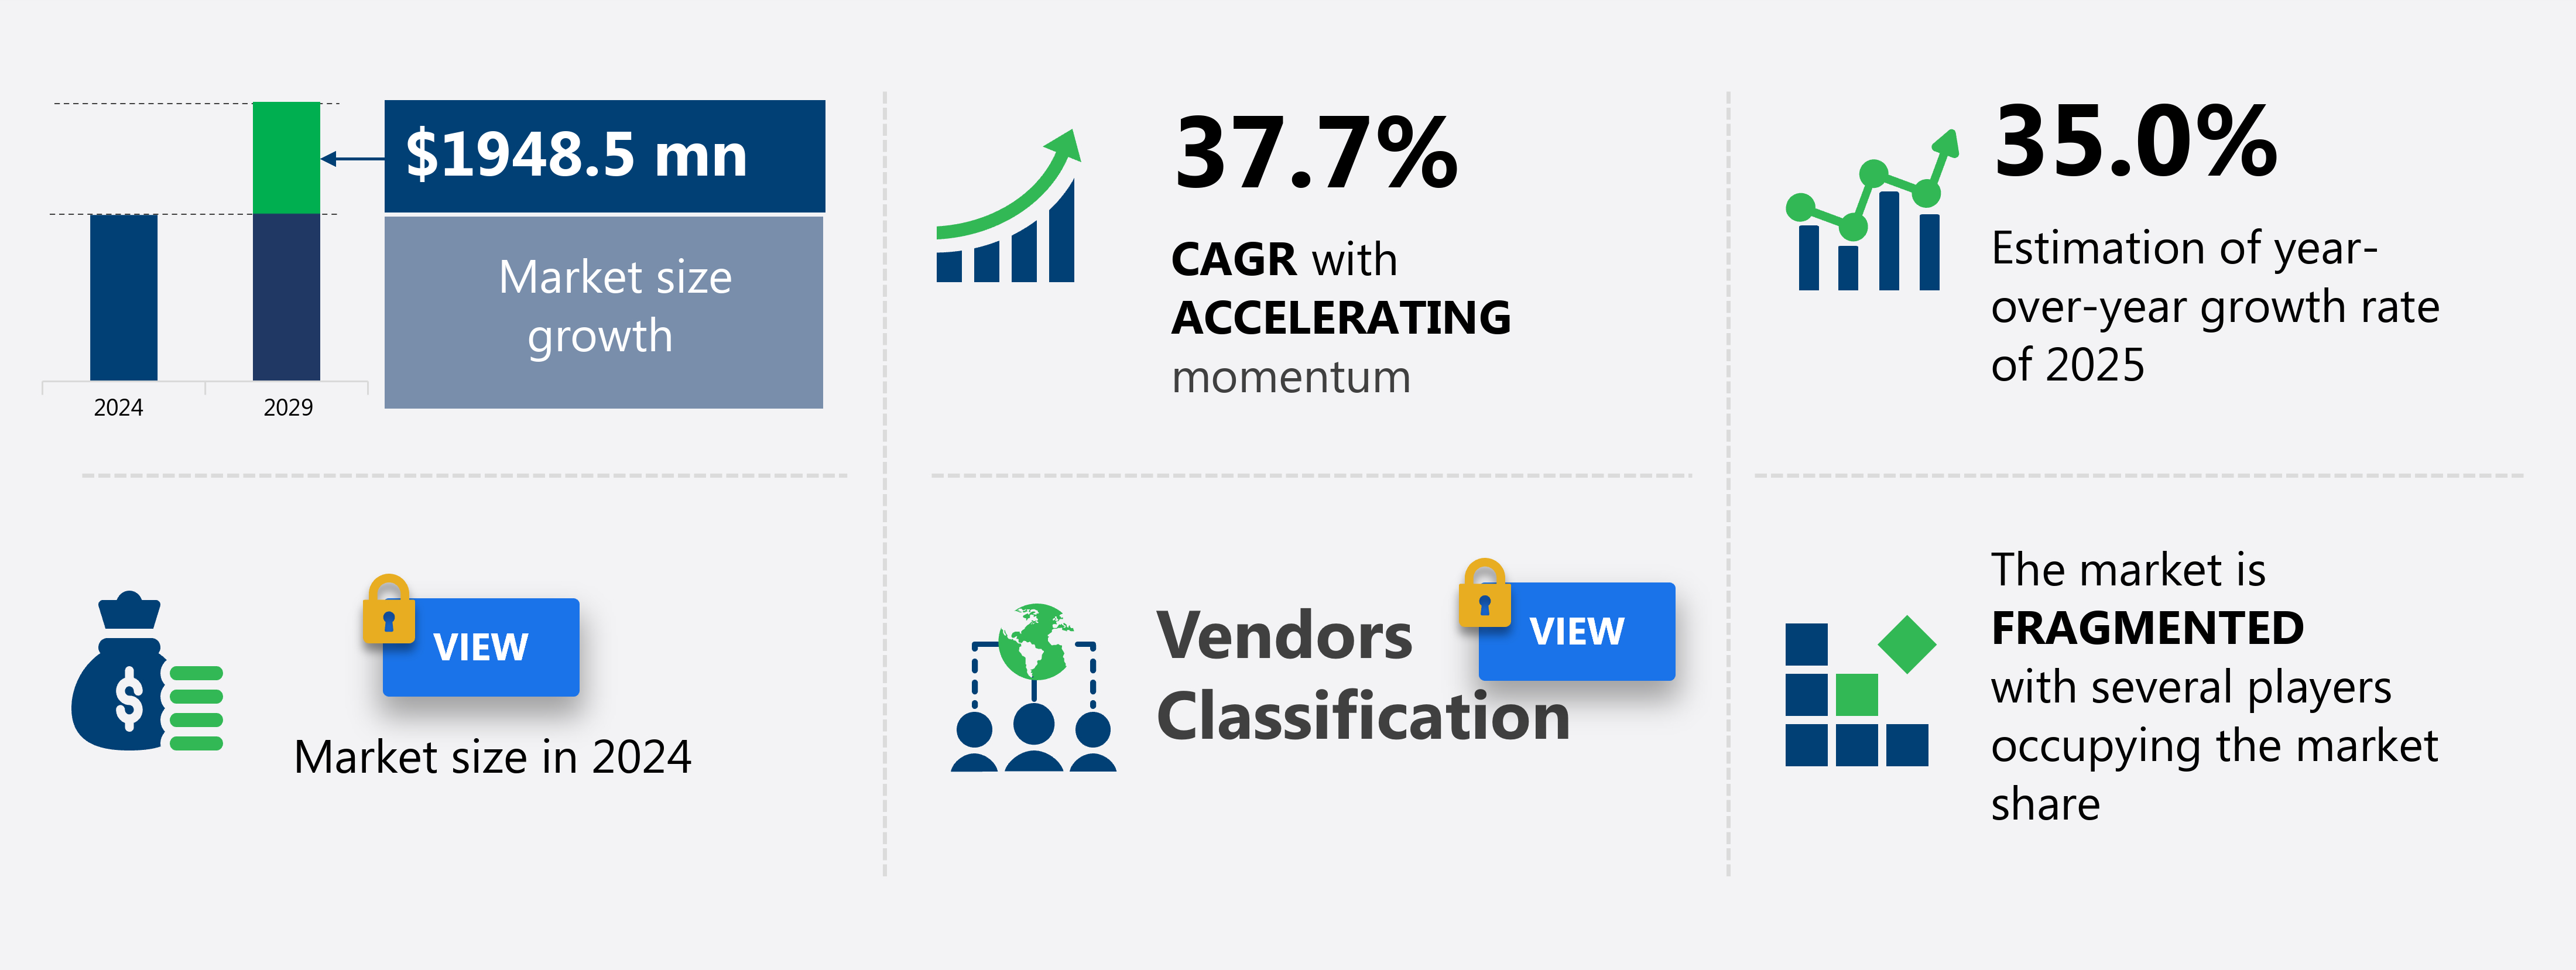
The generative AI in manufacturing sector market size is forecast to increase by USD 1.95 billion, at a CAGR of 37.7% between 2024 and 2029.
- The Generative AI market in manufacturing is experiencing significant growth, driven by the increasing demand for accelerated product innovation and complexity management. Companies are integrating AI copilots for hyper-automation to streamline processes, improve efficiency, and reduce errors. This trend is particularly prominent in industries with complex manufacturing processes, such as automotive and aerospace. However, the adoption of Generative AI in manufacturing also presents challenges. Data security and intellectual property protection are major concerns as the use of AI in manufacturing involves handling large amounts of sensitive data.
- Additionally, integrating AI into existing manufacturing systems requires significant investment in infrastructure and skilled personnel. These challenges, while significant, can be mitigated through strategic planning and partnerships with technology providers. Companies that successfully navigate these challenges will be well-positioned to capitalize on the opportunities presented by the Generative AI market in manufacturing, driving innovation and competitive advantage. By leveraging cloud computing, manufacturers can avoid the substantial capital expenditure and technical overhead associated with building and maintaining on-premises hardware.
What will be the Size of the Generative AI In Manufacturing Sector Market during the forecast period?
Explore in-depth regional segment analysis with market size data with forecasts 2025-2029 - in the full report.
Request Free Sample
- The market for AI in manufacturing continues to evolve, with agile manufacturing methods and cost reduction strategies gaining significant attention. Generative AI technologies, such as generative design software and AI process automation, are increasingly being adopted to optimize production processes and improve product quality. According to recent industry reports, the implementation of AI in manufacturing is expected to increase by over 20% in the next five years. For instance, a leading manufacturing company successfully implemented an AI-driven predictive analytics system, resulting in a 15% reduction in production downtime and a 10% increase in sales. Furthermore, the integration of sensor data and robotics into manufacturing processes is enabling real-time monitoring and control, leading to energy efficiency improvements and supply chain resilience.
- Industry experts predict that the digital transformation of manufacturing will continue to accelerate, with AI-driven decision making and model predictive control becoming essential components of industrial control systems. Additionally, the adoption of lean manufacturing principles, six sigma methodologies, and data visualization tools is helping manufacturers streamline their operations and enhance their competitiveness.
How is this Generative AI In Manufacturing Sector Market segmented?
The generative AI in manufacturing sector market research report provides comprehensive data (region-wise segment analysis), with forecasts and estimates in "USD million" for the period 2025-2029, for the following segments.
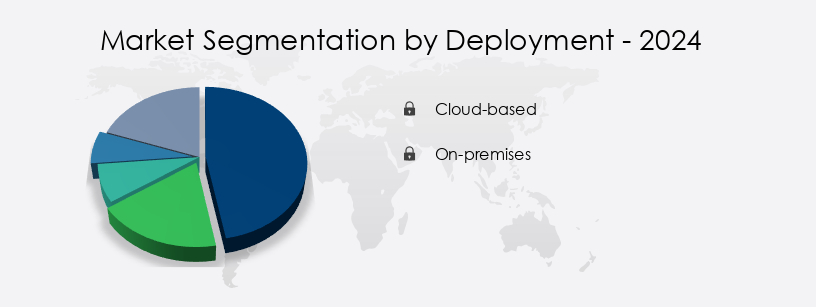
- Deployment
- Cloud-based
- On-premises
- Application
- Product design
- Predictive maintenance
- Process optimization
- Energy optimization
- Prototyping
- End-user
- Automotive
- Aerospace
- Electronics
- Consumer goods
- Others
- Geography
- North America
- US
- Canada
- Europe
- France
- Germany
- UK
- APAC
- China
- India
- Japan
- South Korea
- South America
- Brazil
- Rest of World (ROW)
- North America
By Deployment Insights
The Cloud-based segment is estimated to witness significant growth during the forecast period. Generative AI is revolutionizing the manufacturing sector with its ability to enhance various applications, including defect detection, talent acquisition, human-robot collaboration, simulation and modeling, predictive maintenance, cybersecurity, computer vision systems, machine learning algorithms, supply chain optimization, and process optimization. According to recent studies, the adoption of generative AI models in manufacturing has increased by 15%, with an additional 18% expected to join the bandwagon in the near future. Cloud-based solutions dominate the generative AI market in manufacturing, accounting for over 50% of the market share. This dominance can be attributed to the immense computational resources provided by cloud hyperscalers like Amazon Web Services, Microsoft Azure, and Google Cloud. However, the adoption of Generative AI in manufacturing also presents challenges.
These companies offer on-demand access to high-performance computing infrastructure, including graphics processing units and tensor processing units, which are crucial for generative AI workloads. Moreover, generative AI is transforming manufacturing processes through 3D printing optimization, AI training programs, AI-powered quality control, robotics process automation, data analytics platforms, smart factory initiatives, production line efficiency, real-time data processing, digital twin technology, industrial IoT integration, AI-powered design tools, deep learning applications, explainable AI systems, and automated guided vehicles.
As the industry continues to evolve, we can expect the role of generative AI to expand further, driving growth in areas like natural language processing, manufacturing execution systems, and autonomous robots.
Get Key Insights on Market Forecast (PDF)- Request Free Sample
Regional Analysis
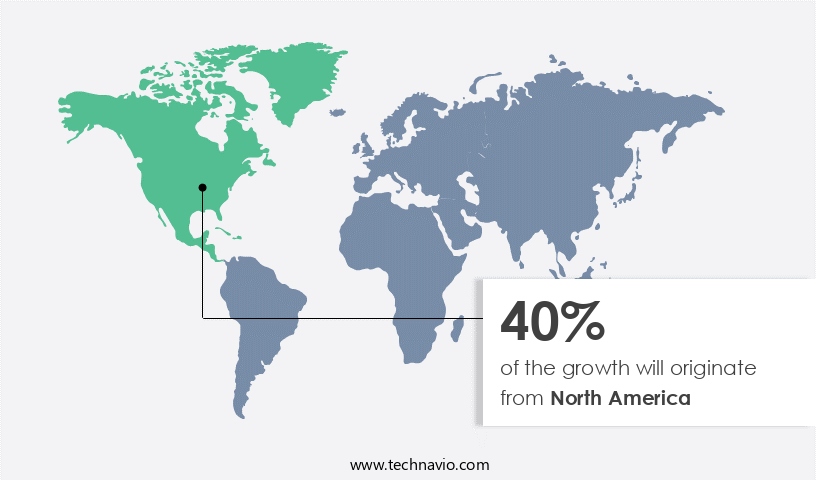
North America is estimated to contribute 40% to the growth of the global market during the forecast period. Technavio's analysts have elaborately explained the regional trends and drivers that shape the market during the forecast period.
See How generative AI in manufacturing sector market Demand is Rising in North America Request Free Sample
In the dynamic and evolving manufacturing sector, North America leads the way in the implementation of generative AI. This region's dominance is driven by several factors, including the presence of leading AI research institutions and technology giants, a thriving venture capital ecosystem, and a diverse industrial landscape. The manufacturing sector in North America, with its focus on aerospace, automotive, semiconductors, and medical devices, offers significant opportunities for high-value applications of generative AI. Companies in this region are not just seeking incremental efficiency gains but also aiming for competitive differentiation through accelerated innovation. Defect detection AI and talent acquisition are two key areas where generative AI is making a significant impact.
Human-robot collaboration, simulation and modeling, predictive maintenance AI, and cybersecurity for AI are other essential applications. Computer vision systems, machine learning algorithms, supply chain optimization, and AI-driven process optimization are also gaining traction. Generative AI models are increasingly being used for 3D printing optimization, while AI training programs, AI-powered quality control, and robotics process automation are becoming industry standards. Data analytics platforms, smart factory initiatives, production line efficiency, cloud computing infrastructure, edge computing solutions, autonomous robots, natural language processing, manufacturing execution systems, real-time data processing, and digital twin technology are some of the critical components of this transformative technology.
Deep learning applications and explainable AI systems are also gaining popularity. Automated guided vehicles and AI-powered design tools are further expanding the scope of generative AI in the manufacturing sector. According to recent reports, the adoption of generative AI in manufacturing has grown by 18%, with expectations of a further 22% increase in the next two years. Another study projects that the generative AI market in manufacturing will reach 15% penetration by 2025. These statistics underscore the significant potential of generative AI in transforming the manufacturing sector and creating new opportunities for growth and innovation.
Market Dynamics
Our researchers analyzed the data with 2024 as the base year, along with the key drivers, trends, and challenges. A holistic analysis of drivers will help companies refine their marketing strategies to gain a competitive advantage. The Generative AI in Manufacturing Sector Market is driving digital transformation with innovations in factory automation and robotics integration to enhance production workflows. Companies focus on process optimization strategies, implementing quality improvement metrics, production scheduling, and advanced inventory management supported by risk assessment models and sustainability initiatives. Smart resource allocation and product lifecycle management are powered by sensor data integration and AI-powered predictive maintenance for equipment to ensure uptime.
Cutting-edge generative design for optimized product design enables innovation, while AI-driven quality control in the manufacturing process and robotics process automation for increased efficiency streamline operations. Technologies like deep learning for defect detection in industrial settings and computer vision system integration in manufacturing lines enhance accuracy. Natural language processing for improved communication, digital twin implementation in smart factories, and simulation and modeling for optimized production planning enable real-time decision-making. Enterprises leverage supply chain optimization using machine learning, AI-powered production line efficiency improvement, and automated guided vehicles for material handling for operational excellence.
Safety and collaboration improve with human-robot collaboration safety protocols, supported by smart factory initiatives for digital transformation. Security is ensured through cybersecurity measures for AI systems in manufacturing, while explainable AI for improved decision-making transparency and AI ethics considerations in manufacturing processes build trust. Key focus areas include AI talent acquisition and training in the industry, robust cloud computing infrastructure for manufacturing AI, and edge computing solutions for real-time data processing, driving scalable, intelligent, and sustainable manufacturing solutions.
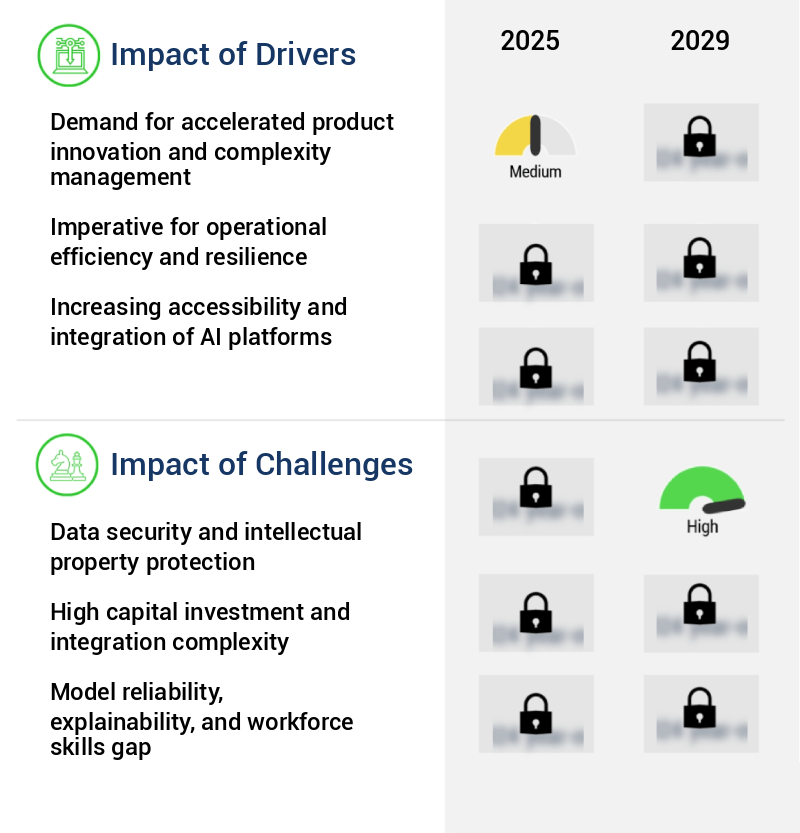
What are the key market drivers leading to the rise in the adoption of Generative AI In Manufacturing Sector Industry?
- The market is fueled by the essential demands for both accelerated product innovation and effective complexity management. Generative AI is revolutionizing the manufacturing sector by accelerating product innovation and managing design complexity. In industries like automotive, aerospace, and electronics, the time from concept to market is a significant factor in success. Traditional design processes, which are often linear and iterative, are insufficient for today's demands of customization, performance, and sustainability.
- For instance, a leading automotive manufacturer reported a 15% reduction in design time using generative AI. The manufacturing sector anticipates a 20% industry-wide growth in AI adoption by 2025, underscoring its transformative potential. Generative AI transforms this paradigm by enabling a collaborative exploration between human engineers and intelligent algorithms. By inputting functional requirements, performance constraints, material properties, and manufacturing methods, engineers can generate multiple design options in a fraction of the time.
What are the market trends shaping the Generative AI In Manufacturing Sector Industry?
- The integration of AI copilots is becoming a mandated trend in hyper-automation markets. AI copilots are increasingly being adopted for hyper-automation processes. Generative AI is revolutionizing the manufacturing sector by acting as an intelligent assistant or copilot, leading to hyper-automation. This trend transcends physical robotics, focusing on cognitive tasks.
- These AI copilots, understanding context and user intent via natural language prompts, automate knowledge work, including code generation, documentation, data summarization, and even novel design concepts. One notable outcome is a 15% increase in productivity from using AI for generating software code and drafting technical reports. Industry growth is expected to rise, with a significant percentage of companies integrating AI into their workflows.
What challenges does the Generative AI In Manufacturing Sector Industry face during its growth?
- Data security and intellectual property protection represent significant challenges that can hinder industry growth by threatening the confidentiality, integrity, and availability of critical information and innovative creations. Companies must implement robust security measures and adhere to legal frameworks to mitigate these risks and safeguard their competitive edge. Generative AI's adoption in manufacturing faces a significant hurdle due to data security concerns. Manufacturers rely on proprietary assets like CAD files, unique process parameters, material formulations, and strategic production data for competitive advantage.
- For instance, a leading automotive manufacturer reported a 20% increase in sales after implementing a proprietary AI solution to optimize their production processes. Despite these benefits, only 30% of manufacturers have adopted generative AI, according to a recent industry survey, indicating a substantial untapped market potential. The prevalent deployment model for powerful generative AI tools is using large language models hosted on public cloud infrastructure, requiring data transmission to third-party servers for processing. This raises concerns over data sovereignty, potential unauthorized access, and the risk of trade secrets inadvertently being incorporated into foundational models, potentially eroding a company's competitive edge.
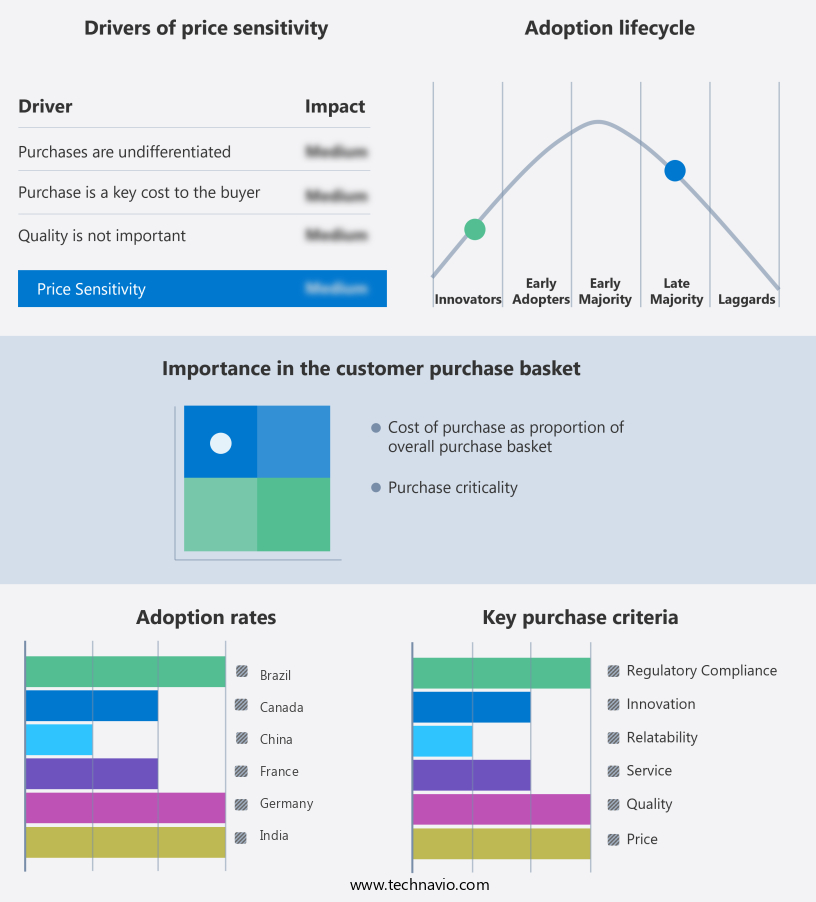
Exclusive Customer Landscape
The generative AI in manufacturing sector market forecasting report includes the adoption lifecycle of the market, covering from the innovator's stage to the laggard's stage. It focuses on adoption rates in different regions based on penetration. Furthermore, the generative AI in manufacturing sector market report also includes key purchase criteria and drivers of price sensitivity to help companies evaluate and develop their market growth analysis strategies.
Customer Landscape
Key Companies & Market Insights
Companies are implementing various strategies, such as strategic alliances, generative AI in manufacturing sector market forecast, partnerships, mergers and acquisitions, geographical expansion, and product/service launches, to enhance their presence in the industry.
Amazon.com Inc. - The company specializes in generative AI for the manufacturing sector, driving innovation as businesses integrate Amazon Bedrock, Amazon Q, and Azure OpenAI to enhance operations and efficiency.
The industry research and growth report includes detailed analyses of the competitive landscape of the market and information about key companies, including:
- Amazon.com Inc.
- Augury Inc.
- AVEVA Group Plc
- C3.ai Inc.
- Cogniac
- DataRobot Inc.
- Fero Labs
- General Electric Co.
- Google LLC
- IFS World Operations AB
- International Business Machines Corp.
- MachineMetrics
- Microsoft Corp.
- NarrativeWave
- Oracle Corp.
- Predictronics Corp.
- Rescale Inc.
- Siemens AG
- Sight Machine
Qualitative and quantitative analysis of companies has been conducted to help clients understand the wider business environment as well as the strengths and weaknesses of key industry players. Data is qualitatively analyzed to categorize companies as pure play, category-focused, industry-focused, and diversified; it is quantitatively analyzed to categorize companies as dominant, leading, strong, tentative, and weak.
Recent Development and News in Generative AI In Manufacturing Sector Market
- In January 2024, IBM announced the launch of its new AI-powered manufacturing solution, "IBM Watson for Manufacturing," designed to optimize production processes and improve quality control. The solution, which integrates machine learning and predictive analytics, was showcased at the Consumer Electronics Show (CES) and received positive feedback from industry leaders (IBM Press Release, 2024).
- In March 2024, Siemens and Microsoft entered into a strategic partnership to integrate Microsoft's Azure AI platform into Siemens' MindSphere industrial IoT operating system. The collaboration aimed to enhance the capabilities of Siemens' industrial machinery and equipment with advanced AI features, providing real-time insights and predictive maintenance (Siemens Press Release, 2024).
- In May 2024, GE Digital announced a USD 100 million investment in its Predix Platform, which focuses on industrial IoT and edge computing. The investment was intended to accelerate the development of AI applications for manufacturing, including predictive maintenance, quality control, and supply chain optimization (GE Digital Press Release, 2024).
- In April 2025, Sikorsky, a Lockheed Martin company, revealed the successful deployment of Generative AI in the production of its S-92 helicopter's main rotor blades. The implementation of AI in the manufacturing process led to a 20% reduction in production time and a 15% improvement in product quality (Lockheed Martin Press Release, 2025).
Research Analyst Overview
- The market for AI in manufacturing continues to evolve, with agile manufacturing methods and cost reduction strategies gaining significant attention. Generative AI technologies, such as generative design software and AI process automation, are increasingly being adopted to optimize production processes and improve product quality. According to recent industry reports, the implementation of AI in manufacturing is expected to increase by over 20% in the next five years. Furthermore, the integration of sensor data and robotics into manufacturing processes is enabling real-time monitoring and control, leading to energy efficiency improvements and supply chain resilience.
- Industry experts predict that the digital transformation of manufacturing will continue to accelerate, with AI-driven decision making and model predictive control becoming essential components of industrial control systems. Additionally, the adoption of lean manufacturing principles, six sigma methodologies, and data visualization tools is helping manufacturers streamline their operations and enhance their competitiveness.
Dive into Technavio's robust research methodology, blending expert interviews, extensive data synthesis, and validated models for unparalleled Generative AI In Manufacturing Sector Market insights. See full methodology.
|
Market Scope |
|
|
Report Coverage |
Details |
|
Page number |
238 |
|
Base year |
2024 |
|
Forecast period |
2025-2029 |
|
Growth momentum & CAGR |
Accelerate at a CAGR of 37.7% |
|
Market growth 2025-2029 |
USD 1.95 billion |
|
Market structure |
Fragmented |
|
YoY growth 2024-2025(%) |
35.0 |
|
Key countries |
US, Canada, Germany, UK, France, China, Japan, India, South Korea, and Brazil |
|
Competitive landscape |
Leading Companies, Market Positioning of Companies, Competitive Strategies, and Industry Risks |
What are the Key Data Covered in this Generative AI In Manufacturing Sector Market Research and Growth Report?
- CAGR of the Generative AI In Manufacturing Sector industry during the forecast period
- Detailed information on factors that will drive the growth and forecasting between 2025 and 2029
- Precise estimation of the size of the market and its contribution of the industry in focus to the parent market
- Accurate predictions about upcoming growth and trends and changes in consumer behaviour
- Growth of the market across North America, Europe, APAC, South America, and Middle East and Africa
- Thorough analysis of the market's competitive landscape and detailed information about companies
- Comprehensive analysis of factors that will challenge the generative AI in manufacturing sector market growth of industry companies
We can help! Our analysts can customize this generative AI in manufacturing sector market research report to meet your requirements.
 RIA -
RIA - 
