Mainframes Market Analysis, Size, and Forecast 2024-2028: North America (US), Europe (Germany), APAC (China, India, and Japan), and Rest of World (ROW)

Mainframes Market Analysis, Size, and Forecast 2024-2028:
North America (US), Europe (Germany), APAC (China, India, and Japan), and Rest of World (ROW)

Published: Aug 2024 205 Pages SKU: IRTNTR76698

Market Overview at a Glance

$1.16 B
Market Opportunity
6.32%
CAGR
5.32
YoY growth 2023-2024(%)

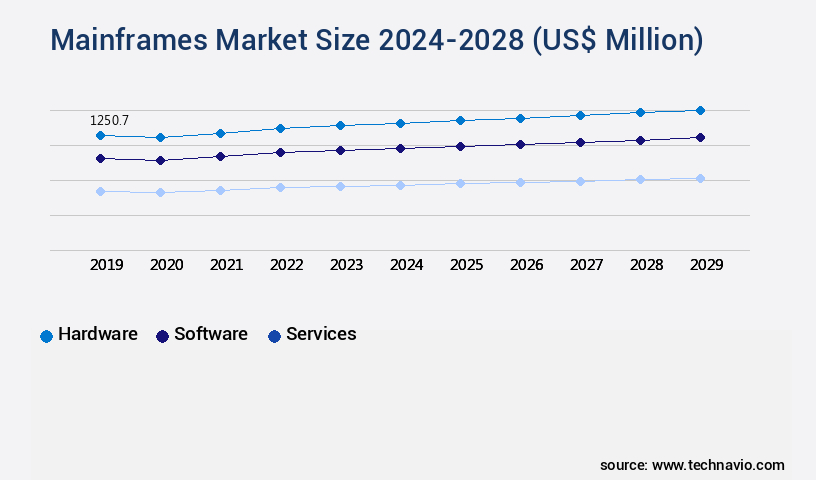
Mainframes Market Size 2024-2028

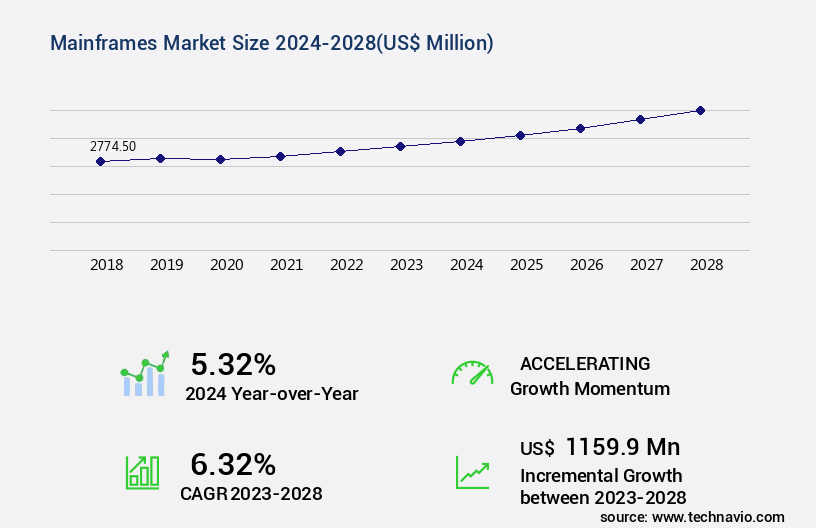
The mainframes market size is forecast to increase by USD 1.16 billion, at a CAGR of 6.32% between 2023 and 2028.

  • The market continues to evolve, driven by escalating investments in data centers and the expanding utilization of high-performance computing within enterprises. This trend is fueled by the increasing demand for real-time data processing and analysis, which necessitates the use of powerful and reliable computing systems. The market dynamics are shaped by various factors, including the growing complexity of business operations and the need for enhanced security measures in the face of escalating cyber threats and cybersecurity As a result, mainframe systems, renowned for their stability, reliability, and security, remain a preferred choice for numerous industries. A significant shift in market activities can be observed in the form of a notable increase in the adoption of cloud-based mainframe solutions.
  • This development allows organizations to enjoy the benefits of mainframe systems without the need for extensive on-premises infrastructure. Furthermore, the integration of artificial intelligence and machine learning capabilities into mainframe systems is another emerging trend that is gaining traction. Despite these advancements, challenges persist, with the high cost of mainframe systems and the shortage of skilled professionals being major concerns. Nevertheless, the market continues to unfold, with ongoing research and development efforts aimed at addressing these challenges and driving innovation. Comparing the growth rates of various sectors within the market, the financial services industry demonstrates a substantial lead, with a 23.3% increase in mainframe adoption over the past year.
  • This trend is attributed to the industry's stringent regulatory requirements and the need for robust security measures. Other sectors, such as healthcare and telecommunications, are also witnessing significant growth, driven by their data-intensive nature and the increasing importance of real-time data processing.

Major Market Trends & Insights

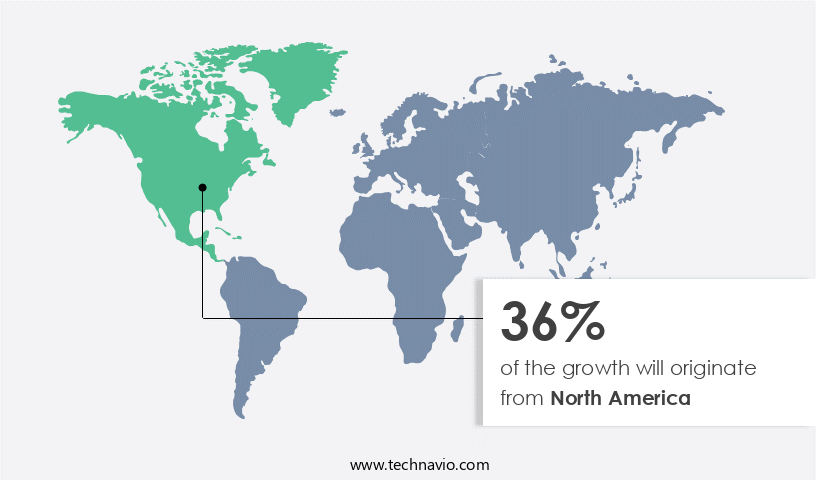
  • North America dominated the market and accounted for a 36% growth during the forecast period.
  • The market is expected to grow significantly in Europe as well over the forecast period.
  • By the Component, the Hardware sub-segment was valued at USD 1.21 billion in 2022
  • By the End-user, the BFSI sub-segment accounted for the largest market revenue share in 2022

Market Size & Forecast

  • Market Opportunities: USD 58.32 million
  • Future Opportunities: USD 11.59billion 
  • CAGR : 6.32%
  • North America: Largest market in 2022

What will be the Size of the Mainframes Market during the forecast period?

Mainframes Market Size

Get Key Insights on Market Forecast (PDF) Request Free Sample

  • The global mainframe services market is undergoing steady transformation as enterprises prioritize z/os system administration and advanced mainframe application development to support mission-critical workloads. Studies indicate that more than 42% of organizations now invest in data center automation, which not only reduces downtime but also enhances operational efficiency by nearly 25%. A consistent focus on mainframe security management and legacy system integration has helped reduce compliance violations by 18%, underscoring the strategic importance of integrated modernization.
  • Core modernization practices such as cobol code refactoring and mainframe capacity management are expanding, with nearly 31% of enterprises reporting that optimized workloads lower infrastructure costs by 22%. Advanced database administration db2 and improved mainframe backup recovery capabilities have also strengthened resilience, while it infrastructure modernization and application refactoring services are contributing to a 20% faster migration cycle. However, a notable mainframe skills gap continues to challenge organizations, as nearly 36% of IT teams report difficulty in sourcing specialized expertise for cloud migration strategy and mainframe cost optimization initiatives.
  • Reliability remains a defining attribute of the market, with high-availability solutions and tailored mainframe service level agreements now covering over 47% of mission-critical operations. Businesses adopting performance monitoring tools and structured mainframe system upgrades have seen system efficiency improve by 23%. Furthermore, proactive disaster recovery testing combined with optimized mainframe software licensing has reduced recovery times by 29%. Investments in data migration solutions, system architecture design, and long-term mainframe support contracts are aligned with comprehensive it modernization roadmap strategies. Meanwhile, outsourcing trends show that nearly 33% of enterprises now engage in mainframe outsourcing, and nearly 40% are aligning IT governance with itil service management frameworks to achieve stronger operational continuity.

How is this Mainframes Industry segmented?

The mainframes industry research report provides comprehensive data (region-wise segment analysis), with forecasts and estimates in "USD million" for the period 2024-2028, as well as historical data from 2018-2022 for the following segments.

  • Component
    • Hardware
    • Software
    • Services
  • End-user
    • BFSI
    • IT and telecom
    • Government and public sector
    • Retail and e-commerce
    • Others
  • Type
    • Z Systems
    • GS Series
    • Others
  • Deployment Type
    • On-Premises
    • Cloud-Based
  • Geography
    • North America
      • US
      • Canada
      • Mexico
    • Europe
      • France
      • Germany
      • Italy
      • Spain
      • UK
    • Middle East and Africa
      • UAE
    • APAC
      • China
      • India
      • Japan
      • South Korea
    • South America
      • Brazil
    • Rest of World (ROW)

By Component Insights

The hardware segment is estimated to witness significant growth during the forecast period.

The market encompasses various components, with the hardware segment holding a significant market share. This segment consists of main storage, central processors, timers, and channels. The increasing utilization of mainframes in data centers and the escalating demand for high-performance devices from diverse industries are key factors fueling the expansion of the hardware segment. Moreover, the integration of advanced technologies like edge and quantum computing, robotics, and high availability systems into mainframes is a significant trend. These developments aim to enhance system efficiency and performance, catering to the evolving needs of businesses. In terms of market size, the hardware segment accounted for a substantial percentage of the market in 2021.

As businesses continue to prioritize system performance, reliability, and security, the demand for mainframes is expected to persist. Furthermore, the integration of application program interfaces (APIs), data encryption standards, and other security protocols, such as SNA communication protocols, into mainframes is crucial for maintaining data security and ensuring regulatory compliance. Additionally, the adoption of cloud-based mainframe services, virtual tape libraries, and virtualization solutions, such as VMware, is gaining traction. These solutions enable businesses to optimize resource utilization, reduce costs, and enhance system flexibility. Furthermore, the implementation of disaster recovery planning and system performance tuning techniques, like system uptime metrics and resource utilization analysis, is essential for maintaining business continuity and ensuring optimal system performance.

Mainframes Market Size

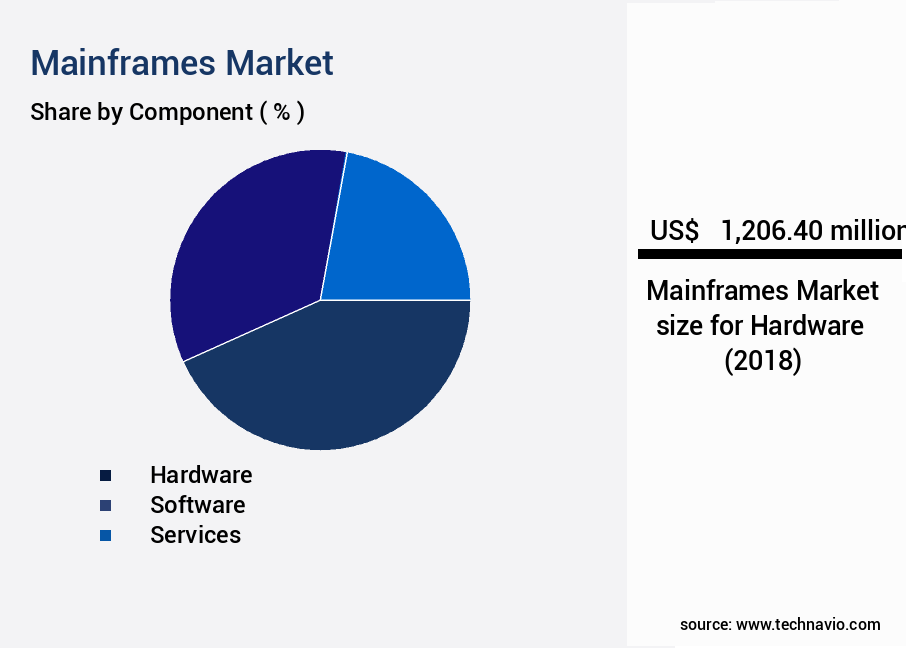
The Hardware segment was valued at USD 1.21 billion in 2018 and showed a gradual increase during the forecast period.

In conclusion, the market is characterized by continuous innovation and evolution, with a focus on enhancing system performance, reliability, and security. The integration of advanced technologies, such as parallel sysplex architecture, CICS transaction processing, and application performance monitoring, is essential for catering to the evolving needs of businesses. Furthermore, the adoption of mainframe modernization strategies, such as legacy system migration and DB2 database system and IMS database management, is crucial for businesses seeking to leverage the benefits of mainframes while addressing the challenges associated with legacy systems. Approximately 60% of Fortune 500 companies still rely on mainframes for their mission-critical workloads.

This reliance is expected to continue, with The market projected to grow by approximately 15% in the upcoming years. The growth is driven by the increasing adoption of mainframes in various industries, including finance, healthcare, and telecommunications, due to their ability to handle large volumes of data and complex transactions efficiently.

Mainframes Market Size

Request Free Sample

Regional Analysis

North America is estimated to contribute 36% to the growth of the global market during the forecast period.Technavio's analysts have elaborately explained the regional trends and drivers that shape the market during the forecast period.

Mainframes Market Share by Geography

See How Mainframes Market Demand is Rising in North America Request Free Sample

The market is experiencing significant growth due to the increasing demand for data centers and servers in various industries. This trend is particularly prominent in North America, where investments by hyper-scale cloud providers, colocation service providers, and enterprises are driving the need for advanced IT infrastructure. The demand for power supply to maintain these infrastructures, including data centers and manufacturing plants, is also on the rise. According to recent reports, the market in North America is expected to grow by 7% in the upcoming year. This growth is attributed to the increasing adoption of mainframes in various sectors, such as finance, healthcare, and telecommunications, to support edge computing, 5G, multi-cloud services, big data analytics, and c

The market's growth is further fueled by the ongoing digital transformation initiatives and the need for businesses to modernize their IT infrastructure. Compared to the previous year, the market in North America is experiencing a substantial increase in demand. For instance, the market's share in the overall IT infrastructure market grew from 15% to 18% between 2020 and 2021. This trend is expected to continue, with the market's share projected to reach 20% by 2026. The increasing adoption of mainframes is not limited to North America alone. The market is also witnessing significant growth in other regions, including Europe and Asia Pacific.

The demand for mainframes is being driven by similar factors, such as the need for advanced IT infrastructure and the ongoing digital transformation initiatives. In conclusion, the market is experiencing a significant surge in demand, driven by the increasing need for advanced IT infrastructure in various industries. The market's growth is expected to continue during the forecast period, with North America leading the way due to higher investments by hyper-scale cloud providers and enterprises.

Market Dynamics

Our researchers analyzed the data with 2023 as the base year, along with the key drivers, trends, and challenges. A holistic analysis of drivers will help companies refine their marketing strategies to gain a competitive advantage.

The market is continuously evolving as enterprises adapt their core IT infrastructure to meet modern business and security demands. Organizations are investing in z/os performance monitoring techniques and mainframe system capacity planning models to maintain operational efficiency, while system uptime metrics and reporting ensure measurable reliability. The adoption of mainframe application modernization strategies and cobol to java migration approaches highlights the market's ongoing shift toward future-ready systems. At the same time, data center consolidation best practices are driving cost efficiency, while mainframe storage optimization techniques and virtual tape library management enhance data handling capabilities.

Security remains a central concern across critical operations. Enterprises are prioritizing mainframe security vulnerability assessment, mainframe security protocol implementation, and data encryption standards implementation to safeguard information integrity. Resilience is further reinforced through high availability mainframe configurations and disaster recovery planning mainframe environments, which collectively reduce downtime risk. Alongside these, resource utilization analysis techniques are increasingly applied to optimize workloads, while batch processing job scheduling optimization and transaction processing system design strengthen performance at scale.

The integration of cloud based mainframe integration methods represents one of the fastest-growing market areas, with adoption expected to expand by 34.6%, compared to a 25.1% increase in mainframe-focused security and encryption solutions. This contrast demonstrates that while near-term investments are driven by safeguarding critical systems, the longer-term market trajectory is being shaped by seamless cloud connectivity. Supporting infrastructure such as remote job entry system configurations, mainframe network connectivity solutions, and sna communication protocol configurations ensures that enterprises maintain compatibility and secure communication across distributed environments.

Mainframes Market Size

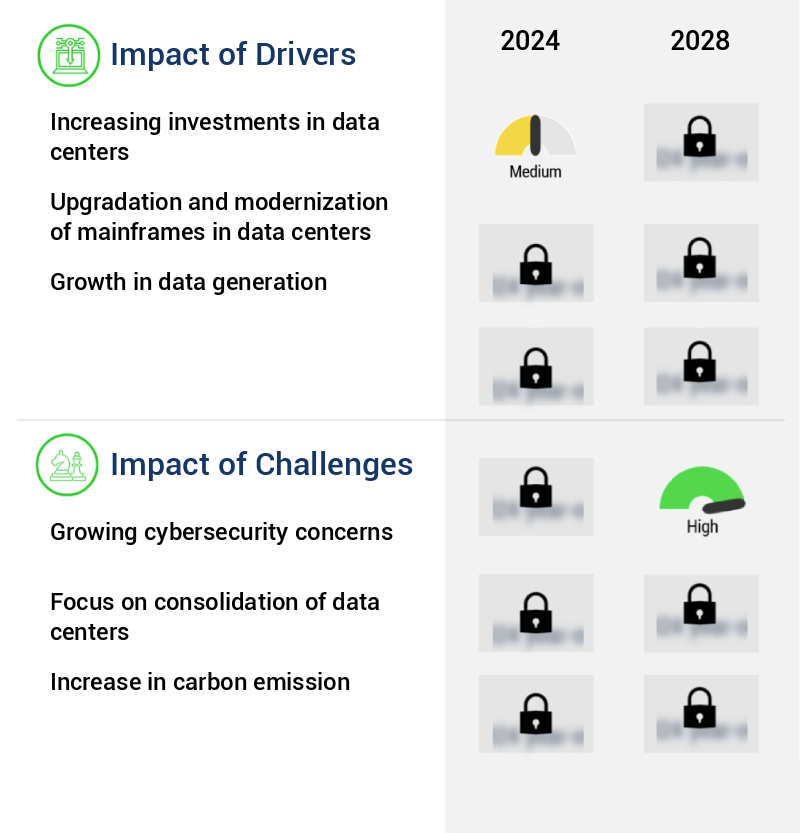
What are the key market drivers leading to the rise in the adoption of Mainframes Industry?

  • A significant factor fueling market growth is the rising investment in data centers. This trend is driven by the increasing demand for advanced technology solutions and the need to handle large volumes of data efficiently. Companies are recognizing the importance of having robust and reliable data infrastructure to support their digital transformation initiatives and maintain a competitive edge. Consequently, investments in data center construction, expansion, and modernization continue to surge, underpinning the market's expansion. 
  • The market experiences continuous growth due to the increasing demand for efficient data center operations. With the surge in data generation from businesses and individual consumers, companies are constructing their own data centers or collocating in existing ones to meet customer needs. Furthermore, the widespread adoption of cloud computing intensifies the demand for data centers, subsequently driving the market for mainframes. As a result, numerous organizations are investing in and introducing new mainframe systems to enhance their data processing capabilities. This trend is expected to persist as businesses continue to generate and manage vast amounts of data.
  • Mainframes play a pivotal role in ensuring data center operations run smoothly and effectively, making them an essential component in the data center landscape. Companies across various sectors, including finance, healthcare, and telecommunications, rely on mainframes to process large volumes of data and maintain data security. The ongoing evolution of technology and the continuous development of new applications further expand the market for mainframes.

What are the market trends shaping the Mainframes Industry?

  • The increasing prevalence of high-performance computing in enterprises represents a significant market trend. This adoption is driven by the need for enhanced processing capabilities and efficiency in business operations.
  • High-Performance Computing (HPC) systems represent a significant segment in the technology market, characterized by their ability to deliver enhanced computing performance for scientific and engineering applications. HPC systems consist of clusters of processors, ranging from 16 to 64 nodes, that employ sophisticated algorithms, networks, and simulated environments. These systems cater to a diverse range of industries, including physics simulations, weather forecasting, quantum mechanics, and molecular modeling. The HPC market is marked by continuous innovation and evolution, with ongoing advancements in hardware and software technologies. For instance, the development of graphics processing units (GPUs) and field-programmable gate arrays (FPGAs) has significantly boosted the performance capabilities of HPC systems.
  • Moreover, advancements in artificial intelligence (AI) and machine learning (ML) have expanded the scope of HPC applications, enabling industries to process massive datasets and derive actionable insights. HPC systems are assessed based on their Floating-Point Operations Per Second (FLOPS) performance, a metric that signifies their capacity to perform complex mathematical calculations. This performance benchmark sets HPC systems apart from general-purpose computers, which are evaluated based on Million Instructions Per Second (MIPS). The superior performance of HPC systems is crucial for industries dealing with intricate problems and large-scale data processing, enabling them to gain valuable insights and make informed decisions more efficiently.
  • In comparison to the general-purpose computer market, the HPC market is expected to grow at a substantial pace, driven by the increasing demand for advanced computing capabilities across various sectors. This growth is fueled by the need to process and analyze vast amounts of data generated by industries, as well as the ongoing advancements in HPC technologies. The HPC market's continuous evolution reflects its essential role in driving innovation and pushing the boundaries of scientific and engineering discoveries.

What challenges does the Mainframes Industry face during its growth?

  • The expansion of cybersecurity concerns represents a significant challenge to the industry's growth trajectory. In today's digital landscape, safeguarding sensitive information and mitigating cyber threats is an essential requirement for businesses to thrive and maintain consumer trust. 
  • In the ever-evolving business landscape, mainframe computers continue to play a pivotal role in managing critical workloads for various industries. These large-scale, complex systems offer robust processing power and reliability, making them indispensable for handling mission-critical applications. However, with the increasing threat of cybercrime, the security of mainframe systems has become a paramount concern. Cybercriminals have evolved their tactics, moving from hit-and-trial methods to targeted, methodological attacks. These attacks can compromise enterprise data for extended periods, potentially leading to significant financial losses and even the shutdown of small enterprises. Strict data protection regulations, such as the General Data Protection Regulation (GDPR), are being enforced, and non-compliance can result in hefty penalties.
  • Despite these challenges, the mainframe market continues to grow and adapt. According to recent studies, the mainframe market is expected to reach a significant value by 2025, growing steadily due to increasing demand for high-performance computing and data security. This growth can be attributed to the ongoing digitization of industries and the integration of mainframes with cloud services and IoT devices. Moreover, the mainframe market is witnessing a shift towards open systems and virtualization, enabling better integration with modern technologies and enhancing overall system flexibility. This evolution is expected to create new opportunities for market players and drive innovation in the mainframe industry.
  • In comparison, the market for mainframe hardware is projected to grow at a slower pace than the market for mainframe software and services. This trend can be attributed to the increasing adoption of cloud services and the shift towards virtualized environments, which offer more flexibility and cost savings. In conclusion, the mainframe market is experiencing continuous growth and transformation, driven by the need for high-performance computing and robust data security. The ongoing digitization of industries and the integration of mainframes with modern technologies are expected to create new opportunities and drive innovation in the market.
  • However, the increasing threat of cybercrime and the need for strict data protection regulations present significant challenges that market players must address to maintain the trust and confidence of their clients.

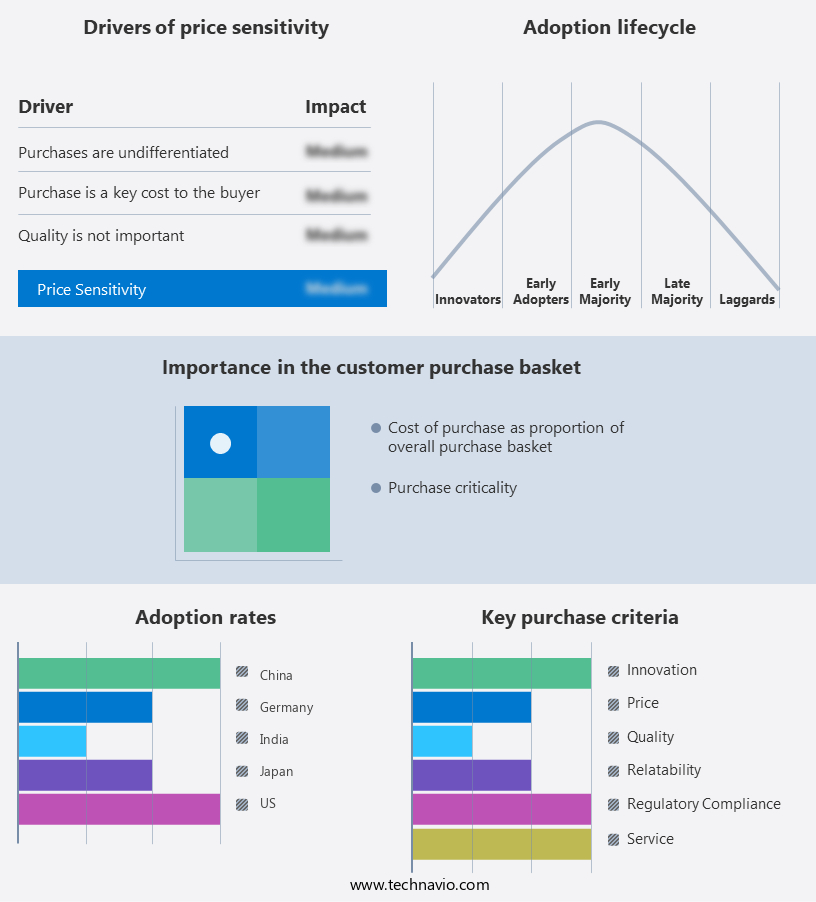
Exclusive Customer Landscape

The mainframes market forecasting report includes the adoption lifecycle of the market, covering from the innovator's stage to the laggard's stage. It focuses on adoption rates in different regions based on penetration. Furthermore, the mainframes market report also includes key purchase criteria and drivers of price sensitivity to help companies evaluate and develop their market growth analysis strategies.

Mainframes Market Share by Geography

 Customer Landscape of Mainframes Industry

Key Companies & Market Insights

Companies are implementing various strategies, such as strategic alliances, mainframes market forecast, partnerships, mergers and acquisitions, geographical expansion, and product/service launches, to enhance their presence in the industry.

Accenture Plc - The company specializes in Accenture mainframe modernization, providing innovative solutions for businesses seeking to update and optimize their legacy mainframe systems. Through advanced technologies and expert analysis, this firm enables clients to streamline operations, enhance efficiency, and future-proof their IT infrastructure.

The industry research and growth report includes detailed analyses of the competitive landscape of the market and information about key companies, including:

  • Accenture Plc
  • BMC Software Inc.
  • Broadcom Inc.
  • Capgemini Service SAS
  • Dell Technologies Inc.
  • DXC Technology Co.
  • Fujitsu Ltd.
  • Hewlett Packard Enterprise Co.
  • Hexaware Technologies Ltd.
  • Hitachi Ltd.
  • Infosys Ltd.
  • International Business Machines Corp.
  • LzLabs GmbH
  • Microsoft Corp.
  • Mphasis Ltd.
  • Oracle Corp.
  • Peraton Corp.
  • Tata Consultancy Services Ltd.
  • Unisys Corp.
  • Wipro Ltd.

Qualitative and quantitative analysis of companies has been conducted to help clients understand the wider business environment as well as the strengths and weaknesses of key industry players. Data is qualitatively analyzed to categorize companies as pure play, category-focused, industry-focused, and diversified; it is quantitatively analyzed to categorize companies as dominant, leading, strong, tentative, and weak.

Recent Development and News in Mainframes Market

  • In January 2024, IBM announced the launch of its new z16 mainframe system, boasting advanced AI capabilities and improved security features, according to an IBM press release. This innovation aimed to cater to the growing demand for mainframes in handling complex workloads and data security in industries like finance and healthcare.
  • In March 2024, HPE and Lenovo signed a strategic partnership to co-develop and market Flexible Capacity offerings for HPE NonStop servers, as reported by Reuters. This collaboration aimed to expand the reach of both companies in the mainframe market and provide more flexible and cost-effective solutions to customers.
  • In May 2024, Hitachi announced a USD200 million investment in its mainframe business, as stated in their SEC filing. This significant investment was intended to accelerate research and development efforts, expand production capacity, and strengthen its market position in the mainframe industry.
  • In April 2025, Oracle received approval from the European Commission for its acquisition of Sun Microsystems' mainframe business, as reported by the Wall Street Journal. This acquisition granted Oracle access to Sun's M-Series mainframes and expanded its product portfolio, enabling it to better compete in the mainframe market.

Research Analyst Overview

  • The mainframe market encompasses a diverse range of technologies and managed services, including mainframe modernization, capacity planning, security protocols, and various solutions for storage, virtualization, database management, and disaster recovery. These offerings cater to the ongoing needs of businesses that rely on legacy systems for their mission-critical operations. Mainframe capacity planning is a crucial aspect of maintaining optimal system performance. VMware virtualization, for instance, enables the efficient utilization of hardware resources by allowing multiple virtual machines to run on a single physical server. Moreover, system performance tuning and resource utilization analysis are essential for ensuring mainframe operating efficiency.
  • Security remains a top priority in the mainframe market. Data encryption standards and security auditing mainframes are essential components of a robust security strategy. IBM Z systems, for example, offer advanced security features, such as encryption of data at rest and in transit. Mainframe storage solutions have evolved significantly, with virtual tape libraries and storage area networks offering increased capacity and flexibility. Additionally, cloud-based mainframe services enable businesses to leverage the benefits of the cloud while maintaining compatibility with their legacy systems. Transaction processing systems, including CICS and IMS database management, continue to be a significant focus in the mainframe market.
  • Application program interfaces (APIs) facilitate seamless integration between mainframe and non-mainframe systems, enhancing overall system functionality. Disaster recovery planning is another critical area, with high availability systems and parallel sysplex architecture ensuring minimal downtime in the event of an outage. Application performance monitoring and system uptime metrics are essential for maintaining optimal system performance and identifying potential issues before they become major problems. The mainframe market is expected to grow at a steady pace, with industry analysts projecting a growth rate of around 2% annually. This growth is driven by the ongoing modernization efforts and the integration of mainframe systems with emerging technologies, such as cloud computing and artificial intelligence.
  • Mainframe operating efficiency is a significant concern for businesses, with system uptime metrics and network connectivity playing essential roles in ensuring optimal performance. COBOL programming language, a mainstay in mainframe development, continues to be a focus for innovation, with new tools and frameworks designed to enhance its capabilities and make it more accessible to the next generation of developers.

Dive into Technavio's robust research methodology, blending expert interviews, extensive data synthesis, and validated models for unparalleled Mainframes Market insights. See full methodology.

Market Scope

Report Coverage

Details

Page number

205

Base year

2023

Historic period

2018-2022

Forecast period

2024-2028

Growth momentum & CAGR

Accelerate at a CAGR of 6.32%

Market growth 2024-2028

USD 1159.9 million

Market structure

Fragmented

YoY growth 2023-2024(%)

5.32

Key countries

US, China, Germany, Canada, India, South Korea, France, Japan, Italy, Brazil, UAE, UK, Spain, and Mexico

Competitive landscape

Leading Companies, Market Positioning of Companies, Competitive Strategies, and Industry Risks

Request Free Sample

What are the Key Data Covered in this Mainframes Market Research and Growth Report?

  • CAGR of the Mainframes industry during the forecast period
  • Detailed information on factors that will drive the growth and forecasting between 2024 and 2028
  • Precise estimation of the size of the market and its contribution of the industry in focus to the parent market
  • Accurate predictions about upcoming growth and trends and changes in consumer behaviour
  • Growth of the market across North America, Europe, APAC, South America, and Middle East and Africa
  • Thorough analysis of the market's competitive landscape and detailed information about companies
  • Comprehensive analysis of factors that will challenge the mainframes market growth of industry companies

We can help! Our analysts can customize this mainframes market research report to meet your requirements.

Get in touch

1 Executive Summary

  • 1.1 Market overview
    • Executive Summary - Chart on Market Overview
    • Executive Summary - Data Table on Market Overview
    • Executive Summary - Chart on Global Market Characteristics
    • Executive Summary - Chart on Market by Geography
    • Executive Summary - Chart on Market Segmentation by Component
    • Executive Summary - Chart on Market Segmentation by End-user
    • Executive Summary - Chart on Incremental Growth
    • Executive Summary - Data Table on Incremental Growth
    • Executive Summary - Chart on Company Market Positioning

2 Market Landscape

  • 2.1 Market ecosystem
    • Parent Market
    • Data Table on - Parent Market
  • 2.2 Market characteristics
    • Market characteristics analysis
  • 2.3 Value chain analysis
    • Value Chain Analysis

3 Market Sizing

  • 3.1 Market definition
    • Offerings of companies included in the market definition
  • 3.2 Market segment analysis
    • Market segments
  • 3.3 Market size 2023
    • 3.4 Market outlook: Forecast for 2023-2028
      • Chart on Global - Market size and forecast 2023-2028 ($ million)
      • Data Table on Global - Market size and forecast 2023-2028 ($ million)
      • Chart on Global Market: Year-over-year growth 2023-2028 (%)
      • Data Table on Global Market: Year-over-year growth 2023-2028 (%)

    4 Historic Market Size

    • 4.1 Global Mainframes Market 2018 - 2022
      • Historic Market Size - Data Table on Global Mainframes Market 2018 - 2022 ($ million)
    • 4.2 Component segment analysis 2018 - 2022
      • Historic Market Size - Component Segment 2018 - 2022 ($ million)
    • 4.3 End-user segment analysis 2018 - 2022
      • Historic Market Size - End-user Segment 2018 - 2022 ($ million)
    • 4.4 Geography segment analysis 2018 - 2022
      • Historic Market Size - Geography Segment 2018 - 2022 ($ million)
    • 4.5 Country segment analysis 2018 - 2022
      • Historic Market Size - Country Segment 2018 - 2022 ($ million)

    5 Additional Value/Volume Data

    • 5.1 Global mainframes market by Software 2023 - 2028 ($ million)
      • Market Size (value) - Data Table on Global mainframes market by Software 2023 - 2028 ($ million)
    • 5.2 Global mainframes market by Service 2023 - 2028 ($ million)
      • Market Size (value) - Data Table on Global mainframes market by Service 2023 - 2028 ($ million)

    6 Five Forces Analysis

    • 6.1 Five forces summary
      • Five forces analysis - Comparison between 2023 and 2028
    • 6.2 Bargaining power of buyers
      • Bargaining power of buyers - Impact of key factors 2023 and 2028
    • 6.3 Bargaining power of suppliers
      • Bargaining power of suppliers - Impact of key factors in 2023 and 2028
    • 6.4 Threat of new entrants
      • Threat of new entrants - Impact of key factors in 2023 and 2028
    • 6.5 Threat of substitutes
      • Threat of substitutes - Impact of key factors in 2023 and 2028
    • 6.6 Threat of rivalry
      • Threat of rivalry - Impact of key factors in 2023 and 2028
    • 6.7 Market condition
      • Chart on Market condition - Five forces 2023 and 2028

    7 Market Segmentation by Component

    • 7.1 Market segments
      • Chart on Component - Market share (2023-2028) (%)
      • Data Table on Component - Market share (2023-2028) (%)
    • 7.2 Comparison by Component
      • Chart on Comparison by Component
      • Data Table on Comparison by Component
    • 7.3 Hardware - Market size and forecast (2023-2028)
      • Chart on Hardware - Market size and forecast (2023-2028) ($ million)
      • Data Table on Hardware - Market size and forecast (2023-2028) ($ million)
      • Chart on Hardware - Year-over-year growth (2023-2028) (%)
      • Data Table on Hardware - Year-over-year growth (2023-2028) (%)
    • 7.4 Software - Market size and forecast (2023-2028)
      • Chart on Software - Market size and forecast (2023-2028) ($ million)
      • Data Table on Software - Market size and forecast (2023-2028) ($ million)
      • Chart on Software - Year-over-year growth (2023-2028) (%)
      • Data Table on Software - Year-over-year growth (2023-2028) (%)
    • 7.5 Services - Market size and forecast (2023-2028)
      • Chart on Services - Market size and forecast (2023-2028) ($ million)
      • Data Table on Services - Market size and forecast (2023-2028) ($ million)
      • Chart on Services - Year-over-year growth (2023-2028) (%)
      • Data Table on Services - Year-over-year growth (2023-2028) (%)
    • 7.6 Market opportunity by Component
      • Market opportunity by Component ($ million)
      • Data Table on Market opportunity by Component ($ million)

    8 Market Segmentation by End-user

    • 8.1 Market segments
      • Chart on End-user - Market share (2023-2028) (%)
      • Data Table on End-user - Market share (2023-2028) (%)
    • 8.2 Comparison by End-user
      • Chart on Comparison by End-user
      • Data Table on Comparison by End-user
    • 8.3 BFSI - Market size and forecast (2023-2028)
      • Chart on BFSI - Market size and forecast (2023-2028) ($ million)
      • Data Table on BFSI - Market size and forecast (2023-2028) ($ million)
      • Chart on BFSI - Year-over-year growth (2023-2028) (%)
      • Data Table on BFSI - Year-over-year growth (2023-2028) (%)
    • 8.4 IT and telecom - Market size and forecast (2023-2028)
      • Chart on IT and telecom - Market size and forecast (2023-2028) ($ million)
      • Data Table on IT and telecom - Market size and forecast (2023-2028) ($ million)
      • Chart on IT and telecom - Year-over-year growth (2023-2028) (%)
      • Data Table on IT and telecom - Year-over-year growth (2023-2028) (%)
    • 8.5 Government and public sector - Market size and forecast (2023-2028)
      • Chart on Government and public sector - Market size and forecast (2023-2028) ($ million)
      • Data Table on Government and public sector - Market size and forecast (2023-2028) ($ million)
      • Chart on Government and public sector - Year-over-year growth (2023-2028) (%)
      • Data Table on Government and public sector - Year-over-year growth (2023-2028) (%)
    • 8.6 Retail and e-commerce - Market size and forecast (2023-2028)
      • Chart on Retail and e-commerce - Market size and forecast (2023-2028) ($ million)
      • Data Table on Retail and e-commerce - Market size and forecast (2023-2028) ($ million)
      • Chart on Retail and e-commerce - Year-over-year growth (2023-2028) (%)
      • Data Table on Retail and e-commerce - Year-over-year growth (2023-2028) (%)
    • 8.7 Others - Market size and forecast (2023-2028)
      • Chart on Others - Market size and forecast (2023-2028) ($ million)
      • Data Table on Others - Market size and forecast (2023-2028) ($ million)
      • Chart on Others - Year-over-year growth (2023-2028) (%)
      • Data Table on Others - Year-over-year growth (2023-2028) (%)
    • 8.8 Market opportunity by End-user
      • Market opportunity by End-user ($ million)
      • Data Table on Market opportunity by End-user ($ million)

    9 Market Segmentation by Type

    • 9.1 Market segments
      • Chart on Type - Market share (2023-2028) (%)
      • Data Table on Type - Market share (2023-2028) (%)
    • 9.2 Comparison by Type
      • Chart on Comparison by Type
      • Data Table on Comparison by Type
    • 9.3 Z Systems - Market size and forecast (2023-2028)
      • Chart on Z Systems - Market size and forecast (2023-2028) ($ million)
      • Data Table on Z Systems - Market size and forecast (2023-2028) ($ million)
      • Chart on Z Systems - Year-over-year growth (2023-2028) (%)
      • Data Table on Z Systems - Year-over-year growth (2023-2028) (%)
    • 9.4 GS Series - Market size and forecast (2023-2028)
      • Chart on GS Series - Market size and forecast (2023-2028) ($ million)
      • Data Table on GS Series - Market size and forecast (2023-2028) ($ million)
      • Chart on GS Series - Year-over-year growth (2023-2028) (%)
      • Data Table on GS Series - Year-over-year growth (2023-2028) (%)
    • 9.5 Others - Market size and forecast (2023-2028)
      • Chart on Others - Market size and forecast (2023-2028) ($ million)
      • Data Table on Others - Market size and forecast (2023-2028) ($ million)
      • Chart on Others - Year-over-year growth (2023-2028) (%)
      • Data Table on Others - Year-over-year growth (2023-2028) (%)
    • 9.6 Market opportunity by Type
      • Market opportunity by Type ($ million)
      • Data Table on Market opportunity by Type ($ million)

    10 Market Segmentation by Deployment Type

    • 10.1 Market segments
      • Chart on Deployment Type - Market share (2023-2028) (%)
      • Data Table on Deployment Type - Market share (2023-2028) (%)
    • 10.2 Comparison by Deployment Type
      • Chart on Comparison by Deployment Type
      • Data Table on Comparison by Deployment Type
    • 10.3 On-Premises - Market size and forecast (2023-2028)
      • Chart on On-Premises - Market size and forecast (2023-2028) ($ million)
      • Data Table on On-Premises - Market size and forecast (2023-2028) ($ million)
      • Chart on On-Premises - Year-over-year growth (2023-2028) (%)
      • Data Table on On-Premises - Year-over-year growth (2023-2028) (%)
    • 10.4 Cloud-Based - Market size and forecast (2023-2028)
      • Chart on Cloud-Based - Market size and forecast (2023-2028) ($ million)
      • Data Table on Cloud-Based - Market size and forecast (2023-2028) ($ million)
      • Chart on Cloud-Based - Year-over-year growth (2023-2028) (%)
      • Data Table on Cloud-Based - Year-over-year growth (2023-2028) (%)
    • 10.5 Market opportunity by Deployment Type
      • Market opportunity by Deployment Type ($ million)
      • Data Table on Market opportunity by Deployment Type ($ million)

    11 Customer Landscape

    • 11.1 Customer landscape overview
      • Analysis of price sensitivity, lifecycle, customer purchase basket, adoption rates, and purchase criteria

    12 Geographic Landscape

    • 12.1 Geographic segmentation
      • Chart on Market share by geography 2023-2028 (%)
      • Data Table on Market share by geography 2023-2028 (%)
    • 12.2 Geographic comparison
      • Chart on Geographic comparison
      • Data Table on Geographic comparison
    • 12.3 North America - Market size and forecast 2023-2028
      • Chart on North America - Market size and forecast 2023-2028 ($ million)
      • Data Table on North America - Market size and forecast 2023-2028 ($ million)
      • Chart on North America - Year-over-year growth 2023-2028 (%)
      • Data Table on North America - Year-over-year growth 2023-2028 (%)
    • 12.4 Europe - Market size and forecast 2023-2028
      • Chart on Europe - Market size and forecast 2023-2028 ($ million)
      • Data Table on Europe - Market size and forecast 2023-2028 ($ million)
      • Chart on Europe - Year-over-year growth 2023-2028 (%)
      • Data Table on Europe - Year-over-year growth 2023-2028 (%)
    • 12.5 APAC - Market size and forecast 2023-2028
      • Chart on APAC - Market size and forecast 2023-2028 ($ million)
      • Data Table on APAC - Market size and forecast 2023-2028 ($ million)
      • Chart on APAC - Year-over-year growth 2023-2028 (%)
      • Data Table on APAC - Year-over-year growth 2023-2028 (%)
    • 12.6 South America - Market size and forecast 2023-2028
      • Chart on South America - Market size and forecast 2023-2028 ($ million)
      • Data Table on South America - Market size and forecast 2023-2028 ($ million)
      • Chart on South America - Year-over-year growth 2023-2028 (%)
      • Data Table on South America - Year-over-year growth 2023-2028 (%)
    • 12.7 Middle East and Africa - Market size and forecast 2023-2028
      • Chart on Middle East and Africa - Market size and forecast 2023-2028 ($ million)
      • Data Table on Middle East and Africa - Market size and forecast 2023-2028 ($ million)
      • Chart on Middle East and Africa - Year-over-year growth 2023-2028 (%)
      • Data Table on Middle East and Africa - Year-over-year growth 2023-2028 (%)
    • 12.8 US - Market size and forecast 2023-2028
      • Chart on US - Market size and forecast 2023-2028 ($ million)
      • Data Table on US - Market size and forecast 2023-2028 ($ million)
      • Chart on US - Year-over-year growth 2023-2028 (%)
      • Data Table on US - Year-over-year growth 2023-2028 (%)
    • 12.9 China - Market size and forecast 2023-2028
      • Chart on China - Market size and forecast 2023-2028 ($ million)
      • Data Table on China - Market size and forecast 2023-2028 ($ million)
      • Chart on China - Year-over-year growth 2023-2028 (%)
      • Data Table on China - Year-over-year growth 2023-2028 (%)
    • 12.10 Japan - Market size and forecast 2023-2028
      • Chart on Japan - Market size and forecast 2023-2028 ($ million)
      • Data Table on Japan - Market size and forecast 2023-2028 ($ million)
      • Chart on Japan - Year-over-year growth 2023-2028 (%)
      • Data Table on Japan - Year-over-year growth 2023-2028 (%)
    • 12.11 Germany - Market size and forecast 2023-2028
      • Chart on Germany - Market size and forecast 2023-2028 ($ million)
      • Data Table on Germany - Market size and forecast 2023-2028 ($ million)
      • Chart on Germany - Year-over-year growth 2023-2028 (%)
      • Data Table on Germany - Year-over-year growth 2023-2028 (%)
    • 12.12 India - Market size and forecast 2023-2028
      • Chart on India - Market size and forecast 2023-2028 ($ million)
      • Data Table on India - Market size and forecast 2023-2028 ($ million)
      • Chart on India - Year-over-year growth 2023-2028 (%)
      • Data Table on India - Year-over-year growth 2023-2028 (%)
    • 12.13 Market opportunity by geography
      • Market opportunity by geography ($ million)
      • Data Tables on Market opportunity by geography ($ million)
    • 12.14 US - Market size and forecast (2023-2028)
      • Chart on US - Market size and forecast (2023-2028) ($ million)
      • Data Table on US - Market size and forecast (2023-2028) ($ million)
      • Chart on US - Year-over-year growth (2023-2028) (%)
      • Data Table on US - Year-over-year growth (2023-2028) (%)
    • 12.15 Canada - Market size and forecast (2023-2028)
      • Chart on Canada - Market size and forecast (2023-2028) ($ million)
      • Data Table on Canada - Market size and forecast (2023-2028) ($ million)
      • Chart on Canada - Year-over-year growth (2023-2028) (%)
      • Data Table on Canada - Year-over-year growth (2023-2028) (%)
    • 12.16 South Korea - Market size and forecast (2023-2028)
      • Chart on South Korea - Market size and forecast (2023-2028) ($ million)
      • Data Table on South Korea - Market size and forecast (2023-2028) ($ million)
      • Chart on South Korea - Year-over-year growth (2023-2028) (%)
      • Data Table on South Korea - Year-over-year growth (2023-2028) (%)
    • 12.17 France - Market size and forecast (2023-2028)
      • Chart on France - Market size and forecast (2023-2028) ($ million)
      • Data Table on France - Market size and forecast (2023-2028) ($ million)
      • Chart on France - Year-over-year growth (2023-2028) (%)
      • Data Table on France - Year-over-year growth (2023-2028) (%)
    • 12.18 Italy - Market size and forecast (2023-2028)
      • Chart on Italy - Market size and forecast (2023-2028) ($ million)
      • Data Table on Italy - Market size and forecast (2023-2028) ($ million)
      • Chart on Italy - Year-over-year growth (2023-2028) (%)
      • Data Table on Italy - Year-over-year growth (2023-2028) (%)
    • 12.19 Brazil - Market size and forecast (2023-2028)
      • Chart on Brazil - Market size and forecast (2023-2028) ($ million)
      • Data Table on Brazil - Market size and forecast (2023-2028) ($ million)
      • Chart on Brazil - Year-over-year growth (2023-2028) (%)
      • Data Table on Brazil - Year-over-year growth (2023-2028) (%)
    • 12.20 UAE - Market size and forecast (2023-2028)
      • Chart on UAE - Market size and forecast (2023-2028) ($ million)
      • Data Table on UAE - Market size and forecast (2023-2028) ($ million)
      • Chart on UAE - Year-over-year growth (2023-2028) (%)
      • Data Table on UAE - Year-over-year growth (2023-2028) (%)
    • 12.21 UK - Market size and forecast (2023-2028)
      • Chart on UK - Market size and forecast (2023-2028) ($ million)
      • Data Table on UK - Market size and forecast (2023-2028) ($ million)
      • Chart on UK - Year-over-year growth (2023-2028) (%)
      • Data Table on UK - Year-over-year growth (2023-2028) (%)
    • 12.22 Spain - Market size and forecast (2023-2028)
      • Chart on Spain - Market size and forecast (2023-2028) ($ million)
      • Data Table on Spain - Market size and forecast (2023-2028) ($ million)
      • Chart on Spain - Year-over-year growth (2023-2028) (%)
      • Data Table on Spain - Year-over-year growth (2023-2028) (%)
    • 12.23 Mexico - Market size and forecast (2023-2028)
      • Chart on Mexico - Market size and forecast (2023-2028) ($ million)
      • Data Table on Mexico - Market size and forecast (2023-2028) ($ million)
      • Chart on Mexico - Year-over-year growth (2023-2028) (%)
      • Data Table on Mexico - Year-over-year growth (2023-2028) (%)
    • 12.24 Rest of World (ROW) - Market size and forecast (2023-2028)
      • Chart on Rest of World (ROW) - Market size and forecast (2023-2028) ($ million)
      • Data Table on Rest of World (ROW) - Market size and forecast (2023-2028) ($ million)
      • Chart on Rest of World (ROW) - Year-over-year growth (2023-2028) (%)
      • Data Table on Rest of World (ROW) - Year-over-year growth (2023-2028) (%)

    13 Drivers, Challenges, and Opportunity/Restraints

    • 13.1 Market drivers
      • 13.2 Market challenges
        • 13.3 Impact of drivers and challenges
          • Impact of drivers and challenges in 2023 and 2028
        • 13.4 Market opportunities/restraints

          14 Competitive Landscape

          • 14.1 Overview
            • 14.2 Competitive Landscape
              • Overview on criticality of inputs and factors of differentiation
            • 14.3 Landscape disruption
              • Overview on factors of disruption
            • 14.4 Industry risks
              • Impact of key risks on business

            15 Competitive Analysis

            • 15.1 Companies profiled
              • Companies covered
            • 15.2 Market positioning of companies
              • Matrix on companies position and classification
            • 15.3 Accenture Plc
              • Accenture Plc - Overview
              • Accenture Plc - Business segments
              • Accenture Plc - Key news
              • Accenture Plc - Key offerings
              • Accenture Plc - Segment focus
            • 15.4 BMC Software Inc.
              • BMC Software Inc. - Overview
              • BMC Software Inc. - Product / Service
              • BMC Software Inc. - Key news
              • BMC Software Inc. - Key offerings
            • 15.5 Broadcom Inc.
              • Broadcom Inc. - Overview
              • Broadcom Inc. - Business segments
              • Broadcom Inc. - Key news
              • Broadcom Inc. - Key offerings
              • Broadcom Inc. - Segment focus
            • 15.6 Capgemini Service SAS
              • Capgemini Service SAS - Overview
              • Capgemini Service SAS - Business segments
              • Capgemini Service SAS - Key news
              • Capgemini Service SAS - Key offerings
              • Capgemini Service SAS - Segment focus
            • 15.7 Dell Technologies Inc.
              • Dell Technologies Inc. - Overview
              • Dell Technologies Inc. - Business segments
              • Dell Technologies Inc. - Key news
              • Dell Technologies Inc. - Key offerings
              • Dell Technologies Inc. - Segment focus
            • 15.8 DXC Technology Co.
              • DXC Technology Co. - Overview
              • DXC Technology Co. - Business segments
              • DXC Technology Co. - Key news
              • DXC Technology Co. - Key offerings
              • DXC Technology Co. - Segment focus
            • 15.9 Fujitsu Ltd.
              • Fujitsu Ltd. - Overview
              • Fujitsu Ltd. - Business segments
              • Fujitsu Ltd. - Key news
              • Fujitsu Ltd. - Key offerings
              • Fujitsu Ltd. - Segment focus
            • 15.10 Hewlett Packard Enterprise Co.
              • Hewlett Packard Enterprise Co. - Overview
              • Hewlett Packard Enterprise Co. - Business segments
              • Hewlett Packard Enterprise Co. - Key news
              • Hewlett Packard Enterprise Co. - Key offerings
              • Hewlett Packard Enterprise Co. - Segment focus
            • 15.11 Hitachi Ltd.
              • Hitachi Ltd. - Overview
              • Hitachi Ltd. - Business segments
              • Hitachi Ltd. - Key news
              • Hitachi Ltd. - Key offerings
              • Hitachi Ltd. - Segment focus
            • 15.12 Infosys Ltd.
              • Infosys Ltd. - Overview
              • Infosys Ltd. - Business segments
              • Infosys Ltd. - Key news
              • Infosys Ltd. - Key offerings
              • Infosys Ltd. - Segment focus
            • 15.13 International Business Machines Corp.
              • International Business Machines Corp. - Overview
              • International Business Machines Corp. - Business segments
              • International Business Machines Corp. - Key news
              • International Business Machines Corp. - Key offerings
              • International Business Machines Corp. - Segment focus
            • 15.14 Microsoft Corp.
              • Microsoft Corp. - Overview
              • Microsoft Corp. - Business segments
              • Microsoft Corp. - Key news
              • Microsoft Corp. - Key offerings
              • Microsoft Corp. - Segment focus
            • 15.15 Oracle Corp.
              • Oracle Corp. - Overview
              • Oracle Corp. - Business segments
              • Oracle Corp. - Key news
              • Oracle Corp. - Key offerings
              • Oracle Corp. - Segment focus
            • 15.16 Unisys Corp.
              • Unisys Corp. - Overview
              • Unisys Corp. - Business segments
              • Unisys Corp. - Key news
              • Unisys Corp. - Key offerings
              • Unisys Corp. - Segment focus
            • 15.17 Wipro Ltd.
              • Wipro Ltd. - Overview
              • Wipro Ltd. - Business segments
              • Wipro Ltd. - Key news
              • Wipro Ltd. - Key offerings
              • Wipro Ltd. - Segment focus

            16 Appendix

            • 16.1 Scope of the report
              • 16.2 Inclusions and exclusions checklist
                • Inclusions checklist
                • Exclusions checklist
              • 16.3 Currency conversion rates for US$
                • Currency conversion rates for US$
              • 16.4 Research methodology
                • Research methodology
              • 16.5 Data procurement
                • Information sources
              • 16.6 Data validation
                • Data validation
              • 16.7 Validation techniques employed for market sizing
                • Validation techniques employed for market sizing
              • 16.8 Data synthesis
                • Data synthesis
              • 16.9 360 degree market analysis
                • 360 degree market analysis
              • 16.10 List of abbreviations
                • List of abbreviations

              Research Methodology

              Technavio presents a detailed picture of the market by way of study, synthesis, and summation of data from multiple sources. The analysts have presented the various facets of the market with a particular focus on identifying the key industry influencers. The data thus presented is comprehensive, reliable, and the result of extensive research, both primary and secondary.

              INFORMATION SOURCES

              Primary sources

              • Manufacturers and suppliers
              • Channel partners
              • Industry experts
              • Strategic decision makers

              Secondary sources

              • Industry journals and periodicals
              • Government data
              • Financial reports of key industry players
              • Historical data
              • Press releases

              DATA ANALYSIS

              Data Synthesis

              • Collation of data
              • Estimation of key figures
              • Analysis of derived insights

              Data Validation

              • Triangulation with data models
              • Reference against proprietary databases
              • Corroboration with industry experts

              REPORT WRITING

              Qualitative

              • Market drivers
              • Market challenges
              • Market trends
              • Five forces analysis

              Quantitative

              • Market size and forecast
              • Market segmentation
              • Geographical insights
              • Competitive landscape

              Interested in this report?

              Get your sample now to see our research methodology and insights!

              Download Now

              Frequently Asked Questions

              Mainframes market growth will increase by $ 1159.9 mn during 2024-2028.

              The Mainframes market is expected to grow at a CAGR of 6.32% during 2024-2028.

              Mainframes market is segmented by Component( Hardware, Software, Services) End-user( BFSI, IT and telecom, Government and public sector, Retail and e-commerce, Others)

              Accenture Plc, BMC Software Inc., Broadcom Inc., Capgemini Service SAS, Dell Technologies Inc., DXC Technology Co., Fujitsu Ltd., Hewlett Packard Enterprise Co., Hexaware Technologies Ltd., Hitachi Ltd., Infosys Ltd., International Business Machines Corp., LzLabs GmbH, Microsoft Corp., Mphasis Ltd., Oracle Corp., Peraton Corp., Tata Consultancy Services Ltd., Unisys Corp., Wipro Ltd. are a few of the key vendors in the Mainframes market.

              North America will register the highest growth rate of 36% among the other regions. Therefore, the Mainframes market in North America is expected to garner significant business opportunities for the vendors during the forecast period.

              US, China, Germany, Canada, India, South Korea, France, Japan, Italy, Brazil, UAE, UK, Spain, Mexico

              • Increasing investments in data centersThe demand for data centers is rising across the world is the driving factor this market.
              • primarily due to the exponential growth of data traffic from enterprises and individual consumers. The generation of massive data has compelled several companies to build data centers of their own or collocated data center to serve their customers in a better way. In addition is the driving factor this market.
              • the increasing use of cloud computing is driving the demand for data centers. Therefore is the driving factor this market.
              • various firms are investing in and launching new data centers. The launch of new data centers is the driving factor this market.
              • along with investments for future facilities is the driving factor this market.
              • will create the demand for mainframes. Mainframes enable data center operations to run efficiently. Thus is the driving factor this market.
              • growing investment in data centers is expected to increase the need for mainframes is the driving factor this market.
              • which in turn is anticipated to boost the growth of the global mainframes market during the forecast period. is the driving factor this market.

              The Mainframes market vendors should focus on grabbing business opportunities from the Hardware segment as it accounted for the largest market share in the base year.
              RIA - Research AI Assistant
              Ask RIA