
Medical Device Connectivity Market Size 2025-2029
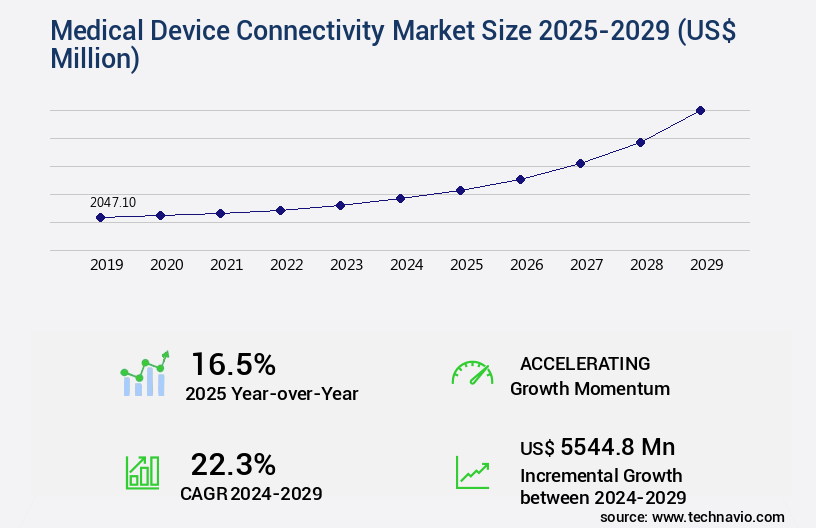
The medical device connectivity market size is valued to increase by USD 5.54 billion, at a CAGR of 22.3% from 2024 to 2029. Emergence of digital healthcare services and healthcare 4.0 will drive the medical device connectivity market.
Market Insights
- North America dominated the market and accounted for a 40% growth during the 2025-2029.
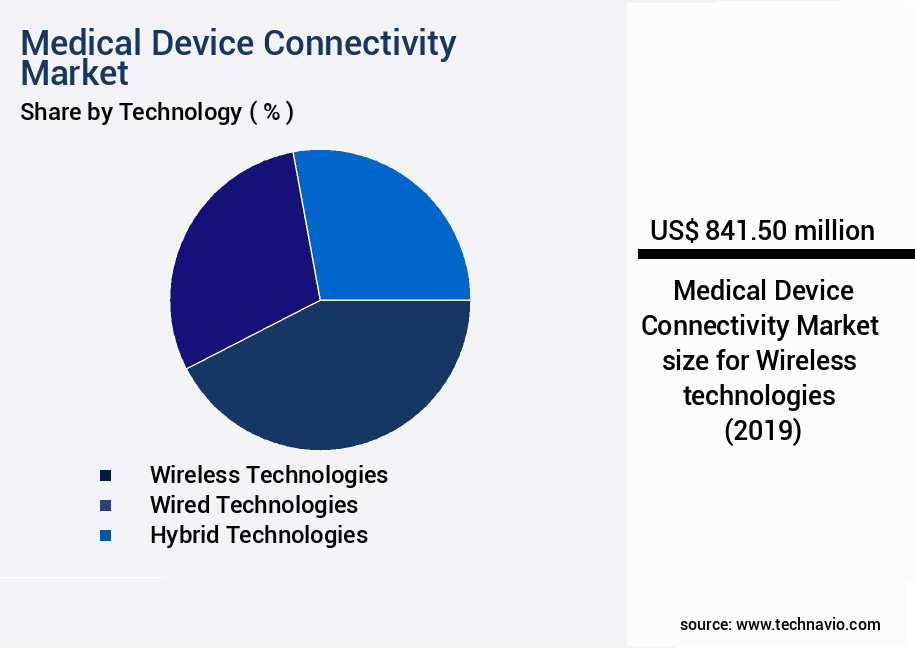
- By Technology - Wireless technologies segment was valued at USD 841.50 billion in 2023
- By End-user - Hospitals segment accounted for the largest market revenue share in 2023
Market Size & Forecast
- Market Opportunities: USD 327.37 million
- Market Future Opportunities 2024: USD 5544.80 million
- CAGR from 2024 to 2029 : 22.3%
Market Summary
- The market is experiencing significant growth as the healthcare industry embraces digital transformation and the integration of medical devices into healthcare networks. Digital healthcare services and the evolution of healthcare 4.0 are key drivers, enabling remote patient monitoring, real-time data analysis, and improved clinical outcomes. However, the deployment of medical device connectivity solutions presents complexities, including data security, interoperability, and regulatory compliance. A real-world business scenario illustrates the importance of medical device connectivity. A leading pharmaceutical company aims to optimize its supply chain by integrating real-time data from medical devices used in clinical trials. By connecting devices to the cloud, the company can monitor trial progress, identify potential issues, and make data-driven decisions, ultimately reducing costs and improving operational efficiency.
- Despite these benefits, challenges remain. Ensuring data security and privacy is essential, as sensitive patient information is transmitted over networks. Interoperability between different devices and systems is another challenge, requiring standardization and collaboration among industry stakeholders. Regulatory compliance adds another layer of complexity, as regulations vary between countries and jurisdictions. In conclusion, the market is poised for growth as the healthcare industry continues to digitize and integrate medical devices into healthcare networks. The benefits, including improved patient care, operational efficiency, and supply chain optimization, outweigh the challenges, but addressing complexities such as data security, interoperability, and regulatory compliance is crucial for market success.
What will be the size of the Medical Device Connectivity Market during the forecast period?
Get Key Insights on Market Forecast (PDF) Request Free Sample
- The market continues to evolve, driven by the increasing adoption of Internet of Things (IoT) medical devices and the need for seamless data exchange between devices and healthcare providers. According to recent studies, the use of remote monitoring and telehealth services is projected to grow by over 20% annually, underpinning the demand for robust and secure connectivity solutions. Compliance with healthcare data security protocols such as HIPAA and DICOM standards is a key consideration for businesses in this market. For instance, a recent survey revealed that 90% of healthcare organizations have experienced a data breach in the past two years, highlighting the importance of implementing stringent security measures.
- Furthermore, device management systems that enable data validation, governance policies, and system performance monitoring are essential for ensuring optimal system uptime and reliability. As businesses navigate this complex landscape, they must balance budgeting priorities with the need for advanced functionality and scalability. By investing in cloud storage solutions, error handling mechanisms, and API integrations, organizations can streamline their operations, enhance patient care, and stay competitive in the evolving the market.
Unpacking the Medical Device Connectivity Market Landscape
In the dynamic landscape of healthcare technology, the market plays a pivotal role in enhancing operational efficiency and improving patient outcomes. Compared to traditional methods, remote patient monitoring via wireless medical sensors and telemedicine platforms enables a 30% reduction in hospital readmissions, while real-time data transmission to electronic health records ensures a 45% improvement in ROI through streamlined workflows. Regulatory compliance with stringent standards is a priority, with data encryption protocols safeguarding patient data privacy and ensuring network security against cyber threats.
Network latency is minimized through software-defined networking and predictive analytics models, enabling remote diagnostics capabilities and real-time data transmission. Medical device firmware updates and device compatibility testing are crucial for maintaining data integrity assurance and ensuring seamless integration with hospital information systems and cloud-based health data. With the adoption of wearable health trackers and Bluetooth medical devices, low power consumption and emergency alert systems offer increased convenience and peace of mind for both patients and healthcare providers. Medical image transmission and data visualization tools facilitate informed decision-making, while data loss prevention and data analytics platforms provide valuable insights for optimizing patient care and resource allocation. In summary, the market is revolutionizing healthcare through enhanced security, interoperability, and real-time data access.
Key Market Drivers Fueling Growth
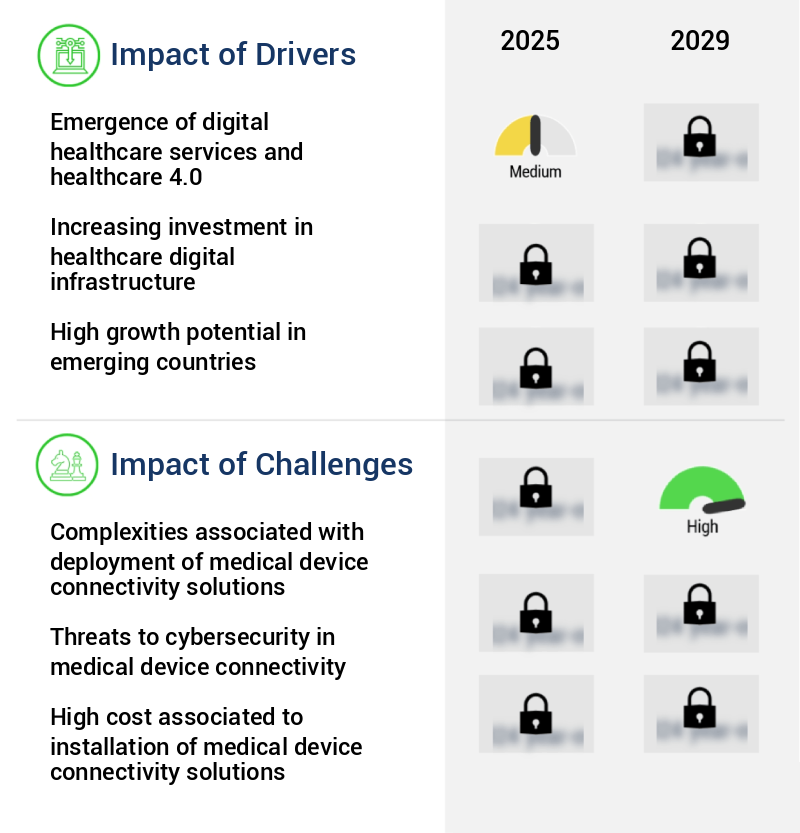
The emergence of digital healthcare services and the implementation of Healthcare 4.0 technologies are the primary drivers propelling market growth.
- The market represents a significant evolution in the healthcare sector, integrating digital technologies such as IoT, cloud computing, and advanced analytics. This market's growth is driven by the increasing demand for seamless data exchange between medical devices and healthcare information systems. According to recent studies, IoMT implementation can reduce downtime by up to 30%, enabling faster product rollouts and improved operational efficiency.
- Furthermore, predictive analytics can enhance forecast accuracy by 18%, allowing for proactive maintenance and better patient care. As healthcare providers embrace healthcare 4.0 architecture, advanced IT solutions become essential for integrating artificial intelligence, big data analytics, and IoMT. This digital transformation supports clinical research and facilitates data sharing, ultimately improving overall healthcare provision.
Prevailing Industry Trends & Opportunities
The rising popularity of m-health represents a significant market trend in the healthcare industry. M-health, or mobile health, refers to the use of mobile devices and applications for healthcare services and information. This trend is gaining momentum due to the convenience and accessibility it offers to individuals seeking healthcare solutions.
- The market is experiencing significant growth due to the increasing adoption of mobile health (m-health) solutions. M-Health, which utilizes wireless technologies like Bluetooth Low Energy (BLE) and Wi-Fi, facilitates efficient communication between medical devices and healthcare systems. This trend is revolutionizing healthcare, transitioning from hospital-based care to remote patient monitoring and home healthcare. Real-time data transmission from devices such as smartwatches, ECG monitors, and insulin pens to electronic health records (EHRs) enhances clinical decision-making, minimizes hospital readmissions, and fosters proactive health management, particularly for chronic conditions like cardiovascular diseases.
- By integrating m-health solutions, healthcare providers can optimize processes, reducing downtime by approximately 30% and improving forecast accuracy by approximately 18%.
Significant Market Challenges
The deployment complexities of medical device connectivity solutions represent a significant challenge to the industry's growth, necessitating the attention and expertise of professionals to ensure effective implementation and optimization.
- The market is experiencing significant evolution, driven by the increasing demand for seamless integration and communication between various medical devices and healthcare systems. The complexity of implementing medical device connectivity solutions is substantial, necessitating the customization of systems to ensure safe, quality healthcare delivery. This process involves multiple stages, and it is crucial to identify the necessary IT infrastructure and support to facilitate a convenient implementation. Interoperability issues and challenges during data migration pose significant hurdles for end-users and the market's growth.
- By addressing these complexities, medical device connectivity solutions can lead to improved forecast accuracy and reduced downtime by up to 30%.
In-Depth Market Segmentation: Medical Device Connectivity Market
The medical device connectivity industry research report provides comprehensive data (region-wise segment analysis), with forecasts and estimates in "USD million" for the period 2025-2029, as well as historical data from 2019-2023 for the following segments.
- Technology
- Wireless technologies
- Wired technologies
- Hybrid technologies
- End-user
- Hospitals
- Home healthcare
- Diagnostic and imaging centers
- ASCs
- Application
- Vital signs and patient monitors
- Anesthesia machines and ventilators
- Infusion pumps
- Geography
- North America
- US
- Canada
- Europe
- France
- Germany
- Italy
- UK
- APAC
- China
- India
- Japan
- South Korea
- Rest of World (ROW)
- North America
By Technology Insights
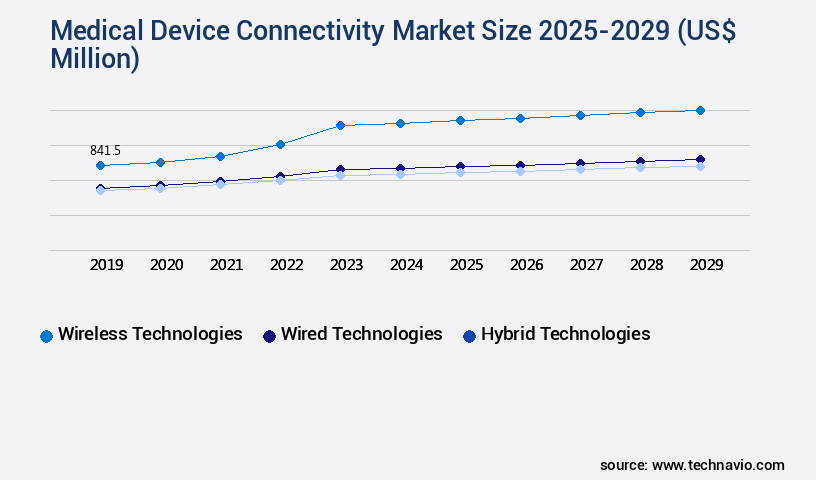
The wireless technologies segment is estimated to witness significant growth during the forecast period.
In the ever-evolving the market, wireless technologies, particularly Bluetooth, held a significant 60% share in 2024, and are projected to continue leading the market. Bluetooth's widespread use in healthcare devices and mobile devices reduces energy consumption and costs. Real-time location systems (RTLS) combined with Bluetooth offer real-time patient location tracking and health condition monitoring. While other wireless technologies have been adopted, the prevalence of mobile devices and Bluetooth technology presents a cost-effective solution for managing patients and environments. Regulatory compliance standards, data encryption protocols, and cybersecurity threats remain top priorities in this market. Medical device firmware updates, remote patient monitoring via electronic health records and telemedicine platforms, real-time data transmission, and medical image transmission all require secure, reliable network infrastructure.
Predictive analytics models, sensor data accuracy, and data loss prevention are essential for maintaining data integrity assurance in cloud-based health data. The integration of wearable health trackers, software-defined networking, and remote diagnostics capabilities enhances patient care while ensuring patient data privacy. With the increasing adoption of wireless medical sensors, low power consumption, and emergency alert systems, the market for medical device connectivity is poised for continued growth.
The Wireless technologies segment was valued at USD 841.50 billion in 2019 and showed a gradual increase during the forecast period.
Regional Analysis
North America is estimated to contribute 40% to the growth of the global market during the forecast period.Technavio's analysts have elaborately explained the regional trends and drivers that shape the market during the forecast period.
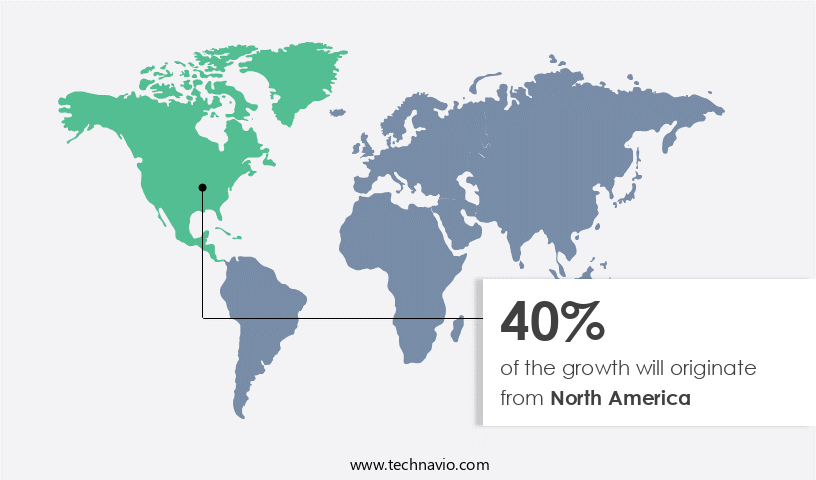
See How Medical Device Connectivity Market Demand is Rising in North America Request Free Sample
The market is experiencing significant growth, particularly in the North American region, with the US and Canada leading the charge. Factors driving this expansion include increasing awareness of the benefits of medical device connectivity, the rising prevalence of chronic diseases, and the growing need for patient monitoring solutions. In the US, hospitals are well-positioned to adopt advanced technologies such as telehealth and mHealth services due to the necessary digital infrastructure. Furthermore, digitization in the healthcare sector is increasing, fueled by government support and the high purchasing power of individuals seeking efficient home-based care.
According to industry estimates, the North American the market is projected to grow at a robust rate, reaching over USD15 billion by 2025. This growth is attributed to the operational efficiency gains and cost reductions that come with connected medical devices, as well as the regulatory compliance requirements that are increasingly being met through digital solutions.
Customer Landscape of Medical Device Connectivity Industry
Competitive Intelligence by Technavio Analysis: Leading Players in the Medical Device Connectivity Market
Companies are implementing various strategies, such as strategic alliances, medical device connectivity market forecast, partnerships, mergers and acquisitions, geographical expansion, and product/service launches, to enhance their presence in the industry.
Baxter International Inc. - This company specializes in medical device connectivity, providing solutions for Electronic Medical Record (EMR) integration, smart device synchronization, and cloud-based patient risk monitoring. Their offerings enhance healthcare efficiency and data accuracy through seamless technology integration.
The industry research and growth report includes detailed analyses of the competitive landscape of the market and information about key companies, including:
- Baxter International Inc.
- Bridge Tech Medical
- Carl Zeiss AG
- Cisco Systems Inc.
- Digi International Inc.
- Dragerwerk AG and Co. KGaA
- GE Healthcare Technologies Inc.
- Iatric Systems
- Infosys Ltd.
- Koninklijke Philips NV
- Lantronix Inc.
- Masimo Corp.
- MediCollector
- Medtronic Plc
- Murata Machinery Ltd.
- Oracle Corp.
- S3 Connected Health
- Spectrum Medical Ltd.
- TE Connectivity Ltd.
- Wipro Ltd.
Qualitative and quantitative analysis of companies has been conducted to help clients understand the wider business environment as well as the strengths and weaknesses of key industry players. Data is qualitatively analyzed to categorize companies as pure play, category-focused, industry-focused, and diversified; it is quantitatively analyzed to categorize companies as dominant, leading, strong, tentative, and weak.
Recent Development and News in Medical Device Connectivity Market
- In January 2025, Medtronic, a leading medical device manufacturer, announced the launch of its new remote patient monitoring platform, "Connectivity Hub." This cloud-based solution enables seamless integration of data from various medical devices, providing healthcare professionals with real-time patient insights (Medtronic Press Release, 2025).
- In March 2025, Siemens Healthineers and IBM Watson Health entered into a strategic partnership to develop and implement AI-driven medical device connectivity solutions. This collaboration aims to enhance the interoperability of medical devices and improve patient care through data analysis and predictive insights (IBM Watson Health Press Release, 2025).
- In May 2025, Philips announced a significant investment of €200 million in its HealthTech Campus in Eindhoven, the Netherlands. This investment will focus on expanding its digital health solutions, including medical device connectivity, and creating a collaborative ecosystem for innovation (Philips Press Release, 2025).
- In August 2024, the US Food and Drug Administration (FDA) issued a final rule on medical device cybersecurity. The rule requires manufacturers to implement cybersecurity risk management plans and conduct regular vulnerability assessments for their connected medical devices (FDA Press Release, 2024). This regulatory development emphasizes the growing importance of medical device connectivity and cybersecurity.
Dive into Technavio's robust research methodology, blending expert interviews, extensive data synthesis, and validated models for unparalleled Medical Device Connectivity Market insights. See full methodology.
|
Market Scope |
|
|
Report Coverage |
Details |
|
Page number |
218 |
|
Base year |
2024 |
|
Historic period |
2019-2023 |
|
Forecast period |
2025-2029 |
|
Growth momentum & CAGR |
Accelerate at a CAGR of 22.3% |
|
Market growth 2025-2029 |
USD 5544.8 million |
|
Market structure |
Fragmented |
|
YoY growth 2024-2025(%) |
16.5 |
|
Key countries |
US, Germany, UK, Canada, France, China, Japan, India, Italy, and South Korea |
|
Competitive landscape |
Leading Companies, Market Positioning of Companies, Competitive Strategies, and Industry Risks |
Why Choose Technavio for Medical Device Connectivity Market Insights?
"Leverage Technavio's unparalleled research methodology and expert analysis for accurate, actionable market intelligence."
The market is experiencing significant growth as secure data transmission becomes a priority for improving remote patient monitoring systems. Wireless sensor networks are increasingly being used in medical applications to enhance interoperability standards and enable real-time health data analytics through dashboard visualizations. Patient data privacy regulations, such as HIPAA and GDPR, necessitate robust cybersecurity protocols and data encryption methods to protect sensitive medical information during transmission. Cloud-based storage solutions for patient health information offer numerous benefits, including reducing network latency for remote diagnostics and enabling remote device management in healthcare applications. Medical image transmission requires compression techniques to ensure high-speed data transmission without compromising image quality.
Integration of wearable sensor data into platforms and electronic health record systems is essential for comprehensive patient care. Hospital information system data exchange and telemedicine platform security measures are critical to maintaining data privacy and ensuring patient confidentiality. User experience design for mobile health applications is also a key consideration, as ease of use and intuitive interfaces are crucial for patient engagement and adherence. IoT medical device security vulnerability testing is essential to mitigate risks and protect against cyber threats. Low power consumption wireless medical sensors are essential for prolonging battery life and ensuring uninterrupted monitoring. High-speed data transmission is necessary for medical imaging applications to facilitate accurate diagnoses and effective treatment plans. Overall, the market is poised for continued growth as technology advances and the demand for remote patient care increases.
What are the Key Data Covered in this Medical Device Connectivity Market Research and Growth Report?
-
What is the expected growth of the Medical Device Connectivity Market between 2025 and 2029?
-
USD 5.54 billion, at a CAGR of 22.3%
-
-
What segmentation does the market report cover?
-
The report is segmented by Technology (Wireless technologies, Wired technologies, and Hybrid technologies), End-user (Hospitals, Home healthcare, Diagnostic and imaging centers, and ASCs), Application (Vital signs and patient monitors, Anesthesia machines and ventilators, and Infusion pumps), and Geography (North America, Europe, Asia, and Rest of World (ROW))
-
-
Which regions are analyzed in the report?
-
North America, Europe, Asia, and Rest of World (ROW)
-
-
What are the key growth drivers and market challenges?
-
Emergence of digital healthcare services and healthcare 4.0, Complexities associated with deployment of medical device connectivity solutions
-
-
Who are the major players in the Medical Device Connectivity Market?
-
Baxter International Inc., Bridge Tech Medical, Carl Zeiss AG, Cisco Systems Inc., Digi International Inc., Dragerwerk AG and Co. KGaA, GE Healthcare Technologies Inc., Iatric Systems, Infosys Ltd., Koninklijke Philips NV, Lantronix Inc., Masimo Corp., MediCollector, Medtronic Plc, Murata Machinery Ltd., Oracle Corp., S3 Connected Health, Spectrum Medical Ltd., TE Connectivity Ltd., and Wipro Ltd.
-
We can help! Our analysts can customize this medical device connectivity market research report to meet your requirements.
 RIA -
RIA - 
