Medical Device Contract Manufacturing Market Size 2025-2029
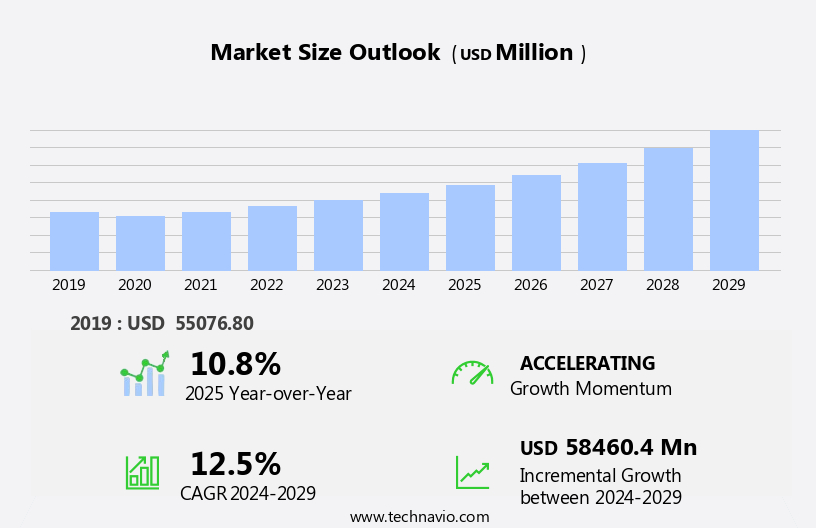
The medical device contract manufacturing market size is forecast to increase by USD 58.46 billion, at a CAGR of 12.5% between 2024 and 2029.
- The market is experiencing significant shifts driven by the integration of Industry 4.0 technologies and the growing preference for point-of-care testing. Industry 4.0, characterized by advanced automation and interconnected systems, is revolutionizing manufacturing processes, enabling medical device companies to improve efficiency, reduce costs, and enhance product quality. Simultaneously, the trend toward point-of-care testing is gaining momentum, with an increasing focus on decentralized healthcare services and real-time patient monitoring. However, this market is not without challenges. Stringent regulations governing medical device manufacturing pose significant hurdles for contract manufacturers. Compliance with these regulations requires substantial investments in infrastructure, technology, and human resources.
- Additionally, maintaining the highest standards of quality and ensuring regulatory compliance can be a complex and time-consuming process. Companies must navigate these challenges effectively to capitalize on the opportunities presented by Industry 4.0 and the shift to point-of-care testing. To succeed, they must invest in advanced technologies, establish robust quality control systems, and maintain a deep understanding of regulatory requirements. By doing so, they can streamline their manufacturing processes, reduce costs, and deliver high-quality medical devices to meet the evolving needs of healthcare providers and patients.
What will be the Size of the Medical Device Contract Manufacturing Market during the forecast period?
Explore in-depth regional segment analysis with market size data - historical 2019-2023 and forecasts 2025-2029 - in the full report.
Request Free Sample
The market continues to evolve, driven by advancements in technology and the expanding application of medical devices across various sectors. Entities such as surface treatments, CNC machining, risk management, design and development, design control, product recall, ERP systems, neurological devices, medical grade materials, cardiology devices, on-time delivery, and precision machining play integral roles in this dynamic industry. Surface treatments, for instance, enhance the performance and longevity of medical devices, while CNC machining ensures precise manufacturing of complex components. Risk management and design control mitigate potential hazards and ensure regulatory compliance, enabling the production of safe and effective medical devices.
Neurological devices and cardiology devices, which require high levels of accuracy and reliability, are increasingly being manufactured using advanced technologies like ERP systems and 3D printing. Medical grade materials, such as stainless steel and implantable materials, undergo rigorous testing and verification to ensure biocompatibility and sterility assurance. On-time delivery and precision machining are crucial for maintaining customer satisfaction, while inventory management and component sourcing contribute to efficient supply chain operations. Manufacturing process validation, quality metrics, and data analytics further enhance the overall quality and performance of medical devices. The ongoing unfolding of market activities reveals evolving patterns in medical device manufacturing, with a focus on continuous improvement, innovation, and regulatory compliance.
Entities involved in this industry must stay abreast of the latest trends and technologies to remain competitive and meet the evolving needs of the healthcare sector.
How is this Medical Device Contract Manufacturing Industry segmented?
The medical device contract manufacturing industry research report provides comprehensive data (region-wise segment analysis), with forecasts and estimates in "USD million" for the period 2025-2029, as well as historical data from 2019-2023 for the following segments.
- Device
- IVD
- Drug delivery
- Diagnostic Imaging
- Cardiovascular
- Others
- End-user
- OEMs
- Pharmaceutical and biopharmaceutical companies
- Others
- Type
- Class I Devices
- Class II Devices
- Class III Devices
- Service Type
- Device Development & Manufacturing Services
- Quality Management Services
- Assembly & Packaging Services
- Application
- Cardiology
- Orthopedics
- Neurology
- Oncology
- Distribution Channel
- Direct Sales
- Third-Party Distributors
- Online Platforms
- Geography
- North America
- US
- Canada
- Europe
- France
- Germany
- Italy
- UK
- APAC
- China
- India
- Japan
- South Korea
- Rest of World (ROW)
- North America
By Device Insights
The ivd segment is estimated to witness significant growth during the forecast period.
The market encompasses various segments, with the in vitro diagnostics (IVD) sector holding significant importance. IVD devices are integral to diagnosing diseases, conditions, and infections through sample testing, ranging from home-use kits to sophisticated laboratory equipment. The market's growth is fueled by the escalating prevalence of chronic diseases, an aging population, and the necessity for early and precise diagnostics. Contract manufacturing in the IVD segment offers medical device companies numerous advantages, including access to specialized expertise, advanced technologies, and regulatory compliance assistance. This collaboration streamlines time-to-market and production costs. Packaging materials, software validation, and quality control are crucial elements in IVD manufacturing.
Injection molding, precision engineering, and surface treatments are essential for producing high-quality components. Risk management, design and development, and design control ensure regulatory compliance and product safety. Advanced technologies like additive manufacturing, 3D printing, and mes systems are transforming IVD manufacturing processes. Sterility assurance, biocompatibility testing, and materials science are integral to maintaining the highest standards. Inventory management, cleanroom technology, and testing and verification are essential for maintaining efficient and effective manufacturing operations. The market's evolving trends include the increasing adoption of ERP systems, on-time delivery, and customer satisfaction. Medical grade materials, such as stainless steel, play a vital role in manufacturing various IVD devices.
Overall, the IVD segment's market dynamics reflect the industry's continuous innovation and commitment to delivering reliable, high-quality diagnostic solutions.
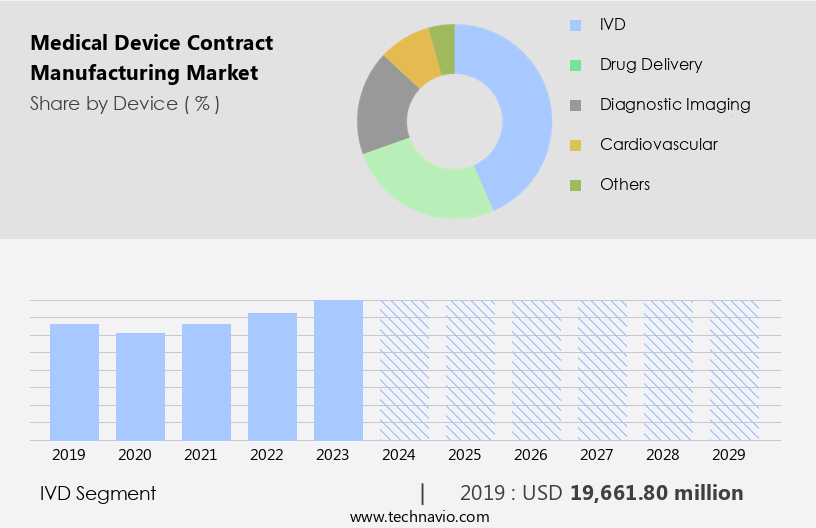
The IVD segment was valued at USD 19.66 billion in 2019 and showed a gradual increase during the forecast period.
Regional Analysis
North America is estimated to contribute 40% to the growth of the global market during the forecast period.Technavio’s analysts have elaborately explained the regional trends and drivers that shape the market during the forecast period.
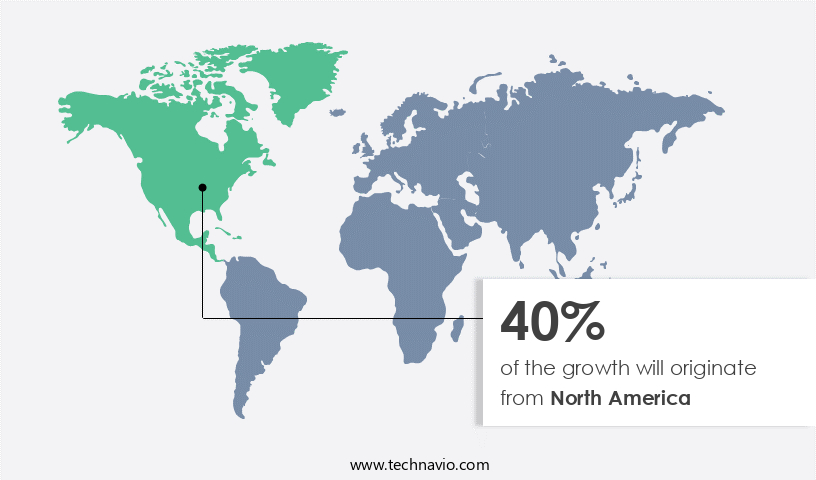
The North American the market is thriving, fueled by a sophisticated healthcare infrastructure and a concentration of prominent medical device companies in the US. This region's dominance is attributed to advanced technological capabilities, substantial healthcare expenditures, a growing aging population, and a favorable regulatory environment. Numerous contract manufacturers operate in various sectors, including diagnostics, orthopedics, and cardiovascular devices. The market's expansion is further driven by advancements in medical technology and the COVID-19 pandemic's increased demand for rapid and dependable diagnostic devices. Contract manufacturers have played a crucial role in scaling production to address the urgent need for these devices.
Medical device manufacturing encompasses diverse processes such as injection molding, precision engineering, surface treatments, CNC machining, risk management, design and development, design control, and manufacturing process validation. Quality assurance measures, including sterility assurance, biocompatibility testing, and materials science, are integral to the production of medical-grade materials for neurological devices, cardiology devices, and implantable devices. The market's success is underpinned by efficient supply chain management, on-time delivery, and customer satisfaction. Additionally, technologies like cleanroom technology, 3D printing, ERP systems, and MES systems are transforming the industry.
Market Dynamics
Our researchers analyzed the data with 2024 as the base year, along with the key drivers, trends, and challenges. A holistic analysis of drivers will help companies refine their marketing strategies to gain a competitive advantage.
In the dynamic and innovative medical device industry, contract manufacturing plays a pivotal role in bringing cutting-edge solutions to market. Medical device contract manufacturers (MDCMs) leverage advanced technologies such as automation, robotics, and 3D printing to produce high-quality devices that adhere to stringent regulatory requirements. These MDCMs specialize in various medical device categories, including cardiovascular, orthopedic, diagnostic, and surgical devices. They offer services like design for manufacturing, prototyping, injection molding, assembly, and sterilization, ensuring a seamless transition from concept to commercialization. Collaborating with MDCMs allows medical device OEMs to focus on their core competencies, while benefiting from economies of scale, reduced time-to-market, and access to specialized expertise. By prioritizing quality, regulatory compliance, and innovation, medical device contract manufacturing partners contribute significantly to the medical technology ecosystem.
What are the key market drivers leading to the rise in the adoption of Medical Device Contract Manufacturing Industry?
- The impact of Industry 4.0 significantly drives the growth of the medical device market. This technological revolution, characterized by the integration of advanced technologies such as the Internet of Things (IoT), artificial intelligence (AI), and robotics, transforms the medical device industry by enhancing efficiency, improving patient care, and enabling personalized medicine.
- The medical device industry is witnessing significant advancements in the production of complex Class III devices, such as orthopedic implants and pharmaceutical packaging systems. However, manufacturing these devices in large quantities presents challenges due to intricate assembly and testing processes. Compliance with regulatory frameworks and standards, including post-market surveillance, defect rate reduction, and quality control, is also essential. To address these challenges, medical device original equipment manufacturers (OEMs) are partnering with contract manufacturing services providers. These service providers offer expertise in automated manufacturing and fabrication technologies, including injection molding, precision engineering, coating technologies, software validation, and additive manufacturing.
- By leveraging these capabilities, OEMs can ensure high-quality manufacturing systems, regulatory compliance, and efficient production processes. Moreover, the use of advanced technologies like packaging materials and software validation enables medical device manufacturers to improve product traceability and component verification. These technologies also facilitate better storage and access, ensuring the safety and efficacy of medical devices throughout their lifecycle. Overall, the partnership between medical device OEMs and contract manufacturing services providers is crucial in addressing the complexities of manufacturing Class III devices while ensuring regulatory compliance and maintaining high-quality standards.
What are the market trends shaping the Medical Device Contract Manufacturing Industry?
- The transition from centralized to point-of-care testing is an emerging trend in the healthcare industry. Point-of-care testing enables immediate diagnosis and treatment, offering numerous benefits such as increased efficiency, reduced costs, and improved patient outcomes.
- The market is experiencing a notable transition from centralized laboratory testing to point-of-care testing (POCT). Centralized laboratories, which have long dominated the diagnostic sector through automated analytical methods, are now being challenged by POCT devices. Initially popular in clinical chemistry and hematology, POCT technology is expanding to immunoassays and molecular diagnostics. POCT devices offer several advantages, including affordability, ease of use, and rapid result delivery, which are essential for timely medical diagnosis and treatment decisions. This trend is fueled by the growing emphasis on patient-centric healthcare, prioritizing patient convenience over provider convenience.
- Additionally, the implementation of advanced technologies such as surface treatments, CNC machining, and ERP systems, along with the use of medical-grade materials in the manufacturing of neurological and cardiology devices, further enhances the reliability and precision of these devices. On-time delivery and high-quality precision machining are also crucial factors driving the market's growth.
What challenges does the Medical Device Contract Manufacturing Industry face during its growth?
- The stringent regulations governing medical device manufacturing pose a significant challenge to the industry's growth, requiring robust compliance strategies and substantial investments in research and development to ensure products meet rigorous safety and efficacy standards.
- In the market, regulatory compliance plays a pivotal role. Strict regulations set by authorities like the FDA, EMA, and others govern every stage of manufacturing, from design and development to production and post-market surveillance. Ensuring adherence to these regulations necessitates comprehensive documentation, quality management systems, and frequent audits, which can be time-consuming and costly. Moreover, regulations are subject to frequent updates, necessitating continuous process and system adaptations from contract manufacturers. Failure to comply can result in hefty fines, product recalls, and reputational damage. Consequently, contract manufacturers must assemble proficient regulatory affairs teams and maintain stringent standards to navigate this intricate regulatory landscape effectively.
- Component sourcing, supply chain management, and quality assurance are other critical aspects of the market. Contract manufacturers leverage advanced technologies like 3D printing, software development, sterility assurance, biocompatibility testing, and materials science to ensure product excellence. By focusing on customer satisfaction and maintaining a harmonious balance between innovation and regulatory compliance, contract manufacturers can establish a competitive edge in this market.
Exclusive Customer Landscape
The medical device contract manufacturing market forecasting report includes the adoption lifecycle of the market, covering from the innovator’s stage to the laggard’s stage. It focuses on adoption rates in different regions based on penetration. Furthermore, the medical device contract manufacturing market report also includes key purchase criteria and drivers of price sensitivity to help companies evaluate and develop their market growth analysis strategies.

Customer Landscape
Key Companies & Market Insights
Companies are implementing various strategies, such as strategic alliances, medical device contract manufacturing market forecast, partnerships, mergers and acquisitions, geographical expansion, and product/service launches, to enhance their presence in the industry.
Benchmark Electronics Inc. - We specialize in contract manufacturing for advanced medical devices, including optical imaging, medical robotics, radiological imaging, and handheld devices, utilizing cutting-edge technology and adhering to stringent industry standards. Our expertise in these areas drives innovative solutions and enhances market exposure for our clients.
The industry research and growth report includes detailed analyses of the competitive landscape of the market and information about key companies, including:
- Benchmark Electronics Inc.
- Celestica Inc.
- Flex Ltd.
- Gerresheimer AG
- Integer Holdings Corp.
- Jabil Inc.
- Kimball Electronics Inc.
- Nemera Group
- Nipro Corp.
- Nordson Corp.
- Nortech Systems Inc.
- Plexus Corp.
- Recipharm AB
- Sanmina Corp.
- Scientific Molding Corp. Ltd.
- TE Connectivity Ltd.
- Tecomet Inc.
- Teleflex Inc.
- Tessy Plastics Corp.
- West Pharmaceutical Services Inc.
Qualitative and quantitative analysis of companies has been conducted to help clients understand the wider business environment as well as the strengths and weaknesses of key industry players. Data is qualitatively analyzed to categorize companies as pure play, category-focused, industry-focused, and diversified; it is quantitatively analyzed to categorize companies as dominant, leading, strong, tentative, and weak.
Recent Development and News in Medical Device Contract Manufacturing Market
- In January 2024, Medtronic plc, a leading global healthcare solutions company, announced the acquisition of Mazor Robotics, a pioneer in robotic-assisted spine and brain surgery, to expand its portfolio in the medical device contract manufacturing sector. The deal was valued at approximately USD1.64 billion (Business Wire).
- In March 2024, Jabil Healthcare, a leading healthcare manufacturing solutions provider, opened a new 150,000 square-foot facility in Costa Rica, increasing its manufacturing capacity and strengthening its presence in Latin America (Jabil Press Release).
- In April 2025, Flextronics, a global real-time manufacturing solutions provider, entered into a strategic partnership with Stryker Corporation, a medical technology company, to manufacture and distribute Stryker's neuro and spine products. The partnership aims to improve operational efficiency and reduce costs for Stryker (Flextronics Press Release).
- In May 2025, the U.S. Food and Drug Administration (FDA) granted 510(k) clearance to Smiths Medical, a leading global medical device manufacturer, for its new Sharp Safety IV Set with EZ-Tap Plus. This development marks a significant advancement in safety features for intravenous (IV) therapy and further strengthens Smiths Medical's position in the market (Smiths Medical Press Release).
Research Analyst Overview
- The market is characterized by a focus on innovation and efficiency, with wearable sensors and telemedicine devices leading the charge. Supply chain optimization is a key trend, as manufacturers seek to streamline processes and reduce costs through strategic partnerships and global supply chains. User experience (UX) and user interface (UI) design are paramount, ensuring devices are intuitive and easy to use for both healthcare providers and patients. Data security is a top concern, with stringent regulations requiring robust compliance certification and validation reports. Cost reduction remains a significant driver, with engineering services, consulting, and training programs offering valuable insights for manufacturers.
- Quality audits and technical documentation are essential components of the contract negotiation process, while capacity planning and pricing strategies are critical for long-term success. Cloud computing and big data analytics are transforming the industry, enabling real-time data access and machine learning (ML) capabilities for process improvement and predictive maintenance. Lean manufacturing, six sigma, and project management methodologies are also prevalent, ensuring efficient production and regulatory compliance. Intellectual property considerations are crucial, with ethical considerations and human factors engineering playing essential roles in product design. Regulatory affairs and artificial intelligence (AI) are also shaping the landscape, with AI enabling more accurate medical imaging and regulatory compliance through automated processes.
- In the realm of sales and marketing, capacity planning and pricing strategies are essential for success. Contract negotiation and compliance certification are ongoing challenges, with technical documentation and training programs crucial for ensuring a smooth transition to new manufacturing partners. Overall, the market is dynamic and complex, requiring a deep understanding of various trends and best practices to stay competitive. From wearable sensors to telemedicine devices, manufacturers must navigate a range of challenges, including data security, cost reduction, and regulatory compliance, while maintaining a focus on user experience and innovation.
Dive into Technavio’s robust research methodology, blending expert interviews, extensive data synthesis, and validated models for unparalleled Medical Device Contract Manufacturing Market insights. See full methodology.
|
Market Scope |
|
|
Report Coverage |
Details |
|
Page number |
198 |
|
Base year |
2024 |
|
Historic period |
2019-2023 |
|
Forecast period |
2025-2029 |
|
Growth momentum & CAGR |
Accelerate at a CAGR of 12.5% |
|
Market growth 2025-2029 |
USD 58460.4 million |
|
Market structure |
Fragmented |
|
YoY growth 2024-2025(%) |
10.8 |
|
Key countries |
US, Germany, Canada, China, UK, France, Japan, India, Italy, and South Korea |
|
Competitive landscape |
Leading Companies, Market Positioning of Companies, Competitive Strategies, and Industry Risks |
What are the Key Data Covered in this Medical Device Contract Manufacturing Market Research and Growth Report?
- CAGR of the Medical Device Contract Manufacturing industry during the forecast period
- Detailed information on factors that will drive the growth and forecasting between 2025 and 2029
- Precise estimation of the size of the market and its contribution of the industry in focus to the parent market
- Accurate predictions about upcoming growth and trends and changes in consumer behaviour
- Growth of the market across North America, Europe, Asia, and Rest of World (ROW)
- Thorough analysis of the market’s competitive landscape and detailed information about companies
- Comprehensive analysis of factors that will challenge the medical device contract manufacturing market growth of industry companies
We can help! Our analysts can customize this medical device contract manufacturing market research report to meet your requirements.
 RIA -
RIA - 
