Membrane For Food And Beverage Processing Market Size 2026-2030
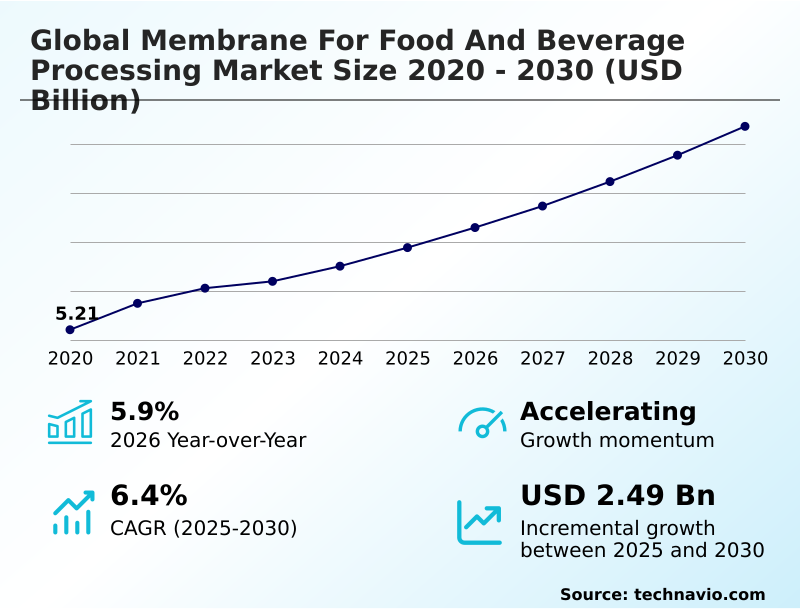
The Membrane For Food And Beverage Processing Market size was valued at USD 6.89 billion in 2025, growing at a CAGR of 6.4% during the forecast period 2026-2030.
Major Market Trends & Insights
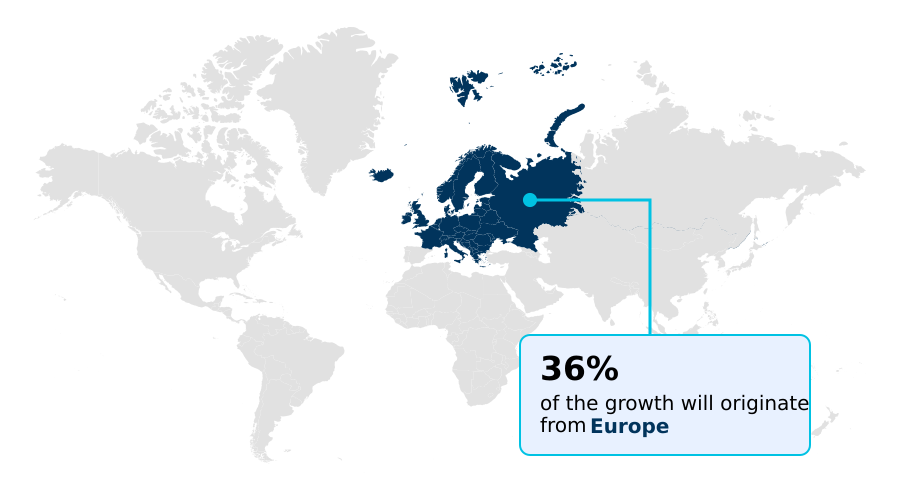
- Europe dominated the market and accounted for a 36% growth during the forecast period.
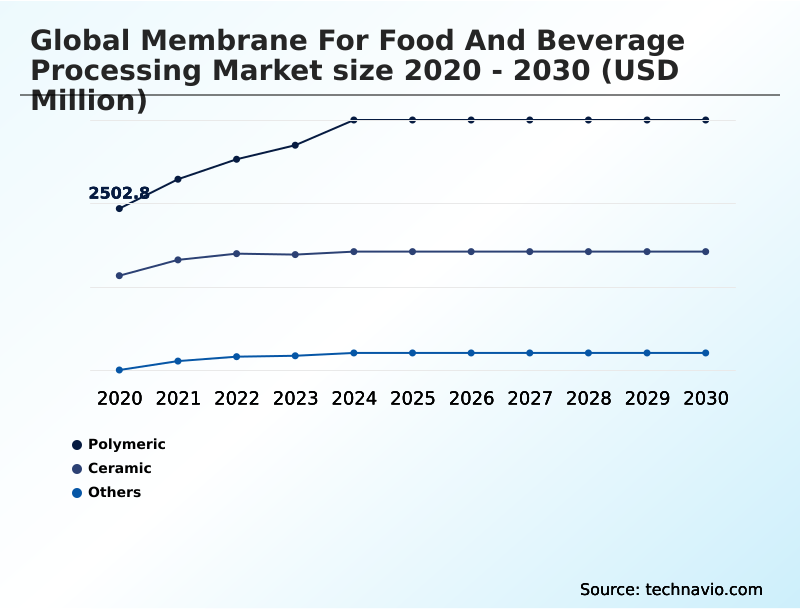
- By Material - Polymeric segment was valued at USD 3.40 billion in 2024
- By Technology - Microfiltration segment accounted for the largest market revenue share in 2024
Market Size & Forecast
- Historic Market Opportunities 2020-2024: USD 4.17 billion
- Market Future Opportunities 2025-2030: USD 2.49 billion
- CAGR from 2025 to 2030 : 6.4%
Market Summary
- The membrane for food and beverage processing market is defined by a strong focus on precision separation, with polymeric membranes commanding over 50% of material usage due to their versatility and lower capital expenditure.
- Adoption in the dairy sector, which accounts for a substantial portion of applications, has shown that using microfiltration can reduce microbial loads by up to 99%, significantly extending product shelf life without thermal degradation.
- A typical operational scenario involves a juice manufacturer implementing ultrafiltration to replace traditional diatomaceous earth filtration, which not only eliminates disposable filter aids but also improves yield by 5%. A key driver is the stringent regulatory pressure for food safety, compelling producers to adopt verifiable filtration methods.
- However, a primary challenge remains the operational complexities associated with membrane fouling, which can deter smaller processors from transitioning away from legacy systems.
What will be the Size of the Membrane For Food And Beverage Processing Market during the forecast period?
Get Key Insights on Market Forecast (PDF) Request Free Sample
How is the Membrane For Food And Beverage Processing Market Segmented?
The membrane for food and beverage processing industry research report provides comprehensive data (region-wise segment analysis), with forecasts and analysis for the period 2026-2030, as well as historical data from 2020-2024 for the following segments.
- Material
- Polymeric
- Ceramic
- Others
- Technology
- Microfiltration
- Reverse osmosis
- Ultrafiltration
- Nanofiltration
- Others
- Application
- Dairy processing
- Beverages
- Food processing
- Water and wastewater treatment
- Others
- Geography
- Europe
- Germany
- France
- UK
- North America
- US
- Canada
- Mexico
- APAC
- China
- Japan
- India
- Middle East and Africa
- Saudi Arabia
- UAE
- South Africa
- South America
- Brazil
- Argentina
- Colombia
- Rest of World (ROW)
- Europe
How is the Membrane For Food And Beverage Processing Market Segmented by Material?
The polymeric segment is estimated to witness significant growth during the forecast period.
Polymeric membranes represent the largest market segment, accounting for over 52% of material usage due to their cost-effectiveness and versatility. These materials, including polyethersulfone (PES) and polyvinylidene fluoride (PVDF), are integral to core processes like juice clarification and protein fractionation.
Their adoption allows for the creation of spiral-wound modules and hollow-fiber membranes, which are critical for large-scale operations. Innovations in hydrophilic surface coatings have improved fouling resistance, extending operational cycles by up to 25% compared to uncoated predecessors.
This focus on enhancing material properties is a direct response to industry demands for greater operational efficiency and reduced downtime during cleaning-in-place (CIP) procedures in beverage stabilization and dairy processing applications.
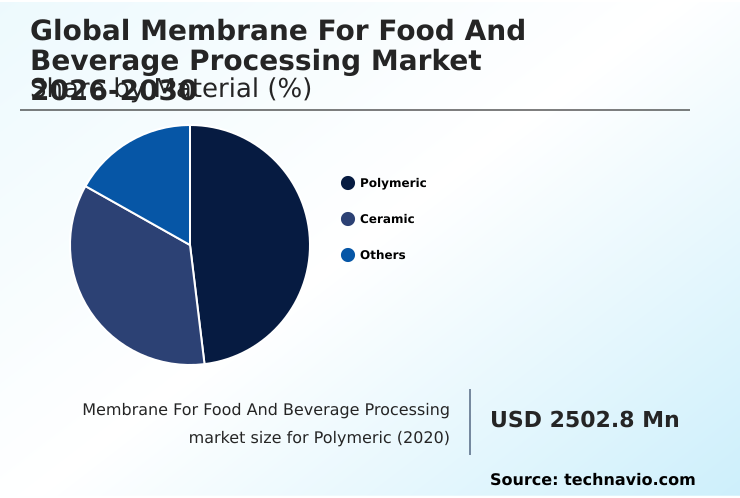
The Polymeric segment was valued at USD 3.40 billion in 2024 and showed a gradual increase during the forecast period.
How demand for the Membrane For Food And Beverage Processing market is rising in the leading region?
Europe is estimated to contribute 36% to the growth of the global market during the forecast period.Technavio’s analysts have elaborately explained the regional trends and drivers that shape the market during the forecast period.
See How Membrane For Food And Beverage Processing Market demand is rising in Europe Request Free Sample
Regional dynamics in the membrane for food and beverage processing market are shaped by regulatory environments and industrial maturity.
Europe, contributing 36% of the market's incremental growth, leads in adoption due to its stringent food safety standards, with countries like Germany and France at the forefront of using ultrafiltration in dairy processing.
In contrast, the APAC region, with a projected CAGR of 7.4%, focuses more on implementing reverse osmosis for water purification to meet the demands of a rapidly growing middle class.
This differs from North America's emphasis on specialty applications like plant-based protein concentration and sterile filtration.
This technological divergence results in European facilities achieving up to 20% higher water recovery rates in dairy processing compared to standard facilities in emerging APAC markets, highlighting the impact of regional priorities on technology adoption and operational efficiency.
What are the key Drivers, Trends, and Challenges in the Membrane For Food And Beverage Processing Market?
Our researchers analyzed the data with 2025 as the base year, along with the key drivers, trends, and challenges. A holistic analysis of drivers will help companies refine their marketing strategies to gain a competitive advantage.
- When evaluating processing technologies, a key decision for manufacturers is comparing polymeric vs ceramic membrane for juice clarification. While polymeric options present a lower initial capital expenditure, ceramic membranes offer superior durability and can withstand more aggressive cleaning protocols, a crucial factor in maintaining consistent permeate flux.
- A persistent operational issue across all systems is managing reverse osmosis membrane fouling control methods, as unchecked biofilm growth can decrease throughput by over 30% and significantly increase energy consumption. To counter this, facilities are implementing advanced pretreatment and automated backwashing cycles.
- In the high-value dairy sector, ultrafiltration for whey protein concentration is a cornerstone technology, enabling the creation of ingredients for the functional food market. The primary benefits of microfiltration in dairy processing include a significant reduction in microbial load without thermal impact, which preserves the taste and nutritional value of fresh milk. This non-thermal processing advantage is a key differentiator.
- Finally, understanding the nanofiltration for water demineralization cost is essential in applications like infant formula, where precise mineral content is non-negotiable. Optimizing these systems can lead to a more than 15% reduction in energy usage compared to less selective separation techniques.

What are the key market drivers leading to the rise in the adoption of Membrane For Food And Beverage Processing Industry?
- A heightened focus on mitigating food contamination is a key driver propelling the adoption of membrane technologies in the food and beverage processing market.
- A significant driver for the membrane for food and beverage processing market is the increasing focus on mitigating food contamination and ensuring compliance with rigorous food safety standards.
- Membrane systems provide a verifiable physical barrier for microbial reduction, with microfiltration capable of removing up to 99.9% of specific pathogens, directly improving product shelf life and safety.
- Stricter regulations on food quality, such as mandates for protein standardization in dairy products, further accelerate adoption.
- Processors using membrane technology can achieve protein content consistency within a 1% tolerance, a level of precision that is nearly impossible with traditional methods.
- This auditable performance is critical for maintaining supply chain credibility and meeting the stringent requirements of global food and beverage markets, linking regulatory pressure directly to technology investment for operational efficiency.
What are the market trends shaping the Membrane For Food And Beverage Processing Industry?
- The expanding utilization of diverse polymeric materials is a significant upcoming trend in the market. This shift is driven by the demand for enhanced separation efficiency, cost-effectiveness, and operational flexibility in food and beverage processing.
- A primary trend in the membrane for food and beverage processing market is the growing demand for nutrient-specific foods, which relies on precision separation technologies such as ultrafiltration and nanofiltration. This shift enables manufacturers to create products like protein-fortified beverages with a 20% higher protein concentration while selectively removing undesired components like lactose or excess sugars.
- This trend is driven by consumer demand for healthier and functional food options. Consequently, businesses are investing in advanced membrane systems to achieve the molecular weight cut-off required for producing these specialized products.
- This allows for the development of clean-label foods, aligning with market demands for natural and minimally processed goods, and showcasing the direct link between consumer behavior and technology adoption in process water treatment and beyond.
What challenges does the Membrane For Food And Beverage Processing Industry face during its growth?
- The persistent use of alternative filtration technologies presents a significant challenge to market growth, hindering the broader adoption of advanced membrane systems.
- A primary challenge confronting the membrane for food and beverage processing market is the persistent use of alternate filtration technologies, despite these legacy systems being up to 25% less energy-efficient. The high initial capital expenditure for advanced membrane systems deters many small to medium-sized processors.
- Furthermore, membrane fouling remains a critical operational issue, particularly in applications like dairy ultrafiltration, where it can reduce membrane lifespan by as much as 40%. This frequent need for replacement increases operational costs and downtime, complicating the return-on-investment calculation.
- Overcoming these hurdles requires demonstrating clear long-term economic benefits and developing more robust, fouling-resistant membranes to reduce the maintenance burden and overall cost of ownership.
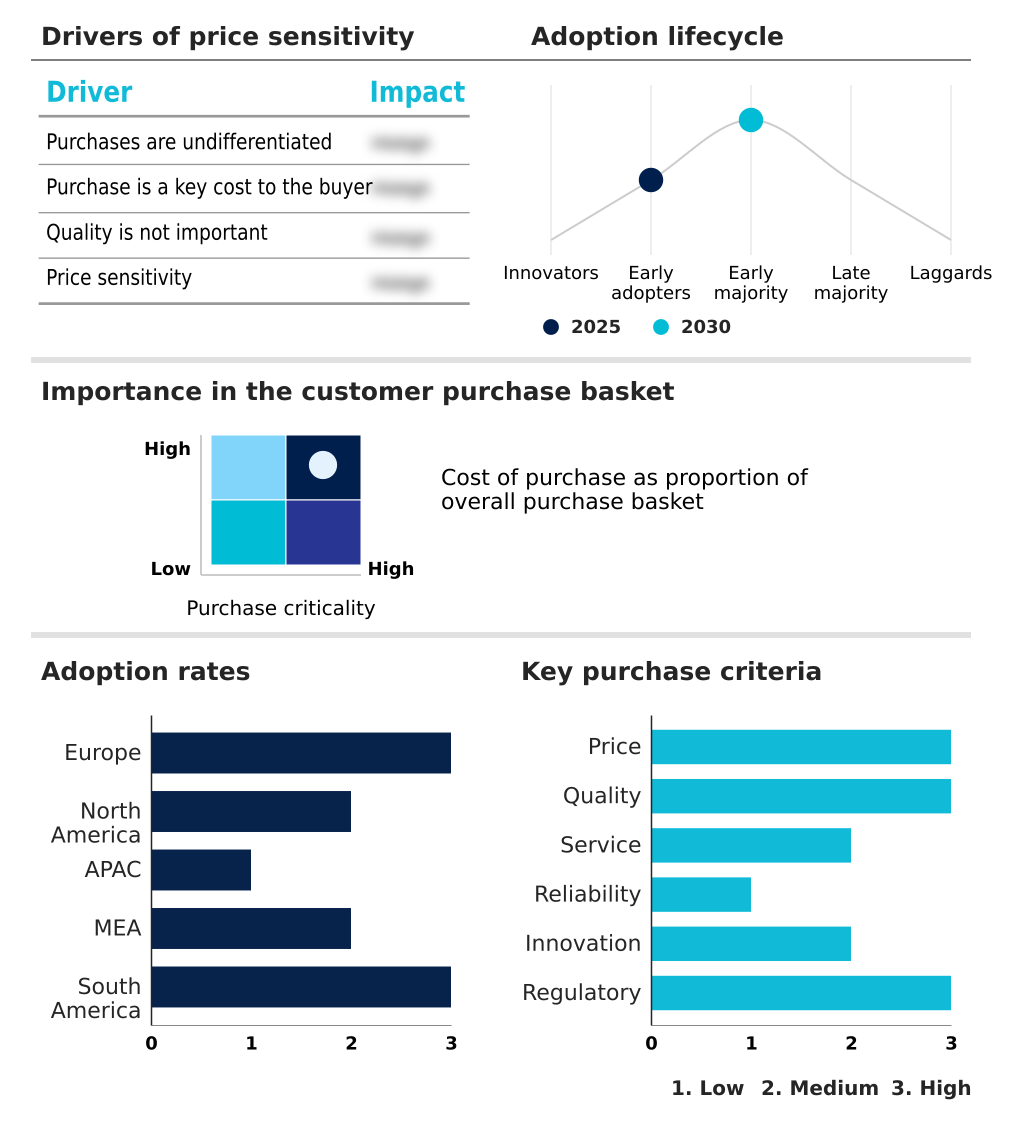
Exclusive Technavio Analysis on Customer Landscape
The membrane for food and beverage processing market forecasting report includes the adoption lifecycle of the market, covering from the innovator’s stage to the laggard’s stage. It focuses on adoption rates in different regions based on penetration. Furthermore, the membrane for food and beverage processing market report also includes key purchase criteria and drivers of price sensitivity to help companies evaluate and develop their market growth analysis strategies.
Customer Landscape of Membrane For Food And Beverage Processing Industry
Competitive Landscape
Companies are implementing various strategies, such as strategic alliances, membrane for food and beverage processing market forecast, partnerships, mergers and acquisitions, geographical expansion, and product/service launches, to enhance their presence in the industry.
3M Co. - Offerings include specialized microfiltration membranes, such as Liqui-Flux MF-PP, designed to enhance food and beverage processing safety and operational efficiency.
The industry research and growth report includes detailed analyses of the competitive landscape of the market and information about key companies, including:
- 3M Co.
- Alfa Laval AB
- Aquamarijn Micro Filtration BV
- DuPont de Nemours Inc.
- Filtration Group
- GEA Group AG
- Graver Technologies LLC
- H2O Innovation Inc.
- Kovalus Separation Solutions
- Lanxess AG
- MANN HUMMEL International GmbH
- MEGA a.s.
- Merck KGaA
- MMS AG
- Nitto Denko Corp.
- Pentair Plc
- Synder Filtration Inc.
- TAMI Industries SAS
- Toray Industries Inc.
Qualitative and quantitative analysis of companies has been conducted to help clients understand the wider business environment as well as the strengths and weaknesses of key industry players. Data is qualitatively analyzed to categorize companies as pure play, category-focused, industry-focused, and diversified; it is quantitatively analyzed to categorize companies as dominant, leading, strong, tentative, and weak.
Market Intelligence Radar: High-Impact Developments & Growth Signals
- In the fertilizers and agricultural chemicals industry, heightened environmental scrutiny on wastewater discharge quality has compelled food processors to invest in advanced filtration. This directly drives demand for membrane bioreactor (MBR) and reverse osmosis systems to ensure effluent quality and enable wastewater recycling, aligning with stricter water-use regulations.
- Technological advancements in polymer science within the advanced materials sector are yielding new membrane formulations with superior fouling resistance and chemical tolerance. This development directly impacts the food and beverage processing market by extending product shelf life and reducing operational costs associated with cleaning and replacement.
- Within the food manufacturing sector, a pronounced shift toward clean-label trends and the reduction of chemical additives is boosting demand for non-thermal processing methods. This directly increases the adoption of microfiltration and ultrafiltration as physical separation tools for clarification and microbial reduction, preserving the natural integrity of products.
- Increasing consumer demand for nutrient-specific foods and functional beverages is driving innovation in separation technology. This trend requires food processors to adopt highly selective nanofiltration and ultrafiltration systems for protein concentration and the precise fractionation of bioactive compounds, supporting the growth of the value-added food market.
Dive into Technavio’s robust research methodology, blending expert interviews, extensive data synthesis, and validated models for unparalleled Membrane For Food And Beverage Processing Market insights. See full methodology.
| Market Scope | |
|---|---|
| Page number | 308 |
| Base year | 2025 |
| Historic period | 2020-2024 |
| Forecast period | 2026-2030 |
| Growth momentum & CAGR | Accelerate at a CAGR of 6.4% |
| Market growth 2026-2030 | USD 2486.1 million |
| Market structure | Fragmented |
| YoY growth 2025-2026(%) | 5.9% |
| Key countries | Germany, France, UK, Italy, The Netherlands, Spain, US, Canada, Mexico, China, Japan, India, South Korea, Australia, Indonesia, Saudi Arabia, UAE, South Africa, Egypt, Turkey, Brazil, Argentina and Colombia |
| Competitive landscape | Leading Companies, Market Positioning of Companies, Competitive Strategies, and Industry Risks |
Research Analyst Overview
- The market ecosystem for membranes in food and beverage processing involves a complex value chain starting with suppliers of advanced polymers and ceramics. These materials are utilized by equipment manufacturers, who engineer filtration modules and integrated systems tailored for end-user segments. The dairy and beverage industries are the largest consumers, driving demand for technologies that enhance product quality and safety.
- Regulatory bodies like the FDA and EFSA set stringent standards for food contact materials and effluent discharge, influencing innovation toward safer and more sustainable solutions. Distribution is often direct to large processors, with regional integrators serving smaller clients.
- Crucially, R&D from supporting institutions leads to innovations like anti-fouling coatings, which can extend membrane lifespan by up to 40%, directly impacting long-term operational costs for end-users.
What are the Key Data Covered in this Membrane For Food And Beverage Processing Market Research and Growth Report?
-
What is the expected growth of the Membrane For Food And Beverage Processing Market between 2026 and 2030?
-
The Membrane For Food And Beverage Processing Market is expected to grow by USD 2.49 billion during 2026-2030, registering a CAGR of 6.4%. Year-over-year growth in 2026 is estimated at 5.9%%. This acceleration is shaped by increasing focus on reducing food contamination, which is intensifying demand across multiple end-use verticals covered in the report.
-
-
What segmentation does the market report cover?
-
The report is segmented by Material (Polymeric, Ceramic, and Others), Technology (Microfiltration, Reverse osmosis, Ultrafiltration, Nanofiltration, and Others), Application (Dairy processing, Beverages, Food processing, Water and wastewater treatment, and Others) and Geography (Europe, North America, APAC, Middle East and Africa, South America). Among these, the Polymeric segment is estimated to witness significant growth during the forecast period, driven by rising adoption across key application areas. Each segment includes detailed qualitative and quantitative analysis, along with historical data from 2020-2024 and forecasts through 2030 with year-over-year growth rates.
-
-
Which regions are analyzed in the report?
-
The report covers Europe, North America, APAC, Middle East and Africa and South America. Europe is estimated to contribute 36% to market growth during the forecast period. Country-level analysis includes Germany, France, UK, Italy, The Netherlands, Spain, US, Canada, Mexico, China, Japan, India, South Korea, Australia, Indonesia, Saudi Arabia, UAE, South Africa, Egypt, Turkey, Brazil, Argentina and Colombia, with dedicated market size tables and year-over-year growth for each.
-
-
What are the key growth drivers and market challenges?
-
The primary driver is increasing focus on reducing food contamination, which is accelerating investment and industry demand. The main challenge is prevailing usage of alternate filtration technologies, creating operational barriers for key market participants. The report quantifies the impact of each driver and challenge across 2026 and 2030 with comparative analysis.
-
-
Who are the major players in the Membrane For Food And Beverage Processing Market?
-
Key vendors include 3M Co., Alfa Laval AB, Aquamarijn Micro Filtration BV, DuPont de Nemours Inc., Filtration Group, GEA Group AG, Graver Technologies LLC, H2O Innovation Inc., Kovalus Separation Solutions, Lanxess AG, MANN HUMMEL International GmbH, MEGA a.s., Merck KGaA, MMS AG, Nitto Denko Corp., Pentair Plc, Synder Filtration Inc., TAMI Industries SAS and Toray Industries Inc.. The report provides qualitative and quantitative analysis categorizing companies as dominant, leading, strong, tentative, and weak based on their market positioning. Company profiles include business segment analysis, SWOT assessment, key offerings, and recent strategic developments.
-
Market Research Insights
- The competitive landscape for membranes in food and beverage processing is intensely focused on material science and system integration, with R&D investments by leading players often exceeding 5% of revenue. Key vendors like DuPont de Nemours Inc. and Toray Industries Inc.
- are advancing material science, with innovations in reverse osmosis membranes improving salt rejection rates by up to 15% in high-sugar applications. Concurrently, companies such as Alfa Laval AB and GEA Group AG concentrate on integrating these membranes into complete, automated processing lines for the dairy and beverage sectors.
- These developments directly address processor demands for higher operational efficiency and compliance with stricter environmental regulations. A persistent challenge is the management of membrane fouling, which companies are tackling through the development of intelligent cleaning-in-place systems and advanced surface coating technologies.
We can help! Our analysts can customize this membrane for food and beverage processing market research report to meet your requirements.
 RIA -
RIA - 
