MSP Software Market Analysis, Size, and Forecast 2025-2029: North America (US and Canada), Europe (France, Germany, Italy, UK), APAC (China, India, Japan), South America (Brazil), and Middle East and Africa

MSP Software Market Analysis, Size, and Forecast 2025-2029:
North America (US and Canada), Europe (France, Germany, Italy, UK), APAC (China, India, Japan), South America (Brazil), and Middle East and Africa

Published: Apr 2025 222 Pages SKU: IRTNTR74424

Market Overview at a Glance

$55.1 Mn
Market Opportunity
16%
CAGR
13.3
YoY growth 2024-2025(%)

MSP Software Market Size 2025-2029

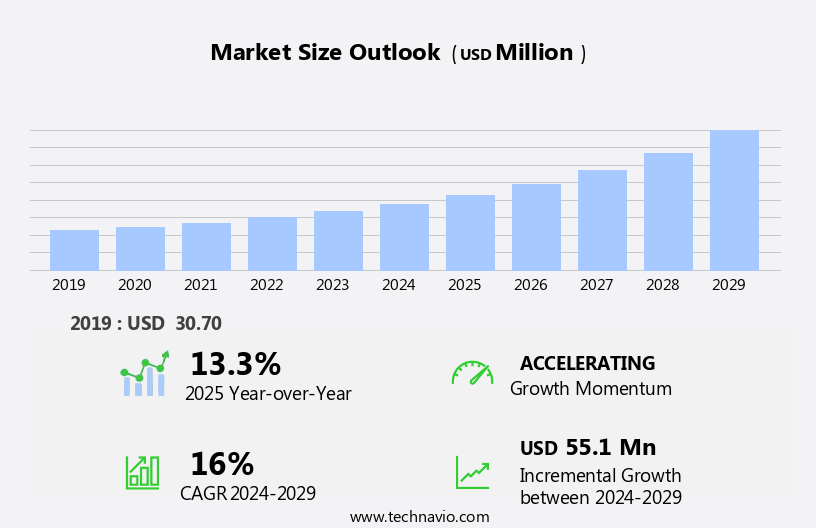
The MSP software market size is forecast to increase by USD 55.1 million at a CAGR of 16% between 2024 and 2029.

  • The Managed Service Provider (MSP) software market is experiencing significant growth, driven by the increasing adoption of Internet of Things (IoT) solutions and bring your own device (BYOD) policies in businesses. The proliferation of IoT devices in various industries is creating a wave in demand for MSPs to manage and secure these connected devices, ensuring optimal performance and data protection. Simultaneously, the widespread implementation of BYOD policies is increasing the complexity of IT environments, necessitating MSPs to provide comprehensive management and security services for diverse devices and platforms. However, the market is not without challenges. Data privacy and security risks associated with cloud-based services continue to be a major concern for businesses, particularly those handling sensitive information.
  • As a result, MSPs must prioritize security measures to mitigate these risks and build trust with their clients. Furthermore, the intense competition in the market necessitates MSPs to differentiate themselves through innovative offerings, exceptional customer service, and competitive pricing. Companies seeking to capitalize on market opportunities and navigate challenges effectively should focus on developing strong partnerships, investing in advanced technologies, and providing customized solutions to cater to the unique needs of their clients.

What will be the Size of the MSP Software Market during the forecast period?

MSP Software Market Size

 Request Free Sample

  • The Managed Service Provider (MSP) software market exhibits strong growth, driven by the increasing adoption of cloud services, IT transformation, and the digital workplace. Key areas of focus include data governance, knowledge base development, virtual desktop infrastructure, real-time analytics, and data protection. Application monitoring, remote collaboration, and service level reporting are essential for ensuring optimal performance and customer experience. Security remains a top priority, with managed security services, penetration testing, compliance audits, network security, and incident response addressing various threats. IT governance, ITIL framework, and IT service orchestration are crucial for managing complex IT environments.
  • Additionally, emerging trends such as AI-powered IT operations, proactive monitoring, asset tracking, software upgrades, and software-defined networking contribute to the market's expansion. Cloud strategy, license compliance, and cloud adoption continue to shape the landscape, while big data, business intelligence, and self-service portals offer new opportunities for MSPs to add value. The Internet of Things (IoT) and IT governance further expand the market's scope, ensuring a dynamic and evolving ecosystem.

How is this MSP Software Industry segmented?

The MSP software industry research report provides comprehensive data (region-wise segment analysis), with forecasts and estimates in "USD million" for the period 2025-2029, as well as historical data from 2019-2023 for the following segments.

  • Deployment
    • On-premises
    • Cloud-based
    • Hybrid
    • Others
  • Type
    • Managed data center
    • Managed network
    • Managed infrastructure
    • Managed mobility
    • Others
  • Application
    • Telecom and IT
    • BFSI
    • Retail
    • Media and entertainment
    • Others
  • Geography
    • North America
      • US
      • Canada
    • Europe
      • France
      • Germany
      • Italy
      • UK
    • APAC
      • China
      • India
      • Japan
    • South America
      • Brazil
    • Middle East and Africa

By Deployment Insights

The on-premises segment is estimated to witness significant growth during the forecast period. The market is experiencing notable growth, particularly in the on-premises segment. On-premises MSP software offers end-to-end quality control, ensuring higher security compared to SaaS-based managed services. Large client organizations, predominantly in sectors such as BFSI, aerospace and defense, and government, prioritize functionality and are more likely to adopt on-premises solutions due to regulatory requirements. These sectors handle sensitive data, making security a top priority. For instance, government bodies like the Central Intelligence Agency (CIA), Research and Analysis Wing (RAW), and Inter-services Intelligence (ISI) utilize on-premises MSP software to mitigate the risk of cyber threats and terrorism.

In addition to security, on-premises solutions offer customizability, control, and compliance with specific industry regulations. The market dynamics are influenced by factors such as IT budgeting, IT infrastructure management, system updates, vulnerability assessment, firewall management, disaster recovery, and IT support. Companies are also focusing on cost optimization, change management, project management, cloud migration, endpoint security, desktop management, hybrid cloud, cloud computing, service catalog, mobile device management, artificial intelligence, cloud-native applications, log analysis, and IT asset management. Furthermore, service level agreements, problem management, workflow automation, incident management, network performance monitoring, patch management, and network management are essential components of the market.

Agile methodologies, help desk, application performance monitoring, software licensing, threat intelligence, knowledge management, remote monitoring, and financial services are other key areas of focus. The market is continually evolving, with trends such as digital transformation and the increasing adoption of cloud services shaping its future.

MSP Software Market Size

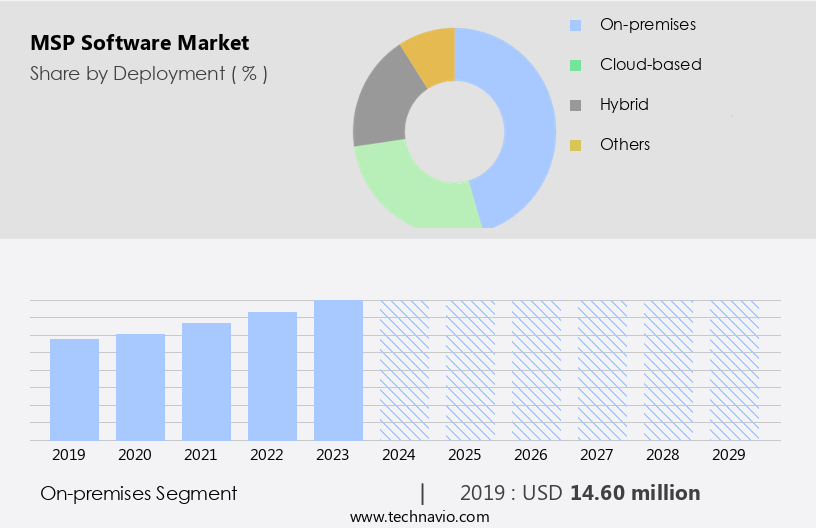
Get a glance at the market report of share of various segments Request Free Sample

The On-premises segment was valued at USD 14.60 million in 2019 and showed a gradual increase during the forecast period.

Regional Analysis

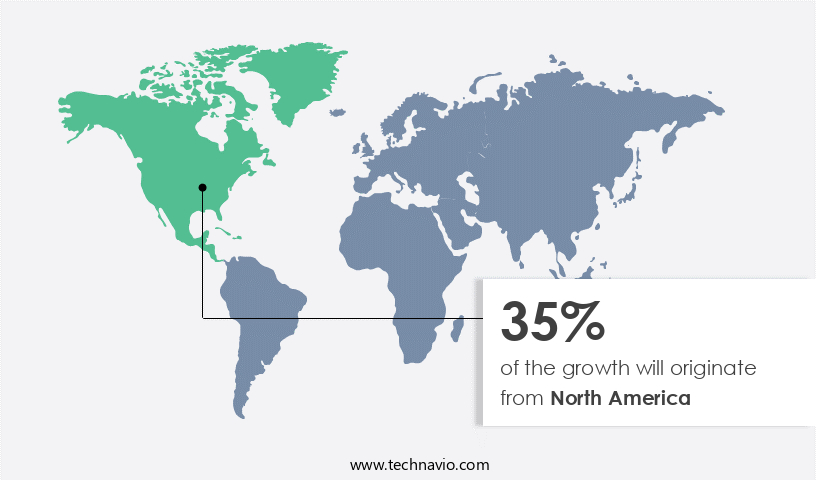
North America is estimated to contribute 35% to the growth of the global market during the forecast period. Technavio's analysts have elaborately explained the regional trends and drivers that shape the market during the forecast period.

MSP Software Market Share by Geography

For more insights on the market size of various regions, Request Free Sample

The North American market for Managed Services Providers (MSP) software is thriving due to the region's early adoption of advanced technologies in industries such as manufacturing, retail, and finance. This demand is driven by the need for data encryption, vulnerability assessment, system updates, hardware maintenance, IT management, IT budgeting, firewall management, disaster recovery, and cloud services. The integration of cloud-based services, automation solutions, and artificial intelligence (AI) with operational and supply chain processes is leading to the development of new intelligent MSP software. The presence of top companies in the region and the need for IT infrastructure, IT asset management, customer relationship management, and digital transformation further fuel market growth.

Additionally, the importance of IT support, application performance monitoring, software licensing, threat intelligence, knowledge management, remote monitoring, and network performance monitoring is increasing. The market dynamics are influenced by factors such as cost optimization, change management, cloud migration, endpoint security, desktop management, hybrid cloud, and service level agreements. The need for problem management, workflow automation, incident management, network management, service desk, machine learning, and agile methodologies is also driving market growth.

Market Dynamics

Our researchers analyzed the data with 2024 as the base year, along with the key drivers, trends, and challenges. A holistic analysis of drivers will help companies refine their marketing strategies to gain a competitive advantage.

What are the key market drivers leading to the rise in the adoption of MSP Software Industry?

  • Increased adoption of IoT solutions is the key driver of the market. The Internet of Things (IoT) is a network of interconnected devices and systems that communicate and exchange data through technology. This network includes hardware, embedded software, communication services, and managed services, enabling the creation of smart environments such as homes, shopping, transportation, and healthcare. IoT technology facilitates remote control and monitoring of devices using microcontrollers and the Internet. MSP (Managed Service Provider) software plays a crucial role in building end-to-end IoT infrastructure for various applications.
  • These systems ensure efficient management of communication services and machine-to-machine communication (M2M) for smart communities, healthcare, homes, and transportation systems. IoT and MSP software work together to create a connected world where devices and systems communicate seamlessly, enhancing productivity and convenience.

What are the market trends shaping the MSP Software Industry?

  • Increased adoption of bring your own device (BYOD) policy is the upcoming market trend. Enterprise mobility has become increasingly prevalent in businesses as employees prefer using their smartphones, tablets, and laptops for work. This trend, known as Bring Your Own Device (BYOD), necessitates specific management and IT service delivery frameworks to ensure secure and productive work environments. Companies are focusing on providing the appropriate mobile devices to their employees, leading to a growing adoption of BYOD policies worldwide. The proliferation of various operating systems and mobile devices, such as iOS, Android, Windows, smartphones, and tablets, accessing secure computer networks, is a result of this trend.
  • This shift in technology usage offers numerous benefits, including increased employee productivity and flexibility, reduced costs, and improved employee satisfaction. However, it also poses challenges, such as data security and device management, which businesses must address to reap the full benefits of enterprise mobility.

What challenges does the MSP Software Industry face during its growth?

  • Data privacy and security risk in cloud-based services is a key challenge affecting the industry growth. Cloud-based Managed Service Providers (MSP) software adoption in organizations faces significant challenges due to data privacy and security risks. The complexity of securing online data in cloud environments is a major concern, particularly for public cloud infrastructure. Cloud infrastructure relies on various open-source codes, which can introduce vulnerabilities to cloud systems. Public clouds, being multi-tenant, are more susceptible to these vulnerabilities as they host multiple applications in a shared environment. Cyber-attackers can exploit these weaknesses to gain unauthorized access to cloud-based data storage systems, posing a significant threat to businesses.
  • The open architecture and shared resources of cloud infrastructure further complicate security management, making it a challenging task for companies to protect their online digital files. These concerns hinder the widespread adoption of cloud-based MSP software despite its potential benefits.

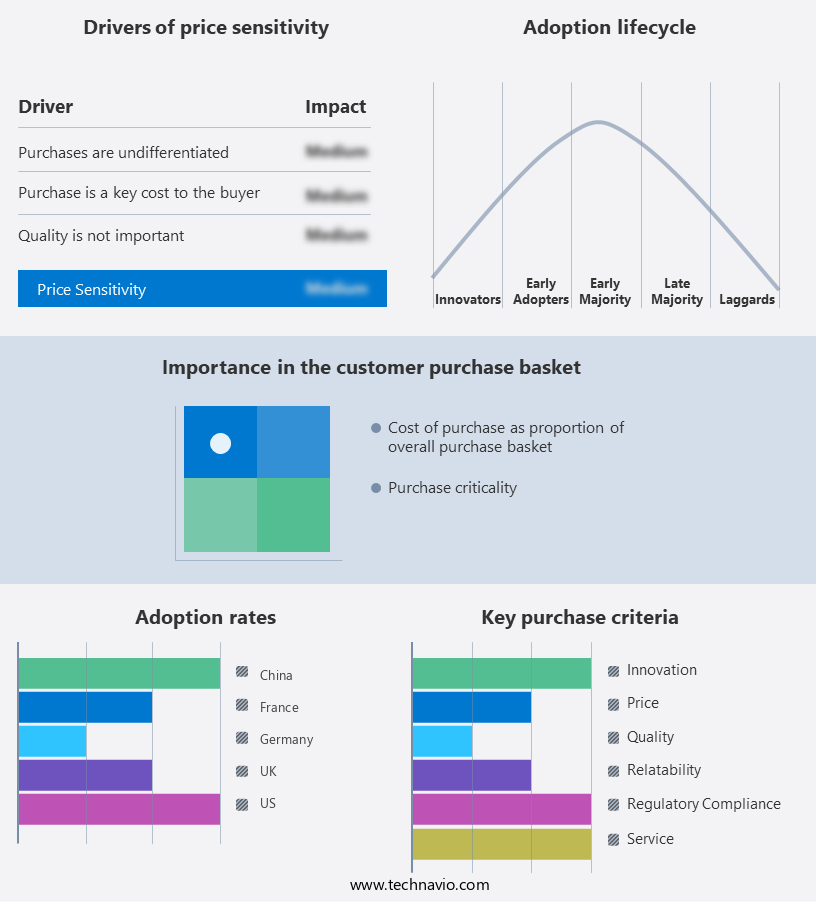
Exclusive Customer Landscape

The MSP software market forecasting report includes the adoption lifecycle of the market, covering from the innovator's stage to the laggard's stage. It focuses on adoption rates in different regions based on penetration. Furthermore, the MSP software market report also includes key purchase criteria and drivers of price sensitivity to help companies evaluate and develop their market growth analysis strategies.

MSP Software Market Share by Geography

 Customer Landscape

Key Companies & Market Insights

Companies are implementing various strategies, such as strategic alliances, MSP software market forecast, partnerships, mergers and acquisitions, geographical expansion, and product/service launches, to enhance their presence in the industry.

Acronis International GmbH - The company offers MSP software for hybrid backup cloud, disaster recovery, ransomware protection, esignatures and blockchain based files.

The industry research and growth report includes detailed analyses of the competitive landscape of the market and information about key companies, including:

  • Acronis International GmbH
  • AT and T Inc.
  • Atera Networks Ltd.
  • Auvik Networks Inc.
  • Bravura Software LLC
  • Cisco Systems Inc.
  • ConnectWise LLC
  • DNSFilter Inc.
  • Hewlett Packard Enterprise Co.
  • Hornetsecurity Ltd.
  • Infosys Ltd.
  • International Business Machines Corp.
  • Kaseya Ltd.
  • LogicMonitor Inc.
  • Opmantek Software Pty Ltd.
  • ServiceNow Inc.
  • TitanHQ
  • Trend Micro Inc.
  • Wipro Ltd.
  • Zoho Corp. Pvt. Ltd.

Qualitative and quantitative analysis of companies has been conducted to help clients understand the wider business environment as well as the strengths and weaknesses of key industry players. Data is qualitatively analyzed to categorize companies as pure play, category-focused, industry-focused, and diversified; it is quantitatively analyzed to categorize companies as dominant, leading, strong, tentative, and weak.

Research Analyst Overview

The market continues to evolve as businesses increasingly rely on technology to drive growth and efficiency. IT management has become a critical function for organizations of all sizes, leading to a high demand for Managed Services Providers (MSPs) that offer a range of IT solutions. MSPs provide various services to help businesses optimize their IT infrastructure and improve overall IT performance. These services include data encryption, vulnerability assessment, system updates, hardware maintenance, and IT budgeting, among others. MSPs also offer firewall management, disaster recovery, and project management to help businesses mitigate risks and streamline operations. Cost optimization is a significant focus for many businesses, and MSPs provide valuable services in this area.

They help organizations reduce IT costs through effective IT asset management, cloud computing, and service catalog management. MSPs also offer mobile device management, endpoint security, and application performance monitoring to ensure the security and efficiency of their clients' IT environments. MSPs are also leveraging emerging technologies such as artificial intelligence, machine learning, and cloud-native applications to provide advanced IT solutions. Log analysis and threat intelligence are essential services that MSPs offer to help businesses stay ahead of potential security threats. IT support and cloud services are also popular offerings, providing businesses with access to expert help and reliable infrastructure.

Network management and service desk services are crucial for maintaining IT infrastructure and addressing IT issues promptly. MSPs offer network performance monitoring, patch management, and incident management to help businesses keep their IT systems running smoothly. MSPs also provide essential services for specific industries, such as financial services, where data security and regulatory compliance are paramount. They offer IT infrastructure, server management, and service-level agreements to help financial institutions meet their unique IT needs. MSPs offer a range of agile methodologies, including help desk, problem management, and workflow automation, to help businesses adapt to changing IT requirements.

They also provide software licensing and software deployment services to help businesses manage their software assets effectively. The market is a dynamic and evolving space, with MSPs offering a range of services to help businesses optimize their IT infrastructure, improve IT performance, and reduce costs. MSPs provide essential services such as data encryption, vulnerability assessment, system updates, and hardware maintenance, as well as advanced services such as artificial intelligence, machine learning, and cloud-native applications. They offer services for specific industries and provide agile methodologies to help businesses adapt to changing IT requirements. MSPs are an essential partner for businesses looking to stay competitive in today's digital landscape.

Market Scope

Report Coverage

Details

Page number

222

Base year

2024

Historic period

2019-2023

Forecast period

2025-2029

Growth momentum & CAGR

Accelerate at a CAGR of 16%

Market growth 2025-2029

USD 55.1 million

Market structure

Fragmented

YoY growth 2024-2025(%)

13.3

Key countries

US, Canada, China, Germany, Japan, India, UK, Italy, France, and Brazil

Competitive landscape

Leading Companies, Market Positioning of Companies, Competitive Strategies, and Industry Risks

Request Free Sample

What are the Key Data Covered in this MSP Software Market Research and Growth Report?

  • CAGR of the MSP Software industry during the forecast period
  • Detailed information on factors that will drive the growth and forecasting between 2025 and 2029
  • Precise estimation of the size of the market and its contribution of the industry in focus to the parent market
  • Accurate predictions about upcoming growth and trends and changes in consumer behaviour
  • Growth of the market across North America, Europe, APAC, South America, and Middle East and Africa
  • Thorough analysis of the market's competitive landscape and detailed information about companies
  • Comprehensive analysis of factors that will challenge the MSP software market growth and forecasting

We can help! Our analysts can customize this MSP software market research report to meet your requirements.

Get in touch

1 Executive Summary

  • 1.1 Market overview
    • Executive Summary - Chart on Market Overview
    • Executive Summary - Data Table on Market Overview
    • Executive Summary - Chart on Global Market Characteristics
    • Executive Summary - Chart on Market by Geography
    • Executive Summary - Chart on Market Segmentation by Deployment
    • Executive Summary - Chart on Market Segmentation by Type
    • Executive Summary - Chart on Market Segmentation by Application
    • Executive Summary - Chart on Incremental Growth
    • Executive Summary - Data Table on Incremental Growth
    • Executive Summary - Chart on Company Market Positioning

2 Technavio Analysis

  • 2.1 Analysis of price sensitivity, lifecycle, customer purchase basket, adoption rates, and purchase criteria
    • Analysis of price sensitivity, lifecycle, customer purchase basket, adoption rates, and purchase criteria
  • 2.2 Criticality of inputs and Factors of differentiation
    • Overview on criticality of inputs and factors of differentiation
  • 2.3 Factors of disruption
    • Overview on factors of disruption
  • 2.4 Impact of drivers and challenges
    • Impact of drivers and challenges in 2024 and 2029

3 Market Landscape

  • 3.1 Market ecosystem
    • Parent Market
    • Data Table on - Parent Market
  • 3.2 Market characteristics
    • Market characteristics analysis
  • 3.3 Value chain analysis
    • Value chain analysis

4 Market Sizing

  • 4.1 Market definition
    • Offerings of companies included in the market definition
  • 4.2 Market segment analysis
    • Market segments
  • 4.3 Market size 2024
    • 4.4 Market outlook: Forecast for 2024-2029
      • Chart on Global - Market size and forecast 2024-2029 ($ million)
      • Data Table on Global - Market size and forecast 2024-2029 ($ million)
      • Chart on Global Market: Year-over-year growth 2024-2029 (%)
      • Data Table on Global Market: Year-over-year growth 2024-2029 (%)

    5 Historic Market Size

    • 5.1 Global MSP Software Market 2019 - 2023
      • Historic Market Size - Data Table on Global MSP Software Market 2019 - 2023 ($ million)
    • 5.2 Deployment segment analysis 2019 - 2023
      • Historic Market Size - Deployment Segment 2019 - 2023 ($ million)
    • 5.3 Type segment analysis 2019 - 2023
      • Historic Market Size - Type Segment 2019 - 2023 ($ million)
    • 5.4 Application segment analysis 2019 - 2023
      • Historic Market Size - Application Segment 2019 - 2023 ($ million)
    • 5.5 Geography segment analysis 2019 - 2023
      • Historic Market Size - Geography Segment 2019 - 2023 ($ million)
    • 5.6 Country segment analysis 2019 - 2023
      • Historic Market Size - Country Segment 2019 - 2023 ($ million)

    6 Qualitative Analysis

    • 6.1 Impact of AI on global MSP software market

      7 Five Forces Analysis

      • 7.1 Five forces summary
        • Five forces analysis - Comparison between 2024 and 2029
      • 7.2 Bargaining power of buyers
        • Bargaining power of buyers - Impact of key factors 2024 and 2029
      • 7.3 Bargaining power of suppliers
        • Bargaining power of suppliers - Impact of key factors in 2024 and 2029
      • 7.4 Threat of new entrants
        • Threat of new entrants - Impact of key factors in 2024 and 2029
      • 7.5 Threat of substitutes
        • Threat of substitutes - Impact of key factors in 2024 and 2029
      • 7.6 Threat of rivalry
        • Threat of rivalry - Impact of key factors in 2024 and 2029
      • 7.7 Market condition
        • Chart on Market condition - Five forces 2024 and 2029

      8 Market Segmentation by Deployment

      • 8.1 Market segments
        • Chart on Deployment - Market share 2024-2029 (%)
        • Data Table on Deployment - Market share 2024-2029 (%)
      • 8.2 Comparison by Deployment
        • Chart on Comparison by Deployment
        • Data Table on Comparison by Deployment
      • 8.3 On-premises - Market size and forecast 2024-2029
        • Chart on On-premises - Market size and forecast 2024-2029 ($ million)
        • Data Table on On-premises - Market size and forecast 2024-2029 ($ million)
        • Chart on On-premises - Year-over-year growth 2024-2029 (%)
        • Data Table on On-premises - Year-over-year growth 2024-2029 (%)
      • 8.4 Cloud-based - Market size and forecast 2024-2029
        • Chart on Cloud-based - Market size and forecast 2024-2029 ($ million)
        • Data Table on Cloud-based - Market size and forecast 2024-2029 ($ million)
        • Chart on Cloud-based - Year-over-year growth 2024-2029 (%)
        • Data Table on Cloud-based - Year-over-year growth 2024-2029 (%)
      • 8.5 Hybrid - Market size and forecast 2024-2029
        • Chart on Hybrid - Market size and forecast 2024-2029 ($ million)
        • Data Table on Hybrid - Market size and forecast 2024-2029 ($ million)
        • Chart on Hybrid - Year-over-year growth 2024-2029 (%)
        • Data Table on Hybrid - Year-over-year growth 2024-2029 (%)
      • 8.6 Others - Market size and forecast 2024-2029
        • Chart on Others - Market size and forecast 2024-2029 ($ million)
        • Data Table on Others - Market size and forecast 2024-2029 ($ million)
        • Chart on Others - Year-over-year growth 2024-2029 (%)
        • Data Table on Others - Year-over-year growth 2024-2029 (%)
      • 8.7 Market opportunity by Deployment
        • Market opportunity by Deployment ($ million)
        • Data Table on Market opportunity by Deployment ($ million)

      9 Market Segmentation by Type

      • 9.1 Market segments
        • Chart on Type - Market share 2024-2029 (%)
        • Data Table on Type - Market share 2024-2029 (%)
      • 9.2 Comparison by Type
        • Chart on Comparison by Type
        • Data Table on Comparison by Type
      • 9.3 Managed data center - Market size and forecast 2024-2029
        • Chart on Managed data center - Market size and forecast 2024-2029 ($ million)
        • Data Table on Managed data center - Market size and forecast 2024-2029 ($ million)
        • Chart on Managed data center - Year-over-year growth 2024-2029 (%)
        • Data Table on Managed data center - Year-over-year growth 2024-2029 (%)
      • 9.4 Managed network - Market size and forecast 2024-2029
        • Chart on Managed network - Market size and forecast 2024-2029 ($ million)
        • Data Table on Managed network - Market size and forecast 2024-2029 ($ million)
        • Chart on Managed network - Year-over-year growth 2024-2029 (%)
        • Data Table on Managed network - Year-over-year growth 2024-2029 (%)
      • 9.5 Managed infrastructure - Market size and forecast 2024-2029
        • Chart on Managed infrastructure - Market size and forecast 2024-2029 ($ million)
        • Data Table on Managed infrastructure - Market size and forecast 2024-2029 ($ million)
        • Chart on Managed infrastructure - Year-over-year growth 2024-2029 (%)
        • Data Table on Managed infrastructure - Year-over-year growth 2024-2029 (%)
      • 9.6 Managed mobility - Market size and forecast 2024-2029
        • Chart on Managed mobility - Market size and forecast 2024-2029 ($ million)
        • Data Table on Managed mobility - Market size and forecast 2024-2029 ($ million)
        • Chart on Managed mobility - Year-over-year growth 2024-2029 (%)
        • Data Table on Managed mobility - Year-over-year growth 2024-2029 (%)
      • 9.7 Others - Market size and forecast 2024-2029
        • Chart on Others - Market size and forecast 2024-2029 ($ million)
        • Data Table on Others - Market size and forecast 2024-2029 ($ million)
        • Chart on Others - Year-over-year growth 2024-2029 (%)
        • Data Table on Others - Year-over-year growth 2024-2029 (%)
      • 9.8 Market opportunity by Type
        • Market opportunity by Type ($ million)
        • Data Table on Market opportunity by Type ($ million)

      10 Market Segmentation by Application

      • 10.1 Market segments
        • Chart on Application - Market share 2024-2029 (%)
        • Data Table on Application - Market share 2024-2029 (%)
      • 10.2 Comparison by Application
        • Chart on Comparison by Application
        • Data Table on Comparison by Application
      • 10.3 Telecom and IT - Market size and forecast 2024-2029
        • Chart on Telecom and IT - Market size and forecast 2024-2029 ($ million)
        • Data Table on Telecom and IT - Market size and forecast 2024-2029 ($ million)
        • Chart on Telecom and IT - Year-over-year growth 2024-2029 (%)
        • Data Table on Telecom and IT - Year-over-year growth 2024-2029 (%)
      • 10.4 BFSI - Market size and forecast 2024-2029
        • Chart on BFSI - Market size and forecast 2024-2029 ($ million)
        • Data Table on BFSI - Market size and forecast 2024-2029 ($ million)
        • Chart on BFSI - Year-over-year growth 2024-2029 (%)
        • Data Table on BFSI - Year-over-year growth 2024-2029 (%)
      • 10.5 Retail - Market size and forecast 2024-2029
        • Chart on Retail - Market size and forecast 2024-2029 ($ million)
        • Data Table on Retail - Market size and forecast 2024-2029 ($ million)
        • Chart on Retail - Year-over-year growth 2024-2029 (%)
        • Data Table on Retail - Year-over-year growth 2024-2029 (%)
      • 10.6 Media and entertainment - Market size and forecast 2024-2029
        • Chart on Media and entertainment - Market size and forecast 2024-2029 ($ million)
        • Data Table on Media and entertainment - Market size and forecast 2024-2029 ($ million)
        • Chart on Media and entertainment - Year-over-year growth 2024-2029 (%)
        • Data Table on Media and entertainment - Year-over-year growth 2024-2029 (%)
      • 10.7 Others - Market size and forecast 2024-2029
        • Chart on Others - Market size and forecast 2024-2029 ($ million)
        • Data Table on Others - Market size and forecast 2024-2029 ($ million)
        • Chart on Others - Year-over-year growth 2024-2029 (%)
        • Data Table on Others - Year-over-year growth 2024-2029 (%)
      • 10.8 Market opportunity by Application
        • Market opportunity by Application ($ million)
        • Data Table on Market opportunity by Application ($ million)

      11 Customer Landscape

      • 11.1 Customer landscape overview
        • Analysis of price sensitivity, lifecycle, customer purchase basket, adoption rates, and purchase criteria

      12 Geographic Landscape

      • 12.1 Geographic segmentation
        • Chart on Market share by geography 2024-2029 (%)
        • Data Table on Market share by geography 2024-2029 (%)
      • 12.2 Geographic comparison
        • Chart on Geographic comparison
        • Data Table on Geographic comparison
      • 12.3 North America - Market size and forecast 2024-2029
        • Chart on North America - Market size and forecast 2024-2029 ($ million)
        • Data Table on North America - Market size and forecast 2024-2029 ($ million)
        • Chart on North America - Year-over-year growth 2024-2029 (%)
        • Data Table on North America - Year-over-year growth 2024-2029 (%)
      • 12.4 Europe - Market size and forecast 2024-2029
        • Chart on Europe - Market size and forecast 2024-2029 ($ million)
        • Data Table on Europe - Market size and forecast 2024-2029 ($ million)
        • Chart on Europe - Year-over-year growth 2024-2029 (%)
        • Data Table on Europe - Year-over-year growth 2024-2029 (%)
      • 12.5 APAC - Market size and forecast 2024-2029
        • Chart on APAC - Market size and forecast 2024-2029 ($ million)
        • Data Table on APAC - Market size and forecast 2024-2029 ($ million)
        • Chart on APAC - Year-over-year growth 2024-2029 (%)
        • Data Table on APAC - Year-over-year growth 2024-2029 (%)
      • 12.6 South America - Market size and forecast 2024-2029
        • Chart on South America - Market size and forecast 2024-2029 ($ million)
        • Data Table on South America - Market size and forecast 2024-2029 ($ million)
        • Chart on South America - Year-over-year growth 2024-2029 (%)
        • Data Table on South America - Year-over-year growth 2024-2029 (%)
      • 12.7 Middle East and Africa - Market size and forecast 2024-2029
        • Chart on Middle East and Africa - Market size and forecast 2024-2029 ($ million)
        • Data Table on Middle East and Africa - Market size and forecast 2024-2029 ($ million)
        • Chart on Middle East and Africa - Year-over-year growth 2024-2029 (%)
        • Data Table on Middle East and Africa - Year-over-year growth 2024-2029 (%)
      • 12.8 US - Market size and forecast 2024-2029
        • Chart on US - Market size and forecast 2024-2029 ($ million)
        • Data Table on US - Market size and forecast 2024-2029 ($ million)
        • Chart on US - Year-over-year growth 2024-2029 (%)
        • Data Table on US - Year-over-year growth 2024-2029 (%)
      • 12.9 China - Market size and forecast 2024-2029
        • Chart on China - Market size and forecast 2024-2029 ($ million)
        • Data Table on China - Market size and forecast 2024-2029 ($ million)
        • Chart on China - Year-over-year growth 2024-2029 (%)
        • Data Table on China - Year-over-year growth 2024-2029 (%)
      • 12.10 Canada - Market size and forecast 2024-2029
        • Chart on Canada - Market size and forecast 2024-2029 ($ million)
        • Data Table on Canada - Market size and forecast 2024-2029 ($ million)
        • Chart on Canada - Year-over-year growth 2024-2029 (%)
        • Data Table on Canada - Year-over-year growth 2024-2029 (%)
      • 12.11 Germany - Market size and forecast 2024-2029
        • Chart on Germany - Market size and forecast 2024-2029 ($ million)
        • Data Table on Germany - Market size and forecast 2024-2029 ($ million)
        • Chart on Germany - Year-over-year growth 2024-2029 (%)
        • Data Table on Germany - Year-over-year growth 2024-2029 (%)
      • 12.12 Japan - Market size and forecast 2024-2029
        • Chart on Japan - Market size and forecast 2024-2029 ($ million)
        • Data Table on Japan - Market size and forecast 2024-2029 ($ million)
        • Chart on Japan - Year-over-year growth 2024-2029 (%)
        • Data Table on Japan - Year-over-year growth 2024-2029 (%)
      • 12.13 UK - Market size and forecast 2024-2029
        • Chart on UK - Market size and forecast 2024-2029 ($ million)
        • Data Table on UK - Market size and forecast 2024-2029 ($ million)
        • Chart on UK - Year-over-year growth 2024-2029 (%)
        • Data Table on UK - Year-over-year growth 2024-2029 (%)
      • 12.14 India - Market size and forecast 2024-2029
        • Chart on India - Market size and forecast 2024-2029 ($ million)
        • Data Table on India - Market size and forecast 2024-2029 ($ million)
        • Chart on India - Year-over-year growth 2024-2029 (%)
        • Data Table on India - Year-over-year growth 2024-2029 (%)
      • 12.15 France - Market size and forecast 2024-2029
        • Chart on France - Market size and forecast 2024-2029 ($ million)
        • Data Table on France - Market size and forecast 2024-2029 ($ million)
        • Chart on France - Year-over-year growth 2024-2029 (%)
        • Data Table on France - Year-over-year growth 2024-2029 (%)
      • 12.16 Italy - Market size and forecast 2024-2029
        • Chart on Italy - Market size and forecast 2024-2029 ($ million)
        • Data Table on Italy - Market size and forecast 2024-2029 ($ million)
        • Chart on Italy - Year-over-year growth 2024-2029 (%)
        • Data Table on Italy - Year-over-year growth 2024-2029 (%)
      • 12.17 Brazil - Market size and forecast 2024-2029
        • Chart on Brazil - Market size and forecast 2024-2029 ($ million)
        • Data Table on Brazil - Market size and forecast 2024-2029 ($ million)
        • Chart on Brazil - Year-over-year growth 2024-2029 (%)
        • Data Table on Brazil - Year-over-year growth 2024-2029 (%)
      • 12.18 Market opportunity by geography
        • Market opportunity by geography ($ million)
        • Data Tables on Market opportunity by geography ($ million)

      13 Drivers, Challenges, and Opportunity/Restraints

      • 13.1 Market drivers
        • 13.2 Market challenges
          • 13.3 Impact of drivers and challenges
            • Impact of drivers and challenges in 2024 and 2029
          • 13.4 Market opportunities/restraints

            14 Competitive Landscape

            • 14.1 Overview
              • 14.2 Competitive Landscape
                • Overview on criticality of inputs and factors of differentiation
              • 14.3 Landscape disruption
                • Overview on factors of disruption
              • 14.4 Industry risks
                • Impact of key risks on business

              15 Competitive Analysis

              • 15.1 Companies profiled
                • Companies covered
              • 15.2 Company ranking index
                • Company ranking index
              • 15.3 Market positioning of companies
                • Matrix on companies position and classification
              • 15.4 Acronis International GmbH
                • Acronis International GmbH - Overview
                • Acronis International GmbH - Product / Service
                • Acronis International GmbH - Key offerings
                • SWOT
              • 15.5 AT and T Inc.
                • AT and T Inc. - Overview
                • AT and T Inc. - Business segments
                • AT and T Inc. - Key news
                • AT and T Inc. - Key offerings
                • AT and T Inc. - Segment focus
                • SWOT
              • 15.6 Atera Networks Ltd.
                • Atera Networks Ltd. - Overview
                • Atera Networks Ltd. - Product / Service
                • Atera Networks Ltd. - Key offerings
                • SWOT
              • 15.7 Auvik Networks Inc.
                • Auvik Networks Inc. - Overview
                • Auvik Networks Inc. - Product / Service
                • Auvik Networks Inc. - Key offerings
                • SWOT
              • 15.8 Bravura Software LLC
                • Bravura Software LLC - Overview
                • Bravura Software LLC - Product / Service
                • Bravura Software LLC - Key offerings
                • SWOT
              • 15.9 Cisco Systems Inc.
                • Cisco Systems Inc. - Overview
                • Cisco Systems Inc. - Business segments
                • Cisco Systems Inc. - Key news
                • Cisco Systems Inc. - Key offerings
                • Cisco Systems Inc. - Segment focus
                • SWOT
              • 15.10 ConnectWise LLC
                • ConnectWise LLC - Overview
                • ConnectWise LLC - Product / Service
                • ConnectWise LLC - Key offerings
                • SWOT
              • 15.11 DNSFilter Inc.
                • DNSFilter Inc. - Overview
                • DNSFilter Inc. - Product / Service
                • DNSFilter Inc. - Key offerings
                • SWOT
              • 15.12 Hewlett Packard Enterprise Co.
                • Hewlett Packard Enterprise Co. - Overview
                • Hewlett Packard Enterprise Co. - Business segments
                • Hewlett Packard Enterprise Co. - Key news
                • Hewlett Packard Enterprise Co. - Key offerings
                • Hewlett Packard Enterprise Co. - Segment focus
                • SWOT
              • 15.13 Hornetsecurity Ltd.
                • Hornetsecurity Ltd. - Overview
                • Hornetsecurity Ltd. - Product / Service
                • Hornetsecurity Ltd. - Key offerings
                • SWOT
              • 15.14 Infosys Ltd.
                • Infosys Ltd. - Overview
                • Infosys Ltd. - Business segments
                • Infosys Ltd. - Key news
                • Infosys Ltd. - Key offerings
                • Infosys Ltd. - Segment focus
                • SWOT
              • 15.15 International Business Machines Corp.
                • International Business Machines Corp. - Overview
                • International Business Machines Corp. - Business segments
                • International Business Machines Corp. - Key news
                • International Business Machines Corp. - Key offerings
                • International Business Machines Corp. - Segment focus
                • SWOT
              • 15.16 Kaseya Ltd.
                • Kaseya Ltd. - Overview
                • Kaseya Ltd. - Product / Service
                • Kaseya Ltd. - Key offerings
                • SWOT
              • 15.17 LogicMonitor Inc.
                • LogicMonitor Inc. - Overview
                • LogicMonitor Inc. - Product / Service
                • LogicMonitor Inc. - Key offerings
                • SWOT
              • 15.18 Wipro Ltd.
                • Wipro Ltd. - Overview
                • Wipro Ltd. - Business segments
                • Wipro Ltd. - Key news
                • Wipro Ltd. - Key offerings
                • Wipro Ltd. - Segment focus
                • SWOT

              16 Appendix

              • 16.1 Scope of the report
                • 16.2 Inclusions and exclusions checklist
                  • Inclusions checklist
                  • Exclusions checklist
                • 16.3 Currency conversion rates for US$
                  • Currency conversion rates for US$
                • 16.4 Research methodology
                  • Research methodology
                • 16.5 Data procurement
                  • Information sources
                • 16.6 Data validation
                  • Data validation
                • 16.7 Validation techniques employed for market sizing
                  • Validation techniques employed for market sizing
                • 16.8 Data synthesis
                  • Data synthesis
                • 16.9 360 degree market analysis
                  • 360 degree market analysis
                • 16.10 List of abbreviations
                  • List of abbreviations

                Research Methodology

                Technavio presents a detailed picture of the market by way of study, synthesis, and summation of data from multiple sources. The analysts have presented the various facets of the market with a particular focus on identifying the key industry influencers. The data thus presented is comprehensive, reliable, and the result of extensive research, both primary and secondary.

                INFORMATION SOURCES

                Primary sources

                • Manufacturers and suppliers
                • Channel partners
                • Industry experts
                • Strategic decision makers

                Secondary sources

                • Industry journals and periodicals
                • Government data
                • Financial reports of key industry players
                • Historical data
                • Press releases

                DATA ANALYSIS

                Data Synthesis

                • Collation of data
                • Estimation of key figures
                • Analysis of derived insights

                Data Validation

                • Triangulation with data models
                • Reference against proprietary databases
                • Corroboration with industry experts

                REPORT WRITING

                Qualitative

                • Market drivers
                • Market challenges
                • Market trends
                • Five forces analysis

                Quantitative

                • Market size and forecast
                • Market segmentation
                • Geographical insights
                • Competitive landscape

                Interested in this report?

                Get your sample now to see our research methodology and insights!

                Download Now

                Frequently Asked Questions

                Msp Software market growth will increase by $ 55.1 mn during 2025-2029.

                The Msp Software market is expected to grow at a CAGR of 16% during 2025-2029.

                Msp Software market is segmented by Deployment( On-premises, Cloud-based, Hybrid, Others) Type( Managed data center, Managed network, Managed infrastructure, Managed mobility, Others) Application( Telecom and IT, BFSI, Retail, Media and entertainment, Others)

                Acronis International GmbH, AT and T Inc., Atera Networks Ltd., Auvik Networks Inc., Bravura Software LLC, Cisco Systems Inc., ConnectWise LLC, DNSFilter Inc., Hewlett Packard Enterprise Co., Hornetsecurity Ltd., Infosys Ltd., International Business Machines Corp., Kaseya Ltd., LogicMonitor Inc., Opmantek Software Pty Ltd., ServiceNow Inc., TitanHQ, Trend Micro Inc., Wipro Ltd., Zoho Corp. Pvt. Ltd. are a few of the key vendors in the Msp Software market.

                North America will register the highest growth rate of 35% among the other regions. Therefore, the Msp Software market in North America is expected to garner significant business opportunities for the vendors during the forecast period.

                US, Canada, China, Germany, Japan, India, UK, Italy, France, Brazil

                • Increased adoption of IoT solutionsThe IoT is a network of physical is the driving factor this market.
                • tangible objects that can communicate among themselves and is interconnected through technology and the internal and external environment. It connects hardware devices is the driving factor this market.
                • embedded software is the driving factor this market.
                • communication services is the driving factor this market.
                • and managed services. It creates smart communication environments such as smart homes is the driving factor this market.
                • smart shopping is the driving factor this market.
                • smart transportation is the driving factor this market.
                • and smart healthcare. Smart machines can control and monitor various objects using microcontrollers via the Internet from a remote location with the help of IoT technology. IoT is an enabler of MSP software is the driving factor this market.
                • as smart connected devices require managed communication services and for machine-to-machine communication (M2M). MSP software help to build end-to-end IoT infrastructure for smart communities is the driving factor this market.
                • smart healthcare is the driving factor this market.
                • smart home is the driving factor this market.
                • and smart transportation systems. Such factors will fuel the growth of the global MSP software market during the forecast period. is the driving factor this market.

                The Msp Software market vendors should focus on grabbing business opportunities from the On-premises segment as it accounted for the largest market share in the base year.