
AI In Smart Cities Market Size 2025-2029
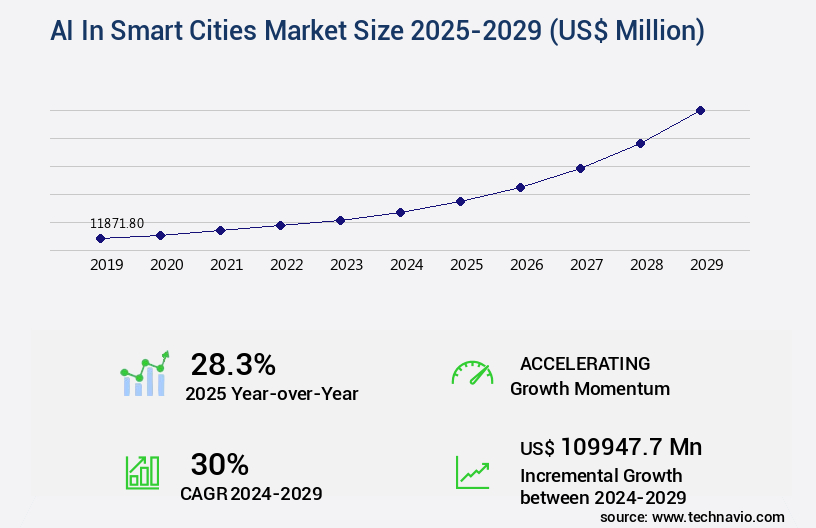
The AI in smart cities market size is valued to increase by USD 109.95 billion, at a CAGR of 30% from 2024 to 2029. Data privacy, security, and ethical concerns will drive the ai in smart cities market.
Major Market Trends & Insights
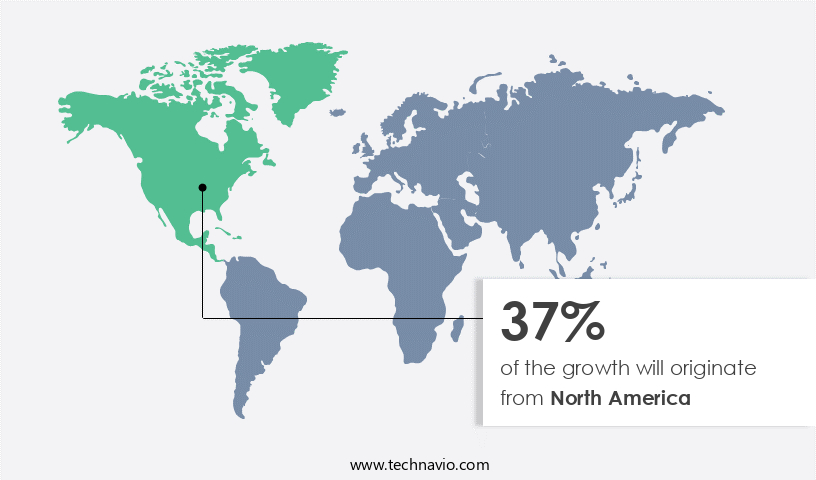
- North America dominated the market and accounted for a 37% growth during the forecast period.
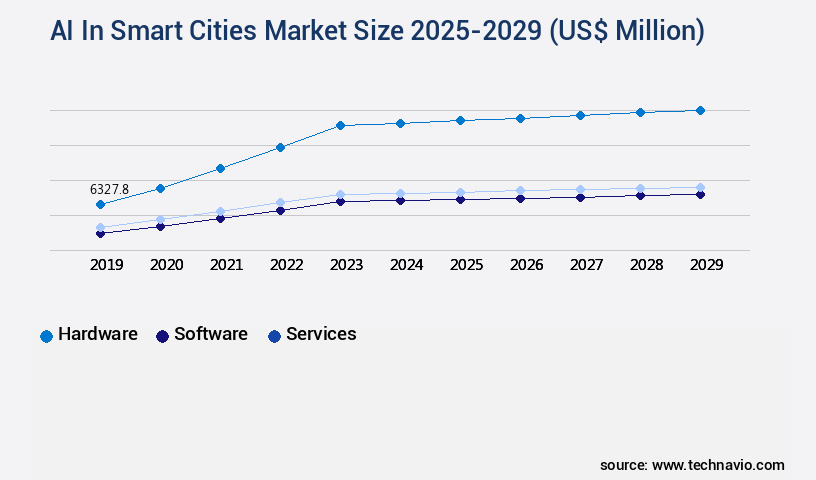
- By Component - Hardware segment was valued at USD 6.33 billion in 2023
- By Deployment - Cloud segment accounted for the largest market revenue share in 2023
Market Size & Forecast
- Market Opportunities: USD 1.00 million
- Market Future Opportunities: USD 109947.70 million
- CAGR from 2024 to 2029 : 30%
Market Summary
- In the realm of urban development, Artificial Intelligence (AI) has emerged as a pivotal catalyst for transforming cities into smart entities. According to recent market intelligence, The market is projected to reach a value of USD19.3 billion by 2025, underscoring its immense potential. This growth is driven by the intensification of urbanization pressures and the sustainability imperative, necessitating innovative solutions to manage resources efficiently and enhance citizen services. AI's role extends beyond mere automation; it is revolutionizing urban applications through generative capabilities. From traffic management and energy optimization to public safety and waste management, AI is redefining city services, delivering real-time insights and predictive analytics.
- Its ability to learn and adapt to complex urban environments is enabling cities to become more responsive, resilient, and sustainable. However, the integration of AI in Smart Cities also presents challenges. Data privacy, security, and ethical concerns demand careful consideration as cities embrace this technology. Balancing the benefits of AI with its potential risks requires a collaborative approach between governments, technology providers, and citizens. As the future of urban living unfolds, AI's role in creating smarter, more livable cities will continue to evolve, shaping the way we interact with our urban environments.
What will be the Size of the AI In Smart Cities Market during the forecast period?
Get Key Insights on Market Forecast (PDF) Request Free Sample
How is the AI In Smart Cities Market Segmented ?
The AI in smart cities industry research report provides comprehensive data (region-wise segment analysis), with forecasts and estimates in "USD million" for the period 2025-2029, as well as historical data from 2019-2023 for the following segments.
- Component
- Hardware
- Software
- Services
- Deployment
- Cloud
- On-premises
- Technology
- Machine learning
- Computer vision
- Edge AI
- NLP
- Others
- Application
- Traffic management
- Infrastructure management
- Public safety and security
- Environmental monitoring
- Others
- Geography
- North America
- US
- Canada
- Europe
- France
- Germany
- UK
- APAC
- China
- India
- Japan
- South Korea
- South America
- Brazil
- Rest of World (ROW)
- North America
By Component Insights
The hardware segment is estimated to witness significant growth during the forecast period.
The market is witnessing continuous evolution, with advanced technologies like deep learning applications, machine learning models, and computer vision systems transforming urban infrastructure. This market encompasses various sectors, including crime prediction models, public transportation scheduling, energy consumption monitoring, and real-time traffic optimization. For instance, AI-powered traffic management systems can reduce congestion by up to 20%, while predictive policing algorithms enhance public safety. The integration of autonomous vehicle integration, smart parking solutions, and building automation systems further enhances urban efficiency. Moreover, smart infrastructure monitoring, AI-driven urban planning, and smart grid technologies ensure resource optimization and environmental sustainability.
However, data privacy regulations, cybersecurity protocols, and open data initiatives remain critical considerations to ensure ethical and secure implementation. Overall, the market is a dynamic and essential sector, driving innovation and improving the quality of life in urban areas.
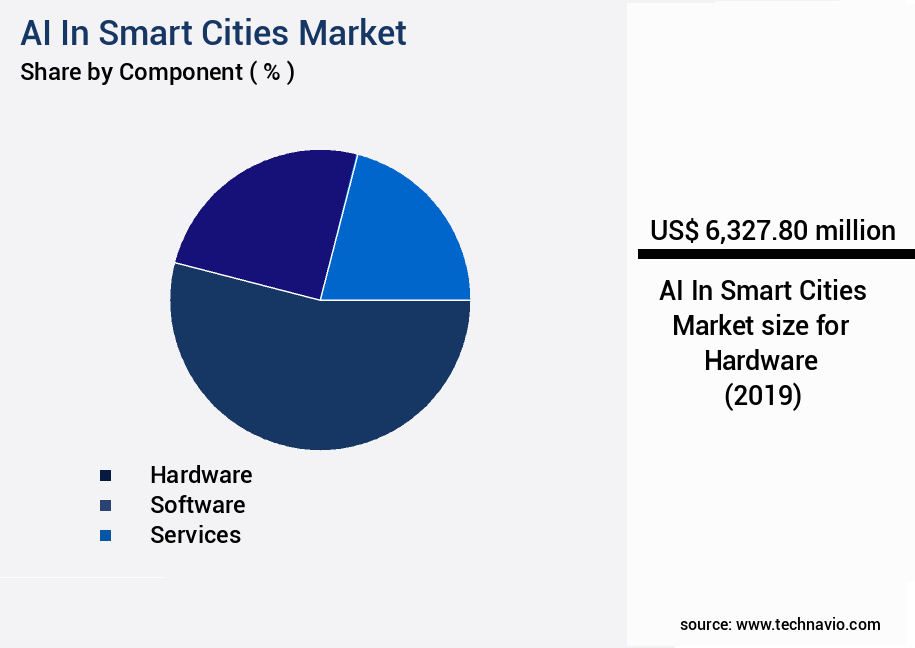
The Hardware segment was valued at USD 6.33 billion in 2019 and showed a gradual increase during the forecast period.
Regional Analysis
North America is estimated to contribute 37% to the growth of the global market during the forecast period.Technavio's analysts have elaborately explained the regional trends and drivers that shape the market during the forecast period.
See How AI In Smart Cities Market Demand is Rising in North America Request Free Sample
The market is witnessing significant evolution, with North America leading the charge, particularly in the United States and Canada. Unlike emerging markets that focus on building new cities from scratch, this region prioritizes upgrading existing urban environments, or brownfield development. This approach necessitates a unique deployment strategy, focusing on retrofitting legacy infrastructure and seamlessly integrating intelligent systems into established operational workflows. Key drivers for AI adoption include enhancing public safety, addressing chronic traffic congestion, modernizing aging utility grids, and improving the efficiency and accessibility of citizen services.
Domestic technology giants dominate the competitive landscape, providing the essential cloud, software, and hardware components that underpin smart city development.
Market Dynamics
Our researchers analyzed the data with 2024 as the base year, along with the key drivers, trends, and challenges. A holistic analysis of drivers will help companies refine their marketing strategies to gain a competitive advantage.
The market is experiencing rapid growth as cities worldwide seek to leverage advanced technologies to enhance urban living. AI algorithms for traffic congestion management are a key application, using sensor data fusion techniques to optimize traffic flow and reduce congestion. Predictive maintenance strategies, powered by AI, are transforming infrastructure planning by identifying potential issues before they become major problems. IoT device management platforms are essential for managing the vast array of sensors and devices that make up smart city infrastructure. Data analytics for urban planning is another critical application, providing insights into energy usage, public transportation optimization, and smart parking space availability. Real-time crime detection systems use AI-powered public safety tools to enhance community safety, while environmental monitoring dashboards help cities manage air quality and other environmental concerns.
Energy efficient building management is a significant focus for smart cities, with AI-driven resource allocation and automated streetlight dimming helping to reduce energy consumption. Citizen engagement mobile apps are also becoming increasingly important, allowing residents to report issues, access city services, and receive real-time information. However, the implementation of AI in smart cities is not without challenges. Data security and privacy concerns must be addressed, with open data standards compliance and cloud-based AI model training essential for ensuring data protection. Interoperability challenges also persist, with the need for seamless communication between different systems and devices. Despite these challenges, the benefits of AI in smart cities are clear, and the market is expected to continue growing in the coming years.
What are the key market drivers leading to the rise in the adoption of AI In Smart Cities Industry?
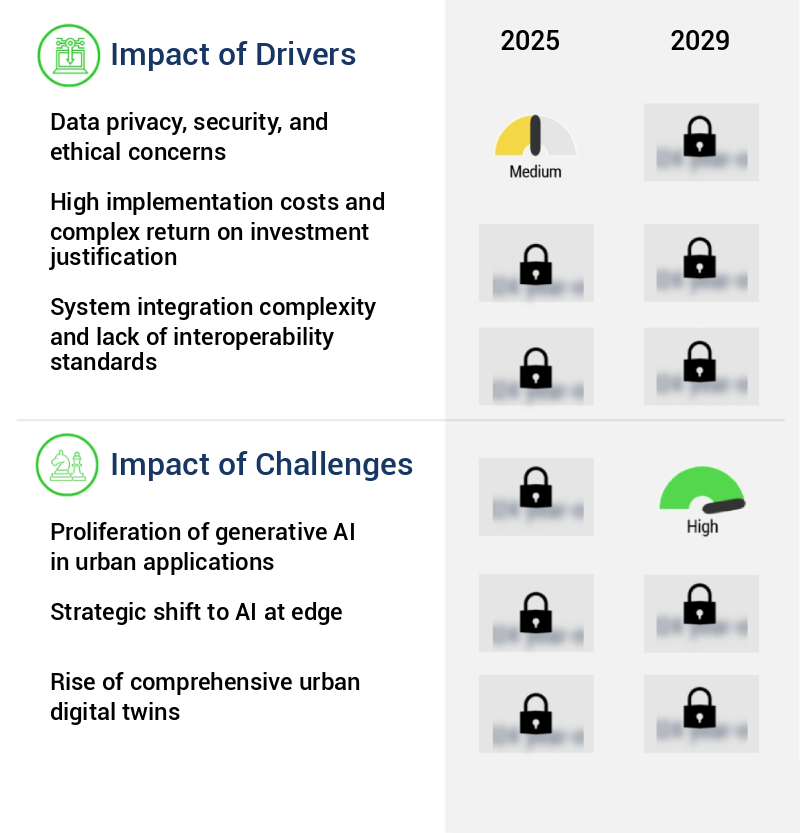
- Data privacy, security, and ethical concerns serve as the primary driving force in the market, shaping its development and growth.
- The integration of Artificial Intelligence (AI) in smart cities is a complex undertaking, shaped by the challenges of data privacy, cybersecurity, and ethical considerations. With the increasing use of AI in various sectors, such as transportation, energy management, and public safety, the collection and analysis of granular data have become essential. This data, which includes location data from mobile devices, video footage from public surveillance cameras, utility consumption patterns, and personal information from digital government services, necessitates robust security measures. According to recent estimates, the global smart cities market is projected to reach USD1.5 trillion by 2025, representing a significant surge in investment and growth.
- Concurrently, cybersecurity spending in the sector is expected to reach USD4.5 billion by 2023, underscoring the importance of securing this sensitive data.
What are the market trends shaping the AI In Smart Cities Industry?
- The intensification of urbanization pressures and the sustainability imperative are emerging as significant market trends.
- The market is experiencing significant growth as urbanization continues to accelerate and cities strive to become more sustainable and efficient. Traditional management methods are insufficient to address the intricate and vast challenges facing modern urban centers, such as chronic traffic congestion, strained energy grids, inefficient waste management, and deteriorating water systems. These issues are interconnected and require a holistic, proactive approach. AI technology, with its ability to analyze vast amounts of data in real-time, offers a promising solution.
- According to recent estimates, the global smart cities market is expected to reach USD1.5 trillion by 2025, representing a substantial increase from its current size. In the transportation sector alone, AI is projected to reduce traffic congestion by up to 30% and decrease energy consumption by 15%. By implementing AI solutions, cities can optimize their resources, improve infrastructure, and enhance the quality of life for their residents.
What challenges does the AI In Smart Cities Industry face during its growth?
- The proliferation of generative AI in urban applications poses a significant challenge to the industry's growth, requiring careful consideration and strategic implementation to ensure optimal results and mitigate potential risks.
- The market is experiencing a transformative shift with the increasing adoption of generative artificial intelligence (AI). This advanced technology goes beyond traditional predictive analytics and machine learning, offering a new dimension of creation, simulation, and interaction. Generative AI is being explored in various sectors of urban management and planning to tackle intricate challenges. For example, in urban design, it generates numerous architectural and zoning scenarios based on given constraints, such as maximizing green space, optimizing traffic flow, and complying with environmental regulations.
- This enables urban planners to evaluate a multitude of potential futures in a significantly reduced timeframe compared to conventional methods. The integration of generative AI in smart cities is poised to revolutionize urban development and management.
Exclusive Technavio Analysis on Customer Landscape
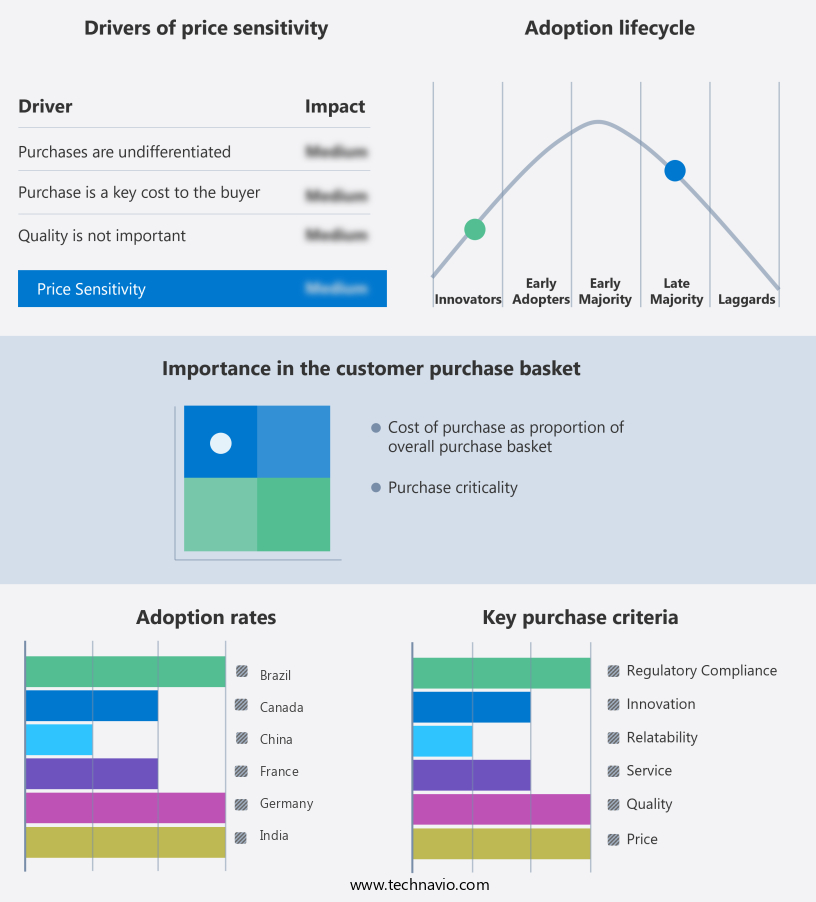
The ai in smart cities market forecasting report includes the adoption lifecycle of the market, covering from the innovator's stage to the laggard's stage. It focuses on adoption rates in different regions based on penetration. Furthermore, the ai in smart cities market report also includes key purchase criteria and drivers of price sensitivity to help companies evaluate and develop their market growth analysis strategies.
Customer Landscape of AI In Smart Cities Industry
Competitive Landscape
Companies are implementing various strategies, such as strategic alliances, ai in smart cities market forecast, partnerships, mergers and acquisitions, geographical expansion, and product/service launches, to enhance their presence in the industry.
ABB Ltd. - The company specializes in AI technology for smart cities, delivering advanced analytics for energy efficiency and intelligent building management through solutions like ABB Ability. This technology enhances urban infrastructure by optimizing energy usage and improving overall management in urban environments.
The industry research and growth report includes detailed analyses of the competitive landscape of the market and information about key companies, including:
- ABB Ltd.
- Cisco Systems Inc.
- DeepMind Technologies Ltd.
- General Electric Co.
- Hitachi Ltd.
- Huawei Technologies Co. Ltd.
- Intel Corp.
- International Business Machines Corp.
- Microsoft Corp.
- NEC Corp.
- Oracle Corp.
- Palantir Technologies Inc.
- SAP SE
- Schneider Electric SE
- Siemens AG
- StreetLight Data Inc.
- Telefonaktiebolaget LM Ericsson
- Toshiba Corp.
Qualitative and quantitative analysis of companies has been conducted to help clients understand the wider business environment as well as the strengths and weaknesses of key industry players. Data is qualitatively analyzed to categorize companies as pure play, category-focused, industry-focused, and diversified; it is quantitatively analyzed to categorize companies as dominant, leading, strong, tentative, and weak.
Recent Development and News in AI In Smart Cities Market
- In January 2024, IBM and Cisco Systems announced a strategic partnership to integrate IBM's AI capabilities into Cisco's smart city solutions. This collaboration aimed to enhance urban infrastructure management and improve citizen services (IBM Press Release, 2024).
- In March 2024, SenseTime, a leading AI company, raised a record-breaking USD1.5 billion in a funding round, boosting its valuation to USD4.5 billion. The funds would be used to expand its AI offerings in smart city applications (CNBC, 2024).
- In May 2024, the European Union approved the European Digital Single Market Act, which includes provisions for the deployment of AI in smart cities. The act aims to create a unified digital market and promote the use of AI in various sectors, including urban development (European Commission, 2024).
- In January 2025, Microsoft and NVIDIA announced a strategic partnership to develop AI-powered data centers for smart cities. These centers would help process and analyze large amounts of data generated by various city systems, improving city management and services (Microsoft Press Release, 2025).
Dive into Technavio's robust research methodology, blending expert interviews, extensive data synthesis, and validated models for unparalleled AI In Smart Cities Market insights. See full methodology.
|
Market Scope |
|
|
Report Coverage |
Details |
|
Page number |
271 |
|
Base year |
2024 |
|
Historic period |
2019-2023 |
|
Forecast period |
2025-2029 |
|
Growth momentum & CAGR |
Accelerate at a CAGR of 30% |
|
Market growth 2025-2029 |
USD 109947.7 million |
|
Market structure |
Fragmented |
|
YoY growth 2024-2025(%) |
28.3 |
|
Key countries |
US, Germany, UK, China, France, Canada, South Korea, Brazil, Japan, and India |
|
Competitive landscape |
Leading Companies, Market Positioning of Companies, Competitive Strategies, and Industry Risks |
Research Analyst Overview
- The smart cities market continues to evolve, with artificial intelligence (AI) playing an increasingly significant role in various sectors. Crime prediction models employ deep learning applications to analyze patterns and prevent potential incidents, while public transportation scheduling utilizes real-time traffic optimization and machine learning models to enhance efficiency. Energy consumption monitoring and management systems use AI-powered traffic management and building automation to reduce waste and improve sustainability. Air quality monitoring and data analytics dashboards enable cities to address environmental concerns, with computer vision systems and IoT device integration facilitating continuous monitoring. AI-driven urban planning and smart grid technologies optimize resource usage, leading to significant industry growth expectations of over 20% annually.
- For instance, a city implemented predictive policing algorithms, reducing crime by 30% in targeted areas. Meanwhile, AI-powered traffic management and smart parking solutions improve mobility and reduce congestion. Noise pollution reduction and emergency response systems ensure public safety, while open data initiatives and cybersecurity protocols maintain transparency and security. Environmental monitoring sensors, water resource management systems, and citizen engagement platforms foster a more connected and sustainable urban environment. Autonomous vehicle integration and smart infrastructure monitoring further enhance the city's capabilities, ensuring a smarter, more efficient future.
What are the Key Data Covered in this AI In Smart Cities Market Research and Growth Report?
-
What is the expected growth of the AI In Smart Cities Market between 2025 and 2029?
-
USD 109.95 billion, at a CAGR of 30%
-
-
What segmentation does the market report cover?
-
The report is segmented by Component (Hardware, Software, and Services), Deployment (Cloud and On-premises), Technology (Machine learning, Computer vision, Edge AI, NLP, and Others), Application (Traffic management, Infrastructure management, Public safety and security, Environmental monitoring, and Others), and Geography (North America, Europe, APAC, Middle East and Africa, and South America)
-
-
Which regions are analyzed in the report?
-
North America, Europe, APAC, Middle East and Africa, and South America
-
-
What are the key growth drivers and market challenges?
-
Data privacy, security, and ethical concerns, Proliferation of generative AI in urban applications
-
-
Who are the major players in the AI In Smart Cities Market?
-
ABB Ltd., Cisco Systems Inc., DeepMind Technologies Ltd., General Electric Co., Hitachi Ltd., Huawei Technologies Co. Ltd., Intel Corp., International Business Machines Corp., Microsoft Corp., NEC Corp., Oracle Corp., Palantir Technologies Inc., SAP SE, Schneider Electric SE, Siemens AG, StreetLight Data Inc., Telefonaktiebolaget LM Ericsson, and Toshiba Corp.
-
Market Research Insights
- The market for AI in smart cities is a continuously evolving landscape, with cities around the world investing in data governance frameworks and performance evaluation methods to optimize infrastructure and enhance public services. For instance, the integration of AI in traffic management systems has led to a reduction of up to 20% in congestion and improved emergency response times. Furthermore, the industry is projected to grow by over 25% annually, driven by the adoption of advanced technologies such as edge computing deployment, big data processing, and automated incident detection. These solutions enable cities to monitor and manage smart city metrics in real-time, ensuring energy efficiency gains and environmental sustainability.
- Additionally, the implementation of digital twin modeling, simulation and modeling, and 5G network infrastructure facilitates the seamless integration of various systems, from network security measures and system architecture design to citizen feedback mechanisms and API integration strategies. The use of cloud-based data storage, blockchain technology, and interoperability standards further enhances data security and accessibility, ensuring the efficient delivery of public services.
We can help! Our analysts can customize this AI in smart cities market research report to meet your requirements.
 RIA -
RIA - 
