Reusable Icepacks Market Analysis, Size, and Forecast 2026-2030: North America (US, Canada, and Mexico), APAC (China, Japan, and India), Europe (Germany, UK, and France), South America (Brazil and Argentina), Middle East and Africa (Saudi Arabia, UAE, and South Africa), and Rest of World (ROW)

Reusable Icepacks Market Analysis, Size, and Forecast 2026-2030:
North America (US, Canada, and Mexico), APAC (China, Japan, and India), Europe (Germany, UK, and France), South America (Brazil and Argentina), Middle East and Africa (Saudi Arabia, UAE, and South Africa), and Rest of World (ROW)

Published: Mar 2026 295 Pages SKU: IRTNTR40024

Market Overview at a Glance

$397.4 Mn
Market Opportunity
5.6%
CAGR 2025 - 2030
42.5%
APAC Growth
$720.5 Mn
Ice or dry icepacks segment 2024

Reusable Icepacks Market Size 2026-2030

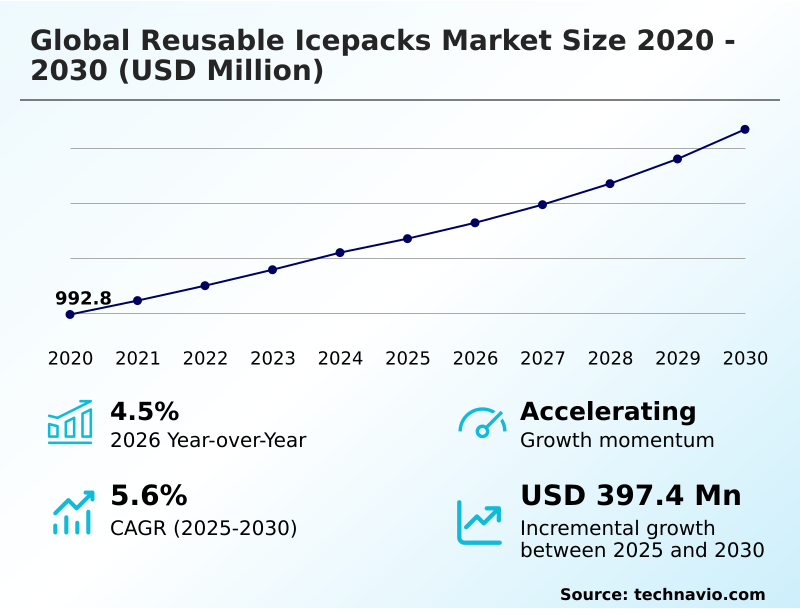
The reusable icepacks market size is valued to increase by USD 397.4 million, at a CAGR of 5.6% from 2025 to 2030. Expansion of pharmaceutical cold chain will drive the reusable icepacks market.

Major Market Trends & Insights

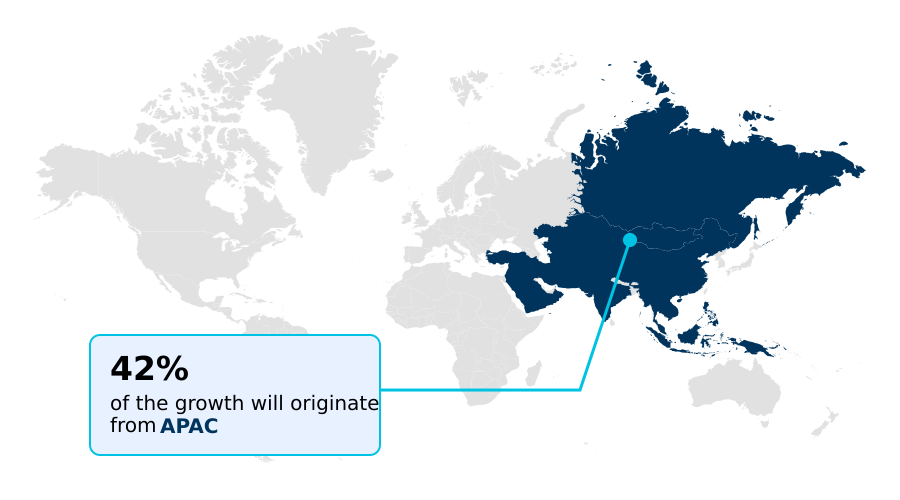
  • APAC dominated the market and accounted for a 42.5% growth during the forecast period.
  • By Product - Ice or dry icepacks segment was valued at USD 720.5 million in 2024
  • By Application - Food and beverage segment accounted for the largest market revenue share in 2024

Market Size & Forecast

  • Market Opportunities: USD 673.2 million
  • Market Future Opportunities: USD 397.4 million
  • CAGR from 2025 to 2030 : 5.6%

Market Summary

  • The reusable icepacks market is integral to maintaining the integrity of temperature-sensitive supply chains in the pharmaceutical and food and beverage industries. Growth is propelled by the increasing demand for biologics and fresh food logistics, which necessitate stringent thermal control.
  • A key trend is the shift toward sustainable thermal packaging, driven by corporate environmental goals and regulations aimed at reducing single-use plastic waste. This is leading to the adoption of circular logistics models and innovations in materials, such as bio-based polymers and advanced phase change material formulations that offer superior thermal stability.
  • For instance, a logistics provider might implement a closed-loop system using smart packs with asset tracking technology to monitor assets, reduce loss, and ensure cold chain integrity. However, the market faces challenges related to the high initial investment for durable packs and the operational complexities of reverse logistics, including collection, sanitization, and redeployment.
  • Success hinges on balancing performance, cost, and sustainability to meet evolving industry standards.

What will be the Size of the Reusable Icepacks Market during the forecast period?

Get Key Insights on Market Forecast (PDF) Request Free Sample

How is the Reusable Icepacks Market Segmented?

The reusable icepacks industry research report provides comprehensive data (region-wise segment analysis), with forecasts and estimates in "USD million" for the period 2026-2030, as well as historical data from 2020-2024 for the following segments.
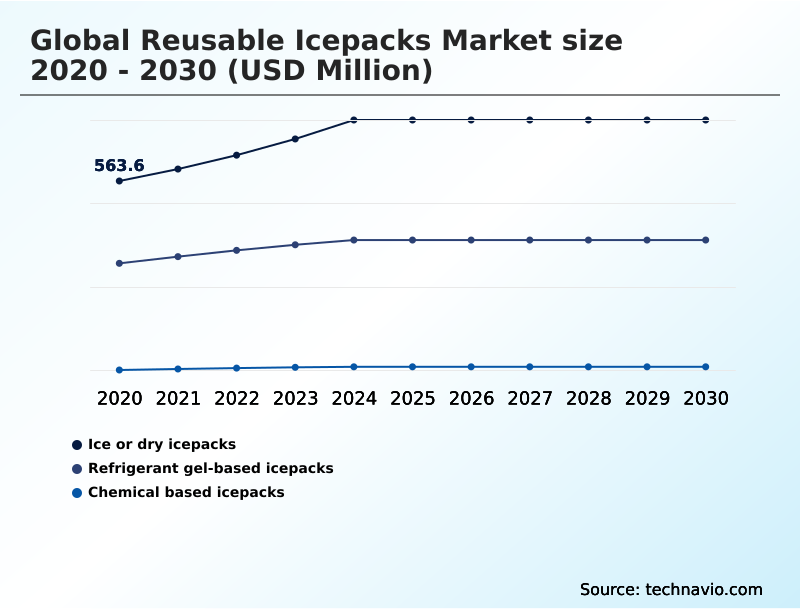
  • Product
    • Ice or dry icepacks
    • Refrigerant gel-based icepacks
    • Chemical based icepacks
  • Application
    • Food and beverage
    • Medical and healthcare
    • Chemicals
  • Distribution channel
    • Online retail
    • Offline retail
    • Institutional sales
  • Geography
    • North America
      • US
      • Canada
      • Mexico
    • APAC
      • China
      • Japan
      • India
    • Europe
      • Germany
      • UK
      • France
    • South America
      • Brazil
      • Argentina
    • Middle East and Africa
      • Saudi Arabia
      • UAE
      • South Africa
    • Rest of World (ROW)

By Product Insights

The ice or dry icepacks segment is estimated to witness significant growth during the forecast period.

The market is segmented by product types that address specific thermal requirements. Innovations in advanced material science are enhancing the performance of the refrigerant gel pack segment, improving thermal stability to meet stringent environmental regulations.

These advancements mitigate the risk of temperature excursion events, preserving cold chain integrity for sensitive goods.

Formulations using bio based polymer and plant based polymer are gaining traction, supporting the development of zero waste cooling solution options like the biodegradable thermal liner. Meanwhile, products relying on an endothermic chemical reaction offer instant, on-demand cooling.

The focus on improved thermal inertia has extended shelf life extension by over 30% in certain applications, showcasing the segment's evolution.

Request Free Sample

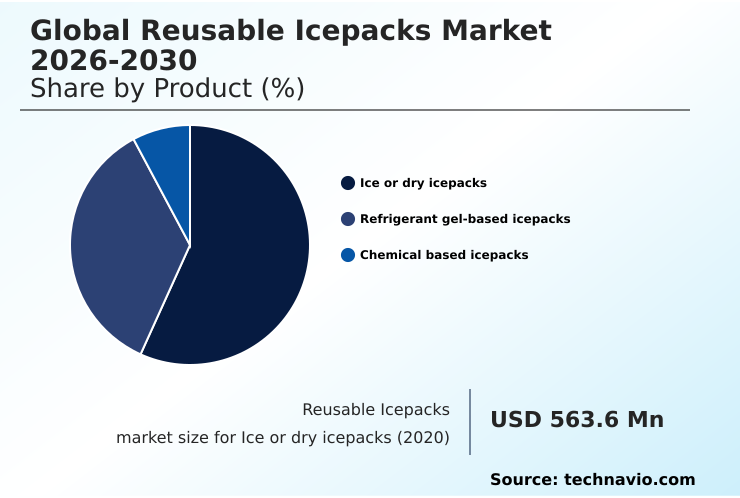
The Ice or dry icepacks segment was valued at USD 720.5 million in 2024 and showed a gradual increase during the forecast period.

Request Free Sample

Regional Analysis

APAC is estimated to contribute 42.5% to the growth of the global market during the forecast period.Technavio’s analysts have elaborately explained the regional trends and drivers that shape the market during the forecast period.

See How Reusable Icepacks Market Demand is Rising in APAC Request Free Sample

The geographic landscape of the market reveals a contrast between mature and high-growth regions. North America and Europe lead in the adoption of validated shipping systems for their robust pharmaceutical cold chains, where standardized cooling protocols are critical.

These regions leverage passive reusable cold chain solutions, including medical grade reusable packs and ultra-low temperature units, for industrial chemical transport and complex global supply chain management.

Meanwhile, the APAC region is projected to contribute 42.5% of the market's incremental growth, driven by escalating demand for perishable goods protection and improving logistics infrastructure. This expansion supports the need for high-capacity cooling agent solutions optimized for temperature-controlled transport.

The rapid development in APAC outpaces North America’s steady 4.5% expansion, highlighting a global shift in market dynamics.

Market Dynamics

Our researchers analyzed the data with 2025 as the base year, along with the key drivers, trends, and challenges. A holistic analysis of drivers will help companies refine their marketing strategies to gain a competitive advantage.

  • Strategic planning within the reusable icepacks market requires a comprehensive cost analysis of reusable icepacks, balancing upfront expenditures with long-term savings. An investment in circular logistics systems is critical, but success is contingent on solving reusable icepack reverse logistics challenges. Optimizing icepack reuse cycles through effective asset tracking to prevent loss is essential for profitability.
  • Technologically, the focus is on enhancing phase change material thermal performance and the IoT integration in reusable icepacks. This enables real-time monitoring for shipments and provides data for temperature validation for food delivery.
  • For the healthcare sector, this technology is vital for the reusable icepack for pharmaceutical transport, especially for advanced cooling for biologics, where managing temperature excursions in shipping is non-negotiable. Material innovation, including the use of sustainable materials in thermal packaging and bio-based polymers for gel packs, addresses the need for cold chain packaging waste reduction.
  • Furthermore, stringent reusable icepack sanitization protocols and thorough durability testing for reusable packs are necessary to meet regulatory compliance for cooling agents. Implementing smart tracking for cold chain assets has been shown to improve asset recovery rates by over 40% compared to manual methods, directly impacting operational efficiency and reducing the total cost of ownership.

What are the key market drivers leading to the rise in the adoption of Reusable Icepacks Industry?

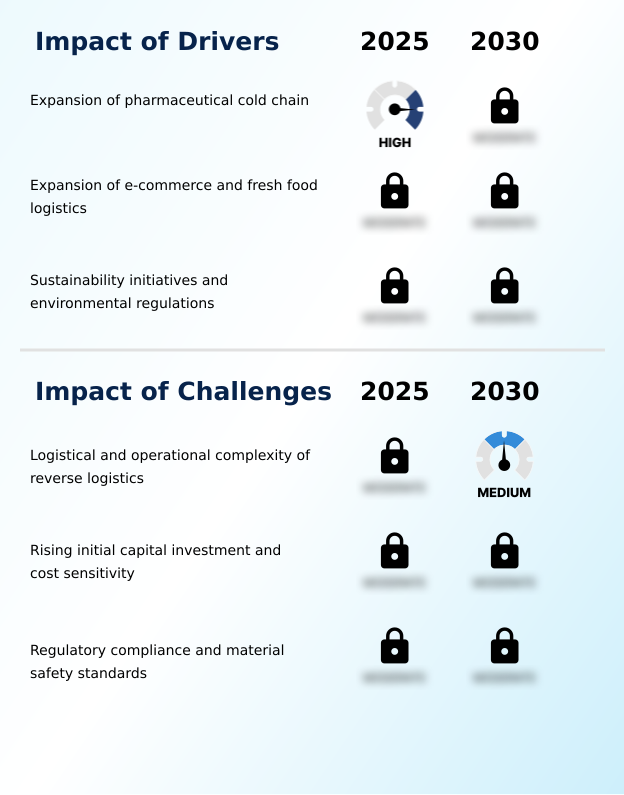
  • The expansion of the pharmaceutical cold chain, particularly for biologics and specialty medicines, is a key driver for market growth.

  • Key market drivers are centered on sustainability and logistical efficiency, particularly within the pharmaceutical cold chain and fresh food logistics sectors.
  • The industry-wide push for sustainable business practices is accelerating the adoption of sustainable thermal packaging and the implementation of a circular logistics model.
  • These initiatives directly address the need for single-use plastic reduction and overall packaging waste reduction, with companies adopting these models reporting a 20% decrease in waste.
  • A durable icepack design contributes to a more cost-effective cooling solution over the long term.
  • Furthermore, the expansion of e-commerce has intensified the focus on last-mile delivery, where innovations like the temperature-controlled locker and closed-loop cooling system are critical for maintaining product quality.

What are the market trends shaping the Reusable Icepacks Industry?

  • The market is witnessing a significant trend toward the integration of advanced phase change materials. This shift is driven by the need for enhanced thermal performance and extended temperature stability.

  • Market trends are increasingly focused on technological integration and material science to enhance thermal performance validation. The adoption of the advanced cooling module and high-performance gel pack is becoming standard for long-duration shipments, where maintaining precise temperatures is critical.
  • Innovations include the use of a non-toxic cooling agent and the development of the modular cooling system, allowing for greater flexibility in logistics. The proliferation of smart tracking integration is a key trend, with near-field communication tags and cloud-based data platforms enabling real-time temperature monitoring.
  • This technology provides unprecedented supply chain transparency and has been shown to reduce asset loss prevention by over 60%, ensuring that shipments of high-value goods reach their destination securely.

What challenges does the Reusable Icepacks Industry face during its growth?

  • The logistical and operational complexity associated with managing reverse logistics for reusable assets presents a key challenge to industry growth.

  • The market faces significant challenges related to the operational and financial complexities of adopting reusable systems. The initial capital investment can be up to ten times higher than for single-use alternatives, which presents a barrier for smaller enterprises despite a high return on investment often being achieved after just 15 reuse cycles.
  • The effective management of reverse logistics management is another primary hurdle, contributing to operational overhead reduction goals. Ensuring supply chain efficiency requires robust asset tracking technology and streamlined sanitization and reuse processes.
  • Adherence to regulatory compliance standards for materials and handling further complicates operations, demanding rigorous protocols to ensure product integrity preservation and prevent issues like bacterial growth risk and cross-contamination prevention, all while navigating raw material price volatility.

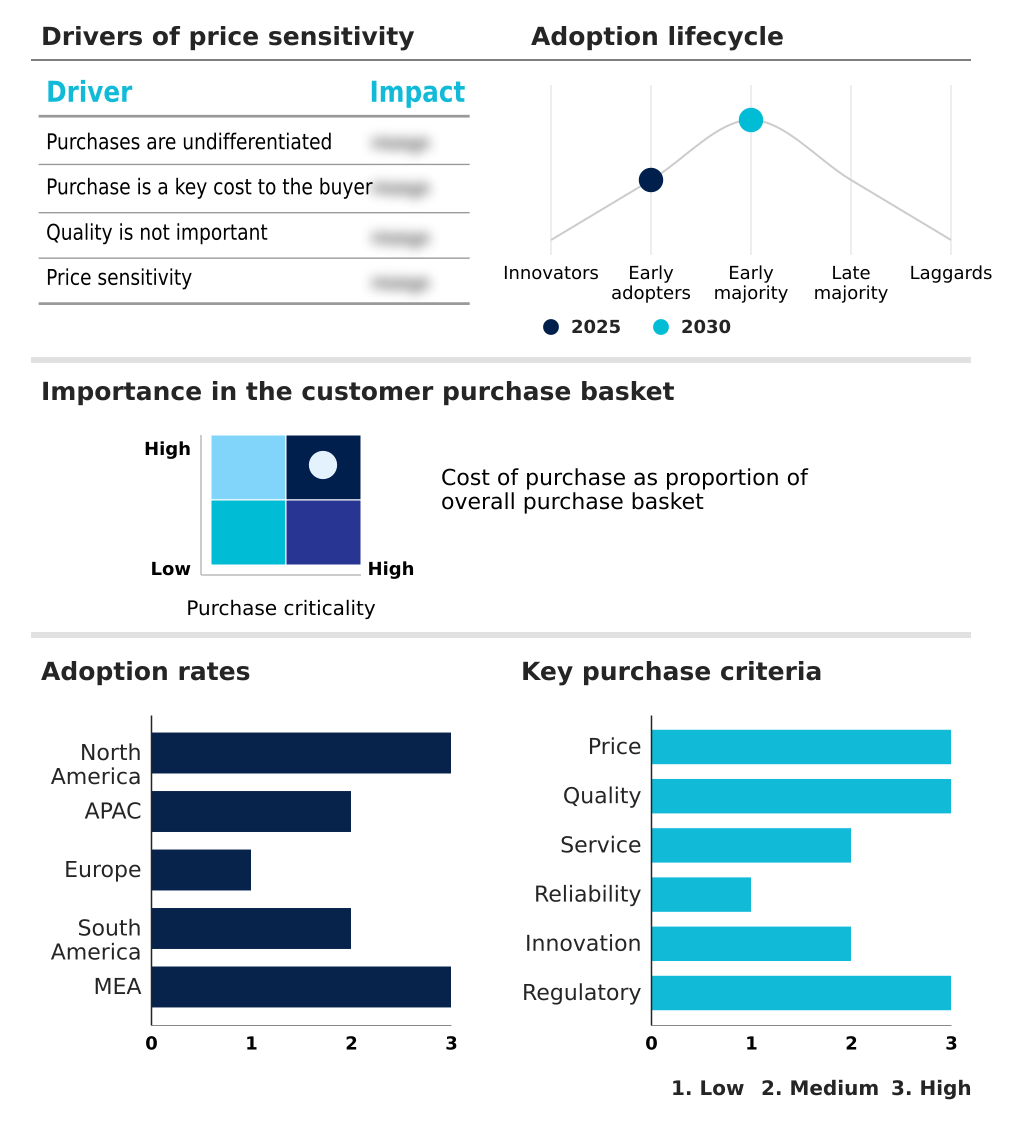
Exclusive Technavio Analysis on Customer Landscape

The reusable icepacks market forecasting report includes the adoption lifecycle of the market, covering from the innovator’s stage to the laggard’s stage. It focuses on adoption rates in different regions based on penetration. Furthermore, the reusable icepacks market report also includes key purchase criteria and drivers of price sensitivity to help companies evaluate and develop their market growth analysis strategies.

Customer Landscape of Reusable Icepacks Industry

Competitive Landscape

Companies are implementing various strategies, such as strategic alliances, reusable icepacks market forecast, partnerships, mergers and acquisitions, geographical expansion, and product/service launches, to enhance their presence in the industry.

3M Co. - The company provides versatile reusable thermal packs for consumer and healthcare applications, focusing on therapeutic and personal care use cases.

The industry research and growth report includes detailed analyses of the competitive landscape of the market and information about key companies, including:

  • 3M Co.
  • Accurate Manufacturing Inc.
  • Ace Hardware Corp.
  • Arctic Ice LLC
  • Bent Grass Concepts
  • Cardinal Health Inc.
  • Cold Chain Technologies LLC
  • Cryopak
  • Dometic Group AB
  • GVS International
  • IceCold Gel Packs
  • Insulated Products Corp.
  • King Brand Healthcare Products
  • Medline Inc.
  • MVS In Motion
  • Navagen Products Pvt. Ltd.
  • Nordic Cold Chain Solutions
  • Pitreavie Group
  • TECHNI ICE
  • ThermoSafe Technologies Inc.

Qualitative and quantitative analysis of companies has been conducted to help clients understand the wider business environment as well as the strengths and weaknesses of key industry players. Data is qualitatively analyzed to categorize companies as pure play, category-focused, industry-focused, and diversified; it is quantitatively analyzed to categorize companies as dominant, leading, strong, tentative, and weak.

Recent Development and News in Reusable icepacks market

  • In August 2024, DoorDash introduced a premium grocery delivery service that leverages specialized cooling bags and reusable icepacks to ensure the freshness of perishable goods upon delivery.
  • In September 2024, Sealed Air Corporation launched a new line of high-durability cooling packs manufactured from renewable plant-based polymers, addressing the growing demand for eco-friendly packaging solutions.
  • In December 2024, Blue Apron announced a $5 million enhancement in its logistical efficiency after transitioning to a more durable reusable icepack design aimed at reducing packaging waste.
  • In March 2025, Rakuten Group expanded its refrigerated delivery network in Japan by deploying advanced temperature-controlled lockers that integrate reusable icepacks to maintain product quality during last-mile delivery.

Dive into Technavio’s robust research methodology, blending expert interviews, extensive data synthesis, and validated models for unparalleled Reusable Icepacks Market insights. See full methodology.

Market Scope
Page number 295
Base year 2025
Historic period 2020-2024
Forecast period 2026-2030
Growth momentum & CAGR Accelerate at a CAGR of 5.6%
Market growth 2026-2030 USD 397.4 million
Market structure Fragmented
YoY growth 2025-2026(%) 4.5%
Key countries US, Canada, Mexico, China, Japan, India, South Korea, Australia, Indonesia, Germany, UK, France, Italy, Spain, The Netherlands, Brazil, Argentina, Chile, Saudi Arabia, UAE, South Africa, Israel and Turkey
Competitive landscape Leading Companies, Market Positioning of Companies, Competitive Strategies, and Industry Risks

Request Free Sample

Research Analyst Overview

  • The reusable icepacks market is undergoing a significant transformation driven by the dual imperatives of sustainability and performance. The strategic shift from disposable to durable solutions necessitates a boardroom-level focus on allocating capital for a circular logistics model, which aligns with tightening environmental regulations.
  • This transition involves more than just product substitution; it requires investment in reverse logistics management and asset tracking technology. Innovations in material science are producing non-toxic cooling agents, bio based polymers, and biodegradable thermal liners that support a zero-waste cooling solution.
  • At the same time, advancements in phase change material technology are creating high-performance gel packs and advanced cooling modules with superior thermal inertia, crucial for the pharmaceutical cold chain and fresh food logistics. Validated shipping systems incorporating these technologies have demonstrated the ability to reduce temperature excursions by up to 98%, ensuring cold chain integrity.
  • The integration of near-field communication tags and cloud-based data platforms into these modular cooling systems enhances supply chain transparency and efficiency, making the closed-loop cooling system a viable and profitable strategy.

What are the Key Data Covered in this Reusable Icepacks Market Research and Growth Report?

  • What is the expected growth of the Reusable Icepacks Market between 2026 and 2030?

    • USD 397.4 million, at a CAGR of 5.6%

  • What segmentation does the market report cover?

    • The report is segmented by Product (Ice or dry icepacks, Refrigerant gel-based icepacks, and Chemical based icepacks), Application (Food and beverage, Medical and healthcare, and Chemicals), Distribution Channel (Online retail, Offline retail, and Institutional sales) and Geography (North America, APAC, Europe, South America, Middle East and Africa)

  • Which regions are analyzed in the report?

    • North America, APAC, Europe, South America and Middle East and Africa

  • What are the key growth drivers and market challenges?

    • Expansion of pharmaceutical cold chain, Logistical and operational complexity of reverse logistics

  • Who are the major players in the Reusable Icepacks Market?

    • 3M Co., Accurate Manufacturing Inc., Ace Hardware Corp., Arctic Ice LLC, Bent Grass Concepts, Cardinal Health Inc., Cold Chain Technologies LLC, Cryopak, Dometic Group AB, GVS International, IceCold Gel Packs, Insulated Products Corp., King Brand Healthcare Products, Medline Inc., MVS In Motion, Navagen Products Pvt. Ltd., Nordic Cold Chain Solutions, Pitreavie Group, TECHNI ICE and ThermoSafe Technologies Inc.

Market Research Insights

  • The market is defined by a strategic shift toward sustainable and efficient thermal management, where circular economy principles are paramount. Adopting reusable thermal modules improves supply chain efficiency by up to 15% and reduces packaging waste by over 70%, offering a compelling case for moving away from single-use plastics.
  • The implementation of real-time temperature monitoring for perishable goods protection during temperature-controlled transport is becoming a standard practice, particularly for last-mile delivery. This integration of smart technology provides enhanced supply chain transparency and has been shown to reduce asset loss by 90% in closed-loop systems.
  • These advancements ensure cost-effective cooling and support the broader industry move toward more sustainable business practices, aligning operational goals with environmental responsibility.

We can help! Our analysts can customize this reusable icepacks market research report to meet your requirements.

Get in touch

1. Executive Summary

1.1 Market overview

Executive Summary - Chart on Market Overview
Executive Summary - Data Table on Market Overview
Executive Summary - Chart on Global Market Characteristics
Executive Summary - Chart on Market by Geography
Executive Summary - Chart on Market Segmentation by Product
Executive Summary - Chart on Market Segmentation by Application
Executive Summary - Chart on Market Segmentation by Distribution Channel
Executive Summary - Chart on Incremental Growth
Executive Summary - Data Table on Incremental Growth
Executive Summary - Chart on Company Market Positioning

2. Technavio Analysis

2.1 Analysis of price sensitivity, lifecycle, customer purchase basket, adoption rates, and purchase criteria

2.2 Criticality of inputs and Factors of differentiation

Chart on Overview on criticality of inputs and factors of differentiation

2.3 Factors of disruption

Chart on Overview on factors of disruption

2.4 Impact of drivers and challenges

Chart on Impact of drivers and challenges in 2025 and 2030

3. Market Landscape

3.1 Market ecosystem

Chart on Parent Market
Data Table on - Parent Market

3.2 Market characteristics

Chart on Market characteristics analysis

3.3 Value chain analysis

Chart on Value chain analysis

4. Market Sizing

4.1 Market definition

Data Table on Offerings of companies included in the market definition

4.2 Market segment analysis

Market segments

4.3 Market size 2025

4.4 Market outlook: Forecast for 2025-2030

Chart on Global - Market size and forecast 2025-2030 ($ million)
Data Table on Global - Market size and forecast 2025-2030 ($ million)
Chart on Global Market: Year-over-year growth 2025-2030 (%)
Data Table on Global Market: Year-over-year growth 2025-2030 (%)

5. Historic Market Size

5.1 Global Reusable Icepacks Market 2020 - 2024

Historic Market Size - Data Table on Global Reusable Icepacks Market 2020 - 2024 ($ million)

5.2 Product segment analysis 2020 - 2024

Historic Market Size - Product Segment 2020 - 2024 ($ million)

5.3 Application segment analysis 2020 - 2024

Historic Market Size - Application Segment 2020 - 2024 ($ million)

5.4 Distribution Channel segment analysis 2020 - 2024

Historic Market Size - Distribution Channel Segment 2020 - 2024 ($ million)

5.5 Geography segment analysis 2020 - 2024

Historic Market Size - Geography Segment 2020 - 2024 ($ million)

5.6 Country segment analysis 2020 - 2024

Historic Market Size - Country Segment 2020 - 2024 ($ million)

6. Qualitative Analysis

6.1 Impact of AI on Global Reusable Icepacks Market

7. Five Forces Analysis

7.1 Five forces summary

Five forces analysis - Comparison between 2025 and 2030

7.2 Bargaining power of buyers

Bargaining power of buyers - Impact of key factors 2025 and 2030

7.3 Bargaining power of suppliers

Bargaining power of suppliers - Impact of key factors in 2025 and 2030

7.4 Threat of new entrants

Threat of new entrants - Impact of key factors in 2025 and 2030

7.5 Threat of substitutes

Threat of substitutes - Impact of key factors in 2025 and 2030

7.6 Threat of rivalry

Threat of rivalry - Impact of key factors in 2025 and 2030

7.7 Market condition

Chart on Market condition - Five forces 2025 and 2030

8. Market Segmentation by Product

8.1 Market segments

Chart on Product - Market share 2025-2030 (%)
Data Table on Product - Market share 2025-2030 (%)

8.2 Comparison by Product

Chart on Comparison by Product
Data Table on Comparison by Product

8.3 Ice or dry icepacks - Market size and forecast 2025-2030

Chart on Ice or dry icepacks - Market size and forecast 2025-2030 ($ million)
Data Table on Ice or dry icepacks - Market size and forecast 2025-2030 ($ million)
Chart on Ice or dry icepacks - Year-over-year growth 2025-2030 (%)
Data Table on Ice or dry icepacks - Year-over-year growth 2025-2030 (%)

8.4 Refrigerant gel-based icepacks - Market size and forecast 2025-2030

Chart on Refrigerant gel-based icepacks - Market size and forecast 2025-2030 ($ million)
Data Table on Refrigerant gel-based icepacks - Market size and forecast 2025-2030 ($ million)
Chart on Refrigerant gel-based icepacks - Year-over-year growth 2025-2030 (%)
Data Table on Refrigerant gel-based icepacks - Year-over-year growth 2025-2030 (%)

8.5 Chemical based icepacks - Market size and forecast 2025-2030

Chart on Chemical based icepacks - Market size and forecast 2025-2030 ($ million)
Data Table on Chemical based icepacks - Market size and forecast 2025-2030 ($ million)
Chart on Chemical based icepacks - Year-over-year growth 2025-2030 (%)
Data Table on Chemical based icepacks - Year-over-year growth 2025-2030 (%)

8.6 Market opportunity by Product

Market opportunity by Product ($ million)
Data Table on Market opportunity by Product ($ million)

9. Market Segmentation by Application

9.1 Market segments

Chart on Application - Market share 2025-2030 (%)
Data Table on Application - Market share 2025-2030 (%)

9.2 Comparison by Application

Chart on Comparison by Application
Data Table on Comparison by Application

9.3 Food and beverage - Market size and forecast 2025-2030

Chart on Food and beverage - Market size and forecast 2025-2030 ($ million)
Data Table on Food and beverage - Market size and forecast 2025-2030 ($ million)
Chart on Food and beverage - Year-over-year growth 2025-2030 (%)
Data Table on Food and beverage - Year-over-year growth 2025-2030 (%)

9.4 Medical and healthcare - Market size and forecast 2025-2030

Chart on Medical and healthcare - Market size and forecast 2025-2030 ($ million)
Data Table on Medical and healthcare - Market size and forecast 2025-2030 ($ million)
Chart on Medical and healthcare - Year-over-year growth 2025-2030 (%)
Data Table on Medical and healthcare - Year-over-year growth 2025-2030 (%)

9.5 Chemicals - Market size and forecast 2025-2030

Chart on Chemicals - Market size and forecast 2025-2030 ($ million)
Data Table on Chemicals - Market size and forecast 2025-2030 ($ million)
Chart on Chemicals - Year-over-year growth 2025-2030 (%)
Data Table on Chemicals - Year-over-year growth 2025-2030 (%)

9.6 Market opportunity by Application

Market opportunity by Application ($ million)
Data Table on Market opportunity by Application ($ million)

10. Market Segmentation by Distribution Channel

10.1 Market segments

Chart on Distribution Channel - Market share 2025-2030 (%)
Data Table on Distribution Channel - Market share 2025-2030 (%)

10.2 Comparison by Distribution Channel

Chart on Comparison by Distribution Channel
Data Table on Comparison by Distribution Channel

10.3 Online retail - Market size and forecast 2025-2030

Chart on Online retail - Market size and forecast 2025-2030 ($ million)
Data Table on Online retail - Market size and forecast 2025-2030 ($ million)
Chart on Online retail - Year-over-year growth 2025-2030 (%)
Data Table on Online retail - Year-over-year growth 2025-2030 (%)

10.4 Offline retail - Market size and forecast 2025-2030

Chart on Offline retail - Market size and forecast 2025-2030 ($ million)
Data Table on Offline retail - Market size and forecast 2025-2030 ($ million)
Chart on Offline retail - Year-over-year growth 2025-2030 (%)
Data Table on Offline retail - Year-over-year growth 2025-2030 (%)

10.5 Institutional sales - Market size and forecast 2025-2030

Chart on Institutional sales - Market size and forecast 2025-2030 ($ million)
Data Table on Institutional sales - Market size and forecast 2025-2030 ($ million)
Chart on Institutional sales - Year-over-year growth 2025-2030 (%)
Data Table on Institutional sales - Year-over-year growth 2025-2030 (%)

10.6 Market opportunity by Distribution Channel

Market opportunity by Distribution Channel ($ million)
Data Table on Market opportunity by Distribution Channel ($ million)

11. Customer Landscape

11.1 Customer landscape overview

Analysis of price sensitivity, lifecycle, customer purchase basket, adoption rates, and purchase criteria

12. Geographic Landscape

12.1 Geographic segmentation

Chart on Market share by geography 2025-2030 (%)
Data Table on Market share by geography 2025-2030 (%)

12.2 Geographic comparison

Chart on Geographic comparison
Data Table on Geographic comparison

12.3 North America - Market size and forecast 2025-2030

Chart on North America - Market size and forecast 2025-2030 ($ million)
Data Table on North America - Market size and forecast 2025-2030 ($ million)
Chart on North America - Year-over-year growth 2025-2030 (%)
Data Table on North America - Year-over-year growth 2025-2030 (%)
Chart on Regional Comparison - North America
Data Table on Regional Comparison - North America

12.3.1 US - Market size and forecast 2025-2030

Chart on US - Market size and forecast 2025-2030 ($ million)
Data Table on US - Market size and forecast 2025-2030 ($ million)
Chart on US - Year-over-year growth 2025-2030 (%)
Data Table on US - Year-over-year growth 2025-2030 (%)

12.3.2 Canada - Market size and forecast 2025-2030

Chart on Canada - Market size and forecast 2025-2030 ($ million)
Data Table on Canada - Market size and forecast 2025-2030 ($ million)
Chart on Canada - Year-over-year growth 2025-2030 (%)
Data Table on Canada - Year-over-year growth 2025-2030 (%)

12.3.3 Mexico - Market size and forecast 2025-2030

Chart on Mexico - Market size and forecast 2025-2030 ($ million)
Data Table on Mexico - Market size and forecast 2025-2030 ($ million)
Chart on Mexico - Year-over-year growth 2025-2030 (%)
Data Table on Mexico - Year-over-year growth 2025-2030 (%)

12.4 APAC - Market size and forecast 2025-2030

Chart on APAC - Market size and forecast 2025-2030 ($ million)
Data Table on APAC - Market size and forecast 2025-2030 ($ million)
Chart on APAC - Year-over-year growth 2025-2030 (%)
Data Table on APAC - Year-over-year growth 2025-2030 (%)
Chart on Regional Comparison - APAC
Data Table on Regional Comparison - APAC

12.4.1 China - Market size and forecast 2025-2030

Chart on China - Market size and forecast 2025-2030 ($ million)
Data Table on China - Market size and forecast 2025-2030 ($ million)
Chart on China - Year-over-year growth 2025-2030 (%)
Data Table on China - Year-over-year growth 2025-2030 (%)

12.4.2 Japan - Market size and forecast 2025-2030

Chart on Japan - Market size and forecast 2025-2030 ($ million)
Data Table on Japan - Market size and forecast 2025-2030 ($ million)
Chart on Japan - Year-over-year growth 2025-2030 (%)
Data Table on Japan - Year-over-year growth 2025-2030 (%)

12.4.3 India - Market size and forecast 2025-2030

Chart on India - Market size and forecast 2025-2030 ($ million)
Data Table on India - Market size and forecast 2025-2030 ($ million)
Chart on India - Year-over-year growth 2025-2030 (%)
Data Table on India - Year-over-year growth 2025-2030 (%)

12.4.4 South Korea - Market size and forecast 2025-2030

Chart on South Korea - Market size and forecast 2025-2030 ($ million)
Data Table on South Korea - Market size and forecast 2025-2030 ($ million)
Chart on South Korea - Year-over-year growth 2025-2030 (%)
Data Table on South Korea - Year-over-year growth 2025-2030 (%)

12.4.5 Australia - Market size and forecast 2025-2030

Chart on Australia - Market size and forecast 2025-2030 ($ million)
Data Table on Australia - Market size and forecast 2025-2030 ($ million)
Chart on Australia - Year-over-year growth 2025-2030 (%)
Data Table on Australia - Year-over-year growth 2025-2030 (%)

12.4.6 Indonesia - Market size and forecast 2025-2030

Chart on Indonesia - Market size and forecast 2025-2030 ($ million)
Data Table on Indonesia - Market size and forecast 2025-2030 ($ million)
Chart on Indonesia - Year-over-year growth 2025-2030 (%)
Data Table on Indonesia - Year-over-year growth 2025-2030 (%)

12.5 Europe - Market size and forecast 2025-2030

Chart on Europe - Market size and forecast 2025-2030 ($ million)
Data Table on Europe - Market size and forecast 2025-2030 ($ million)
Chart on Europe - Year-over-year growth 2025-2030 (%)
Data Table on Europe - Year-over-year growth 2025-2030 (%)
Chart on Regional Comparison - Europe
Data Table on Regional Comparison - Europe

12.5.1 Germany - Market size and forecast 2025-2030

Chart on Germany - Market size and forecast 2025-2030 ($ million)
Data Table on Germany - Market size and forecast 2025-2030 ($ million)
Chart on Germany - Year-over-year growth 2025-2030 (%)
Data Table on Germany - Year-over-year growth 2025-2030 (%)

12.5.2 UK - Market size and forecast 2025-2030

Chart on UK - Market size and forecast 2025-2030 ($ million)
Data Table on UK - Market size and forecast 2025-2030 ($ million)
Chart on UK - Year-over-year growth 2025-2030 (%)
Data Table on UK - Year-over-year growth 2025-2030 (%)

12.5.3 France - Market size and forecast 2025-2030

Chart on France - Market size and forecast 2025-2030 ($ million)
Data Table on France - Market size and forecast 2025-2030 ($ million)
Chart on France - Year-over-year growth 2025-2030 (%)
Data Table on France - Year-over-year growth 2025-2030 (%)

12.5.4 Italy - Market size and forecast 2025-2030

Chart on Italy - Market size and forecast 2025-2030 ($ million)
Data Table on Italy - Market size and forecast 2025-2030 ($ million)
Chart on Italy - Year-over-year growth 2025-2030 (%)
Data Table on Italy - Year-over-year growth 2025-2030 (%)

12.5.5 Spain - Market size and forecast 2025-2030

Chart on Spain - Market size and forecast 2025-2030 ($ million)
Data Table on Spain - Market size and forecast 2025-2030 ($ million)
Chart on Spain - Year-over-year growth 2025-2030 (%)
Data Table on Spain - Year-over-year growth 2025-2030 (%)

12.5.6 The Netherlands - Market size and forecast 2025-2030

Chart on The Netherlands - Market size and forecast 2025-2030 ($ million)
Data Table on The Netherlands - Market size and forecast 2025-2030 ($ million)
Chart on The Netherlands - Year-over-year growth 2025-2030 (%)
Data Table on The Netherlands - Year-over-year growth 2025-2030 (%)

12.6 South America - Market size and forecast 2025-2030

Chart on South America - Market size and forecast 2025-2030 ($ million)
Data Table on South America - Market size and forecast 2025-2030 ($ million)
Chart on South America - Year-over-year growth 2025-2030 (%)
Data Table on South America - Year-over-year growth 2025-2030 (%)
Chart on Regional Comparison - South America
Data Table on Regional Comparison - South America

12.6.1 Brazil - Market size and forecast 2025-2030

Chart on Brazil - Market size and forecast 2025-2030 ($ million)
Data Table on Brazil - Market size and forecast 2025-2030 ($ million)
Chart on Brazil - Year-over-year growth 2025-2030 (%)
Data Table on Brazil - Year-over-year growth 2025-2030 (%)

12.6.2 Argentina - Market size and forecast 2025-2030

Chart on Argentina - Market size and forecast 2025-2030 ($ million)
Data Table on Argentina - Market size and forecast 2025-2030 ($ million)
Chart on Argentina - Year-over-year growth 2025-2030 (%)
Data Table on Argentina - Year-over-year growth 2025-2030 (%)

12.6.3 Chile - Market size and forecast 2025-2030

Chart on Chile - Market size and forecast 2025-2030 ($ million)
Data Table on Chile - Market size and forecast 2025-2030 ($ million)
Chart on Chile - Year-over-year growth 2025-2030 (%)
Data Table on Chile - Year-over-year growth 2025-2030 (%)

12.7 Middle East and Africa - Market size and forecast 2025-2030

Chart on Middle East and Africa - Market size and forecast 2025-2030 ($ million)
Data Table on Middle East and Africa - Market size and forecast 2025-2030 ($ million)
Chart on Middle East and Africa - Year-over-year growth 2025-2030 (%)
Data Table on Middle East and Africa - Year-over-year growth 2025-2030 (%)
Chart on Regional Comparison - Middle East and Africa
Data Table on Regional Comparison - Middle East and Africa

12.7.1 Saudi Arabia - Market size and forecast 2025-2030

Chart on Saudi Arabia - Market size and forecast 2025-2030 ($ million)
Data Table on Saudi Arabia - Market size and forecast 2025-2030 ($ million)
Chart on Saudi Arabia - Year-over-year growth 2025-2030 (%)
Data Table on Saudi Arabia - Year-over-year growth 2025-2030 (%)

12.7.2 UAE - Market size and forecast 2025-2030

Chart on UAE - Market size and forecast 2025-2030 ($ million)
Data Table on UAE - Market size and forecast 2025-2030 ($ million)
Chart on UAE - Year-over-year growth 2025-2030 (%)
Data Table on UAE - Year-over-year growth 2025-2030 (%)

12.7.3 South Africa - Market size and forecast 2025-2030

Chart on South Africa - Market size and forecast 2025-2030 ($ million)
Data Table on South Africa - Market size and forecast 2025-2030 ($ million)
Chart on South Africa - Year-over-year growth 2025-2030 (%)
Data Table on South Africa - Year-over-year growth 2025-2030 (%)

12.7.4 Israel - Market size and forecast 2025-2030

Chart on Israel - Market size and forecast 2025-2030 ($ million)
Data Table on Israel - Market size and forecast 2025-2030 ($ million)
Chart on Israel - Year-over-year growth 2025-2030 (%)
Data Table on Israel - Year-over-year growth 2025-2030 (%)

12.7.5 Turkey - Market size and forecast 2025-2030

Chart on Turkey - Market size and forecast 2025-2030 ($ million)
Data Table on Turkey - Market size and forecast 2025-2030 ($ million)
Chart on Turkey - Year-over-year growth 2025-2030 (%)
Data Table on Turkey - Year-over-year growth 2025-2030 (%)

12.8 Market opportunity by geography

Market opportunity by geography ($ million)
Data Tables on Market opportunity by geography ($ million)

13. Drivers, Challenges, and Opportunity

13.1 Market drivers

Expansion of pharmaceutical cold chain
Expansion of e-commerce and fresh food logistics
Sustainability initiatives and environmental regulations

13.2 Market challenges

Logistical and operational complexity of reverse logistics
Rising initial capital investment and cost sensitivity
Regulatory compliance and material safety standards

13.3 Impact of drivers and challenges

Impact of drivers and challenges in 2025 and 2030

13.4 Market opportunities

Integration of advanced phase change materials for enhanced thermal performance
Proliferation of smart tracking and internet of things technologies
Evolution toward circular logistics and bio-based material adoption

14. Competitive Landscape

14.1 Overview

14.2

Overview on criticality of inputs and factors of differentiation

14.3 Landscape disruption

Overview on factors of disruption

14.4 Industry risks

Impact of key risks on business

15. Competitive Analysis

15.1 Companies profiled

Companies covered

15.2 Company ranking index

15.3 Market positioning of companies

Matrix on companies position and classification

15.4 3M Co.

3M Co. - Overview
3M Co. - Business segments
3M Co. - Key news
3M Co. - Key offerings
3M Co. - Segment focus
SWOT

15.5 Accurate Manufacturing Inc.

Accurate Manufacturing Inc. - Overview
Accurate Manufacturing Inc. - Product / Service
Accurate Manufacturing Inc. - Key offerings
SWOT

15.6 Ace Hardware Corp.

Ace Hardware Corp. - Overview
Ace Hardware Corp. - Product / Service
Ace Hardware Corp. - Key offerings
SWOT

15.7 Arctic Ice LLC

Arctic Ice LLC - Overview
Arctic Ice LLC - Product / Service
Arctic Ice LLC - Key offerings
SWOT

15.8 Bent Grass Concepts

Bent Grass Concepts - Overview
Bent Grass Concepts - Product / Service
Bent Grass Concepts - Key offerings
SWOT

15.9 Cardinal Health Inc.

Cardinal Health Inc. - Overview
Cardinal Health Inc. - Business segments
Cardinal Health Inc. - Key news
Cardinal Health Inc. - Key offerings
Cardinal Health Inc. - Segment focus
SWOT

15.10 Cold Chain Technologies LLC

Cold Chain Technologies LLC - Overview
Cold Chain Technologies LLC - Product / Service
Cold Chain Technologies LLC - Key offerings
SWOT

15.11 Cryopak

Cryopak - Overview
Cryopak - Product / Service
Cryopak - Key offerings
SWOT

15.12 IceCold Gel Packs

IceCold Gel Packs - Overview
IceCold Gel Packs - Product / Service
IceCold Gel Packs - Key offerings
SWOT

15.13 King Brand Healthcare Products

King Brand Healthcare Products - Overview
King Brand Healthcare Products - Product / Service
King Brand Healthcare Products - Key offerings
SWOT

15.14 MVS In Motion

MVS In Motion - Overview
MVS In Motion - Product / Service
MVS In Motion - Key offerings
SWOT

15.15 Navagen Products Pvt. Ltd.

Navagen Products Pvt. Ltd. - Overview
Navagen Products Pvt. Ltd. - Product / Service
Navagen Products Pvt. Ltd. - Key offerings
SWOT

15.16 Nordic Cold Chain Solutions

Nordic Cold Chain Solutions - Overview
Nordic Cold Chain Solutions - Product / Service
Nordic Cold Chain Solutions - Key offerings
SWOT

15.17 TECHNI ICE

TECHNI ICE - Overview
TECHNI ICE - Product / Service
TECHNI ICE - Key offerings
SWOT

15.18 ThermoSafe Technologies Inc.

ThermoSafe Technologies Inc. - Overview
ThermoSafe Technologies Inc. - Product / Service
ThermoSafe Technologies Inc. - Key offerings
SWOT

16. Appendix

16.1 Scope of the report

Market definition
Objectives
Notes and caveats

16.2 Inclusions and exclusions checklist

Inclusions checklist
Exclusions checklist

16.3 Currency conversion rates for US$

16.4 Research methodology

16.5 Data procurement

Information sources

16.6 Data validation

16.7 Validation techniques employed for market sizing

16.8 Data synthesis

16.9 360 degree market analysis

16.10 List of abbreviations

Research Methodology

Technavio presents a detailed picture of the market by way of study, synthesis, and summation of data from multiple sources. The analysts have presented the various facets of the market with a particular focus on identifying the key industry influencers. The data thus presented is comprehensive, reliable, and the result of extensive research, both primary and secondary.

INFORMATION SOURCES

Primary sources

  • Manufacturers and suppliers
  • Channel partners
  • Industry experts
  • Strategic decision makers

Secondary sources

  • Industry journals and periodicals
  • Government data
  • Financial reports of key industry players
  • Historical data
  • Press releases

DATA ANALYSIS

Data Synthesis

  • Collation of data
  • Estimation of key figures
  • Analysis of derived insights

Data Validation

  • Triangulation with data models
  • Reference against proprietary databases
  • Corroboration with industry experts

REPORT WRITING

Qualitative

  • Market drivers
  • Market challenges
  • Market trends
  • Five forces analysis

Quantitative

  • Market size and forecast
  • Market segmentation
  • Geographical insights
  • Competitive landscape

Interested in this report?

Get your sample now to see our research methodology and insights!

Download Now

Frequently Asked Questions

Reusable Icepacks market growth will increase by USD 397.4 million during 2026-2030.

The Reusable Icepacks market is expected to grow at a CAGR of 5.6% during 2026-2030.

Reusable Icepacks market is segmented by Product (Ice or dry icepacks, Refrigerant gel-based icepacks, Chemical based icepacks) Application (Food and beverage, Medical and healthcare, Chemicals) Distribution channel (Online retail, Offline retail, Institutional sales)

3M Co., Accurate Manufacturing Inc., Ace Hardware Corp., Arctic Ice LLC, Bent Grass Concepts, Cardinal Health Inc., Cold Chain Technologies LLC, Cryopak, Dometic Group AB, GVS International, IceCold Gel Packs, Insulated Products Corp., King Brand Healthcare Products, Medline Inc., MVS In Motion, Navagen Products Pvt. Ltd., Nordic Cold Chain Solutions, Pitreavie Group, TECHNI ICE, ThermoSafe Technologies Inc. are a few of the key vendors in the Reusable Icepacks market.

APAC will register the highest growth rate of 42.5% among the other regions. Therefore, the Reusable Icepacks market in APAC is expected to garner significant business opportunities for the vendors during the forecast period.

US, Canada, Mexico, China, Japan, India, South Korea, Australia, Indonesia, Germany, UK, France, Italy, Spain, The Netherlands, Brazil, Argentina, Chile, Saudi Arabia, UAE, South Africa, Israel, Turkey

  • Expansion of pharmaceutical cold chain is the driving factor this market.

The Reusable Icepacks market vendors should focus on grabbing business opportunities from the Product segment as it accounted for the largest market share in the base year.