Europe FMCG Logistics Market Size 2025-2029
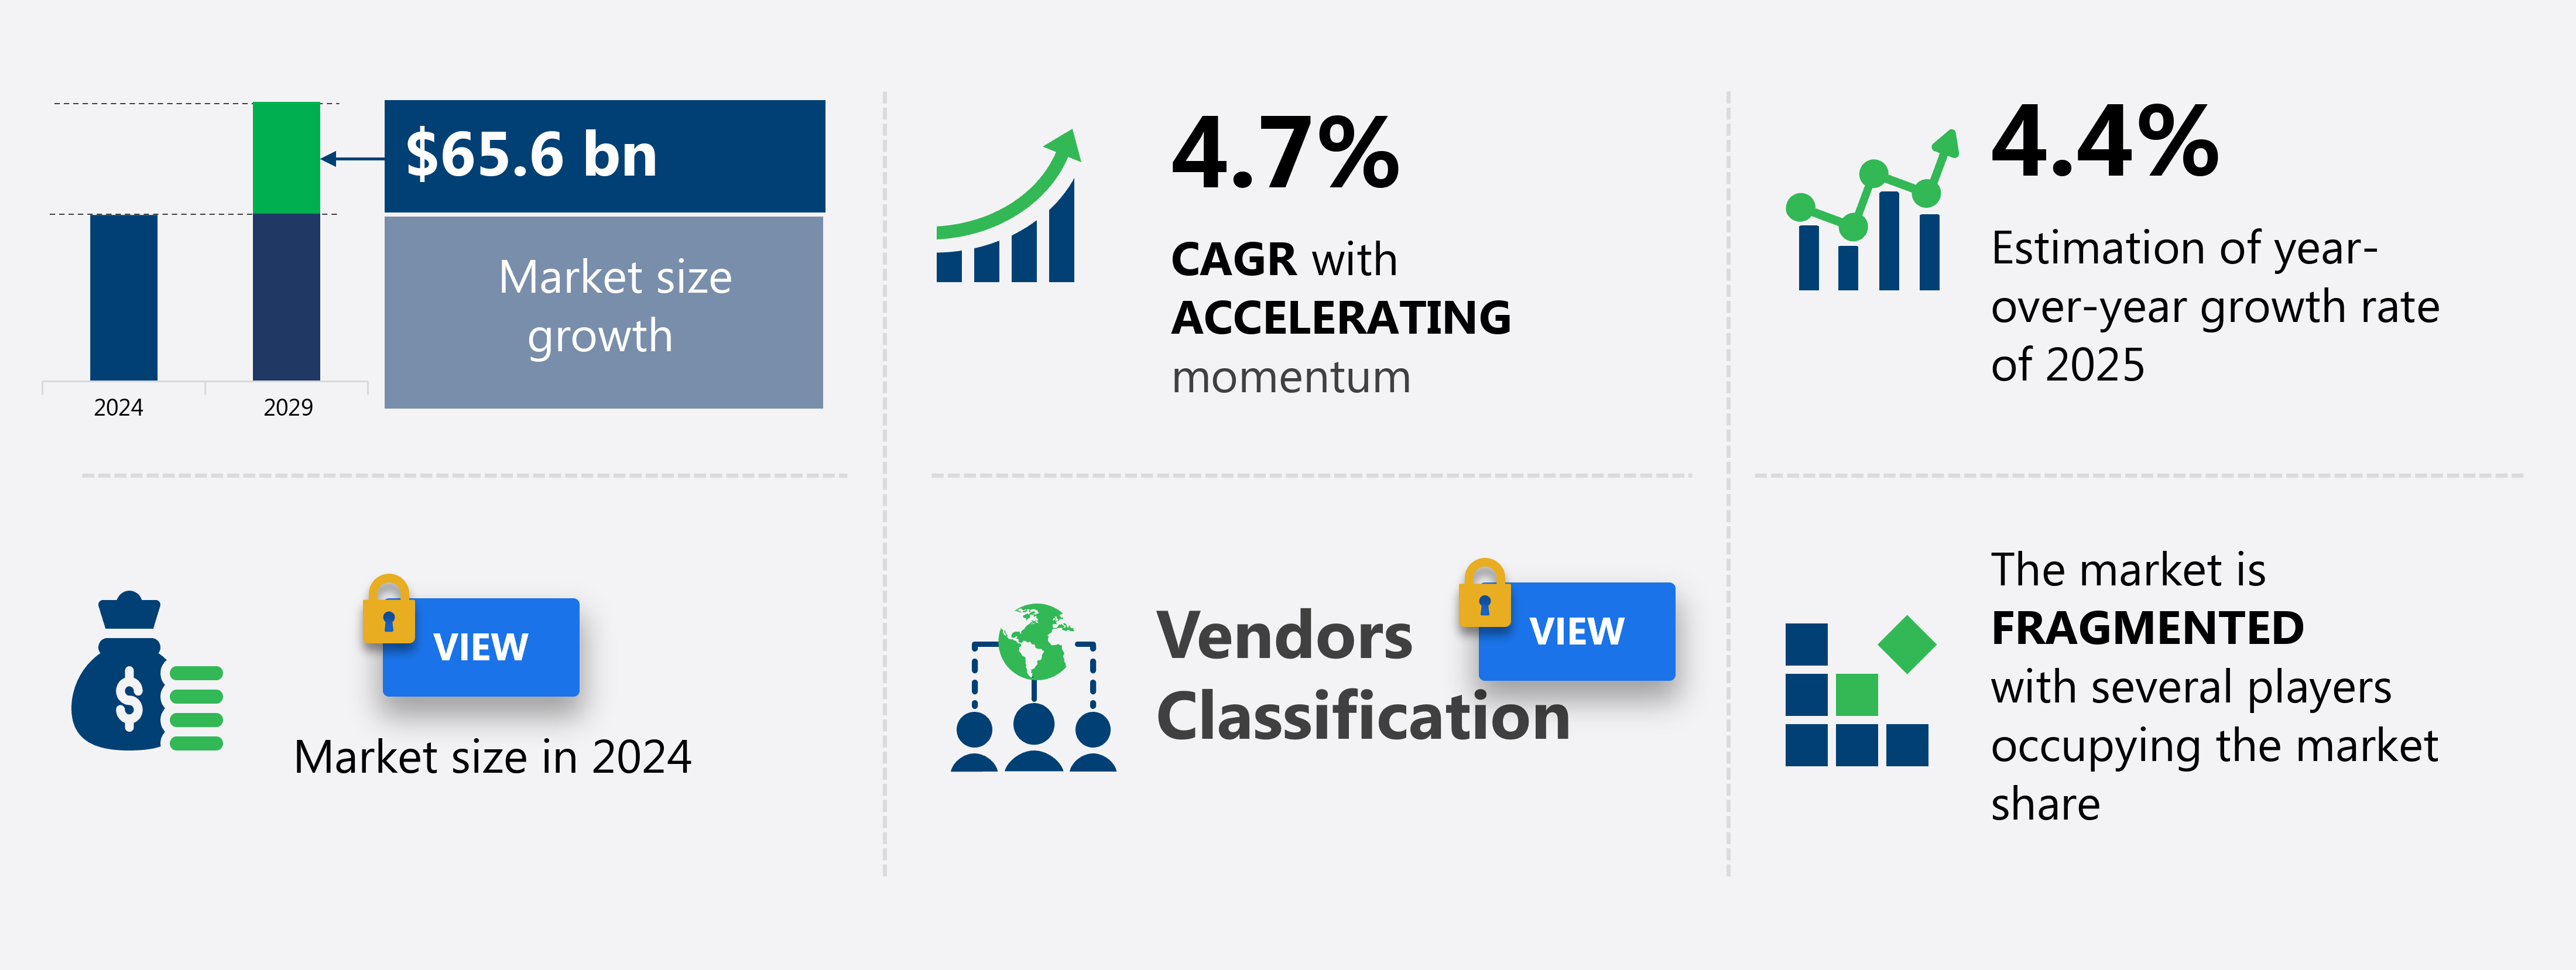
The Europe FMCG logistics market size is forecast to increase by USD 65.6 billion at a CAGR of 4.7% between 2024 and 2029.
- The Fast-Moving Consumer Goods (FMCG) logistics market is experiencing significant shifts, driven by the increasing adoption of technology in the logistics industry. This trend is transforming the way FMCG companies manage their supply chains, enabling real-time tracking, improved efficiency, and enhanced customer service. Moreover, the logistics industry is witnessing a rise in mergers and acquisitions, creating larger entities with expanded reach and resources. However, this market is not without challenges. The lack of skilled drivers poses a significant obstacle, as the industry grapples with an aging workforce and a shortage of new entrants. Cold chain logistics, e-commerce fulfillment, and order fulfillment processes require advanced logistics software for effective automation.
- In summary, the FMCG logistics market is characterized by technological innovation, consolidation, and a pressing need for skilled labor, offering both opportunities and challenges for market participants. Companies that effectively navigate these dynamics will be well-positioned to capitalize on the market's potential and maintain a competitive edge. Companies must invest in training programs and attractive compensation packages to attract and retain skilled drivers, ensuring a steady workforce to meet the growing demand for efficient and reliable logistics services. Warehouse management systems and third-party logistics play a crucial role in ensuring efficient inventory management and timely delivery.
What will be the size of the Europe FMCG Logistics Market during the forecast period?
Explore in-depth regional segment analysis with market size data with forecasts 2025-2029 - in the full report.
Request Free Sample
- The market for Fast-Moving Consumer Goods (FMCG) logistics continues to evolve, driven by the need for efficient distribution strategies, inventory control, and delivery optimization. Companies are leveraging logistic networks to improve warehouse efficiency, implement logistics automation, and optimize delivery routes. For instance, a leading FMCG company reduced transportation costs by 15% through optimal transport planning and carrier management. Inventory levels are a critical concern, with demand planning and supply chain analytics essential for maintaining quality control and meeting customer satisfaction. The industry anticipates a 5% annual growth rate, with a focus on supply chain resilience and efficient delivery.
- Returns processing and food safety standards are also paramount, with on-time delivery a key performance indicator. Warehouse layout and order tracking are essential for effective inventory management, while shipment tracking and packaging design contribute to customer satisfaction. Supply chain risk and supply chain analytics are increasingly important, with companies investing in network design and supply chain analytics to mitigate risks and optimize operations.
How is this Europe FMCG Logistics Market segmented?
The Europe FMCG logistics market research report provides comprehensive data (region-wise segment analysis), with forecasts and estimates in "USD billion" for the period 2025-2029, for the following segments.
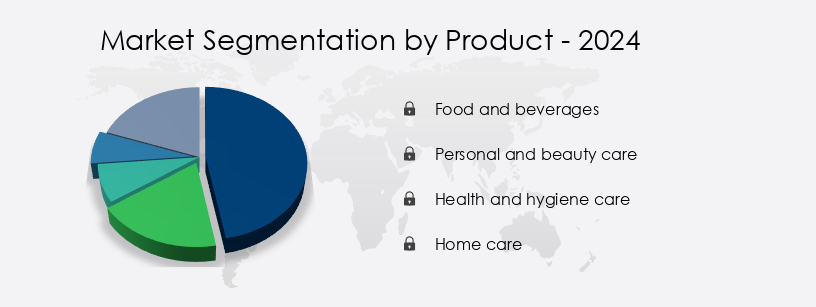
- Product
- Food and beverages
- Personal and beauty care
- Health and hygiene care
- Home care
- Service
- Transportation
- Warehousing
- VAS
- Mode Of Transportation
- Roadways
- Railways
- Airways
- Waterways
- Geography
- Europe
- France
- Germany
- Italy
- UK
- Europe
By Product Insights
The Food and beverages segment is estimated to witness significant growth during the forecast period. The Food and Beverages industry's growth is driven by shifting consumer preferences, improved living standards, and the increasing adoption of organic and packaged food and drinks. Consumers prioritize eco-friendly, chemical-free, and healthier options, leading to the rise of organic food and beverages. Additionally, the popularity of fresh, frozen, exotic, and flavored foods caters to evolving tastes. Route optimization software and fleet management help minimize transportation costs, while predictive maintenance and temperature monitoring maintain product quality. Supply chain visibility, carrier selection, and delivery scheduling streamline operations, enabling real-time tracking and product traceability.
Warehouse automation, transportation management systems, and packaging optimization reduce freight costs and improve load optimization. Inventory management, risk management logistics, and reverse logistics ensure minimal wastage and maximum shelf life. Data analytics logistics and logistics software enable demand forecasting and distribution network design, preparing businesses for future growth. For instance, a leading food and beverage company implemented a warehouse automation system, reducing order processing time by 50% and increasing order accuracy by 99%. The global logistics market for the food and beverage industry is projected to grow by over 7% annually, as businesses invest in advanced logistics solutions to cater to evolving consumer demands.
Market Dynamics
Our researchers analyzed the data with 2024 as the base year, along with the key drivers, trends, and challenges. A holistic analysis of drivers will help companies refine their marketing strategies to gain a competitive advantage. The FMCG (Fast-Moving Consumer Goods) logistics market is a critical sector that ensures the efficient and timely delivery of essential products to consumers around the world. To stay competitive in this dynamic market, companies are continually seeking ways to enhance their logistics operations. One key area of focus is efficient warehouse layout design, which optimizes space utilization and streamlines the picking and packing process. Integrating WMS (Warehouse Management Systems) and TMS (Transportation Management Systems) is another strategic move, enabling real-time tracking of inventory and optimizing last-mile delivery routes. Cold chain temperature control systems are essential for FMCG logistics, particularly for perishable goods.
Advanced technologies, such as predictive maintenance for logistics equipment and automated guided vehicles in warehousing, help ensure the reliability and efficiency of operations. Reducing freight costs is a constant challenge for FMCG companies. Route optimization and effective inventory management strategies are effective ways to minimize logistics expenses. Improving supply chain visibility through data and real-time tracking of perishable goods is also crucial for maintaining product quality and ensuring food safety throughout the supply chain. Managing product returns efficiently and developing sustainable packaging solutions are other important considerations for FMCG logistics. Enhancing supply chain resilience through diversification, improving order fulfillment accuracy and speed, and implementing robust risk management in logistics are also key priorities.
Advanced logistics software solutions play a vital role in addressing these challenges. By leveraging data analytics for improved logistics decisions, companies can optimize warehouse space utilization, ensure on-time delivery performance, and make informed choices about logistics routes and inventory levels. Overall, the FMCG logistics market is a complex and evolving landscape, requiring continuous innovation and adaptation to meet the changing needs of consumers and businesses alike.
What are the Europe FMCG Logistics Market drivers leading to the rise in adoption of the Industry?
- The logistics industry's growing embrace of technology serves as the primary catalyst for market expansion. The European FMCG logistics market is undergoing a significant transformation due to technological innovations. Logistics providers are integrating Internet of Things (IoT), robotics, analytics, and big data to optimize their operations. This shift has led to strategic collaborations, mergers, and acquisitions between logistics companies and IT firms.
- For instance, DHL Group's digital freight platform, Saloodo in the UK, links shippers and transportation providers through an online marketplace. According to reports, the European FMCG logistics market is projected to expand by over 5% annually, reflecting the industry's robust growth trajectory. The demand for customized solutions and swift deliveries in the FMCG sector necessitates the adoption of advanced technologies to minimize lead times and inventory levels.
What are the Europe FMCG Logistics Market trends shaping the Industry?
- The logistics industry is experiencing an upward trend in merger and acquisition activity. This is a mandatory development in the current market scenario. The market is witnessing significant growth due to the increasing demand from end-users. To cater to this demand, third-party logistics (3PL) companies are expanding their offerings and merging to achieve economies of scale. This strategic move is expected to boost the company's revenue growth in the forecast period.
- The European FMCG logistics market is projected to expand by over 10% in the next five years, driven by the increasing consumption of FMCG products and the growing preference for efficient and cost-effective logistics solutions. For instance, C.H. Robinson's acquisition of Combinex, a leading forwarder in the Benelux region, will enhance its logistics service connectivity and broaden its presence in Europe, particularly in Western Europe.
How does Europe FMCG Logistics Market face challenges during its growth?
- The logistics industry's growth is significantly hindered by the scarcity of competent drivers, representing a major challenge that necessitates urgent attention and solutions. The European logistics industry, particularly the Fast-Moving Consumer Goods (FMCG) sector, is experiencing a significant shortage of skilled drivers. This issue poses a considerable challenge as the FMCG supply chain relies heavily on efficient logistics operations and tight lead times. Factors contributing to the driver shortage include low wages, inadequate facilities, the increasing adoption of autonomous vehicles, and insufficient tanning provisions.
- According to recent reports, the European logistics market is projected to grow by over 5% annually, underlining the urgency for businesses to address this driver shortage and ensure uninterrupted supply chain operations. For instance, a leading FMCG company reported a 20% increase in sales due to timely and efficient deliveries following the implementation of innovative driver retention strategies. Germany and the UK are among the Western European countries grappling with severe driver shortages. As the market continues to expand, the demand for experienced drivers adept at handling the intricacies of this sector also increases.
Exclusive Europe FMCG Logistics Market Customer Landscape
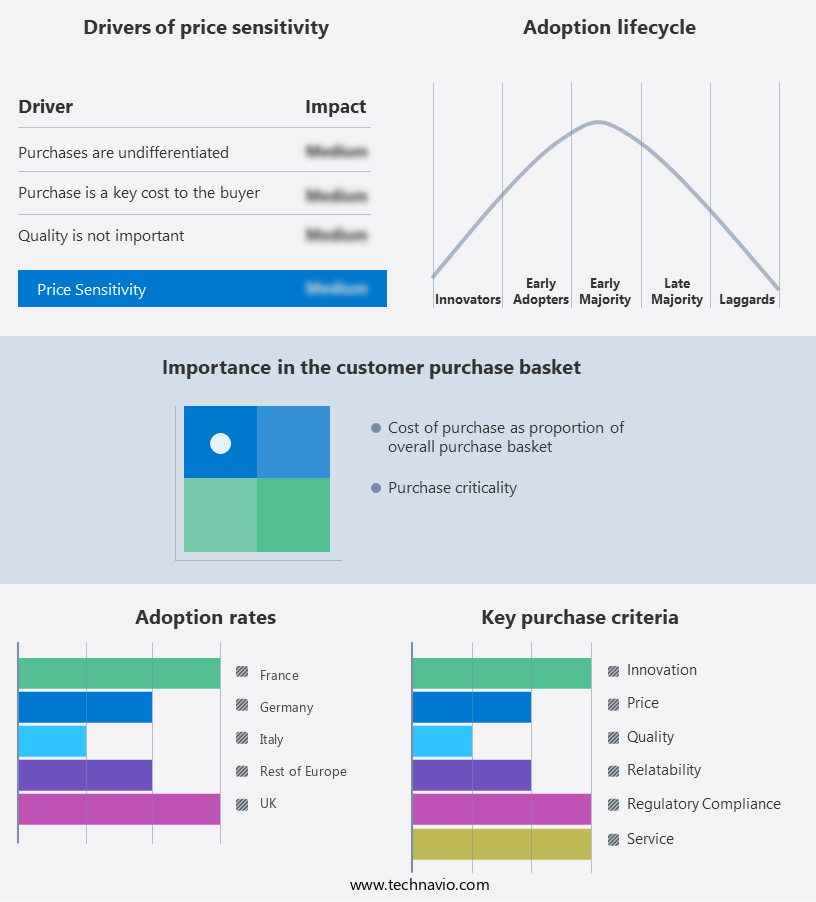
The Europe FMCG logistics market market forecasting report includes the adoption lifecycle of the market, covering from the innovator's stage to the laggard's stage. It focuses on adoption rates in different regions based on penetration. Furthermore, the report also includes key purchase criteria and drivers of price sensitivity to help companies evaluate and develop their market growth analysis strategies.
Customer Landscape
Key Companies & Market Insights
Companies are implementing various strategies, such as strategic alliances, market forecast partnerships, mergers and acquisitions, geographical expansion, and product/service launches, to enhance their presence in the market.
Agility Public Warehousing Co. K.S.C.P - The company specializes in logistics services for Fast-Moving Consumer Goods (FMCG), providing inventory management, order fulfillment, transportation, and warehousing solutions to optimize supply chain efficiency.
The Europe FMCG logistics market research and growth report includes detailed analyses of the competitive landscape of the market and information about key companies, including:
- Agility Public Warehousing Co. K.S.C.P
- AUGUSTIN QUEHENBERGER GROUP GMBH
- BDP International Inc.
- C H Robinson Worldwide Inc.
- CEVA Logistics SA
- DACHSER SE
- DB Schenker
- Deutsche Post AG
- DFDS AS
- DSV AS
- FedEx Corp.
- Freight Logistics Solutions
- Frode Laursen AS
- Hellmann Worldwide Logistics SE and Co KG
- Kerry Logistics Network Ltd.
- Kintetsu World Express Inc.
- Kuehne Nagel Management AG
- PF Whitehead Transport Services Ltd
- RGF Logistics Ltd.
- XPO Inc.
Qualitative and quantitative analysis of companies has been conducted to help clients understand the wider business environment as well as the strengths and weaknesses of key market players. Data is qualitatively analyzed to categorize companies as pure play, category-focused, industry-focused, and diversified; it is quantitatively analyzed to categorize companies as dominant, leading, strong, tentative, and weak.
Recent Development and News in FMCG Logistics Market In Europe
- In January 2024, DHL Supply Chain announced the launch of its new FMCG (Fast-Moving Consumer Goods) logistics solution, "GreenChoice," which offers carbon-neutral logistics services to FMCG companies, marking a significant stride towards sustainable supply chains in the industry (DHL Press Release).
- In March 2024, Nestle and DB Schenker entered into a strategic partnership to optimize Nestle's logistics network in Europe, aiming to enhance efficiency and reduce transportation costs (DB Schenker Press Release).
- In May 2025, Kuehne + Nagel completed the acquisition of a majority stake in Agrostar, a leading Indian agricultural and FMCG retailer, expanding its footprint in the Indian market and strengthening its end-to-end supply chain solutions for FMCG companies (Kuehne + Nagel Press Release).
- In the same month, Amazon announced the deployment of its new autonomous delivery drones for FMCG products in select US cities, revolutionizing last-mile delivery and setting new standards for speed and efficiency in the FMCG logistics sector (Amazon Press Release).
Research Analyst Overview
The FMCG logistics market continues to evolve, driven by the increasing complexity and diversity of supply chain requirements across various sectors. Warehouse management systems have become essential for optimizing inventory levels and streamlining operations, while third-party logistics providers offer flexible solutions for managing distribution networks. Route optimization software and fleet management systems enable efficient transportation of goods, reducing freight costs through load optimization and predictive maintenance. Supply chain visibility tools provide real-time insights into inventory levels, delivery scheduling, and carrier selection, ensuring timely and cost-effective last mile delivery. Automated warehousing and robotics in logistics are transforming warehouse operations, increasing productivity and reducing labor costs.
The industry expects a growth of over 10% in the next five years, driven by the demand for faster delivery times and the increasing importance of e-commerce fulfillment. For instance, a leading FMCG company implemented a warehouse automation system, resulting in a 20% increase in order fulfillment efficiency and a 15% reduction in warehouse labor costs. The implementation of a transportation management system and real-time tracking technology also led to a 12% reduction in freight costs through improved carrier selection and route optimization. The market's continuous dynamism is further reflected in the adoption of cold chain logistics for temperature-sensitive products, packaging optimization for reduced waste and improved sustainability, and reverse logistics for managing returns and waste.
Data analytics logistics and risk management logistics are also gaining importance in ensuring supply chain resilience and mitigating potential disruptions. Furthermore, the integration of demand forecasting, distribution network design, and freight forwarding solutions is enabling more effective supply chain optimization, ensuring optimal shelf life management and reducing overall supply chain costs.
Dive into Technavio's robust research methodology, blending expert interviews, extensive data synthesis, and validated models for unparalleled FMCG Logistics Market in Europe insights. See full methodology.
|
Market Scope |
|
|
Report Coverage |
Details |
|
Page number |
203 |
|
Base year |
2024 |
|
Forecast period |
2025-2029 |
|
Growth momentum & CAGR |
Accelerate at a CAGR of 4.7% |
|
Market growth 2025-2029 |
USD 65.6 billion |
|
Market structure |
Fragmented |
|
YoY growth 2024-2025(%) |
4.4 |
|
Competitive landscape |
Leading Companies, Market Positioning of Companies, Competitive Strategies, and Industry Risks |
What are the Key Data Covered in this Market Research Report?
- CAGR of the market during the forecast period
- Detailed information on factors that will drive the market growth and forecasting between 2025 and 2029
- Precise estimation of the size of the market and its contribution of the market in focus to the parent market
- Accurate predictions about upcoming market growth and trends and changes in consumer behaviour
- Growth of the market across Europe
- Thorough analysis of the market's competitive landscape and detailed information about companies
- Comprehensive analysis of factors that will challenge the growth of market companies
We can help! Our analysts can customize this market research report to meet your requirements Get in touch
 RIA -
RIA - 
