Logistics Services Software Market Size 2025-2029
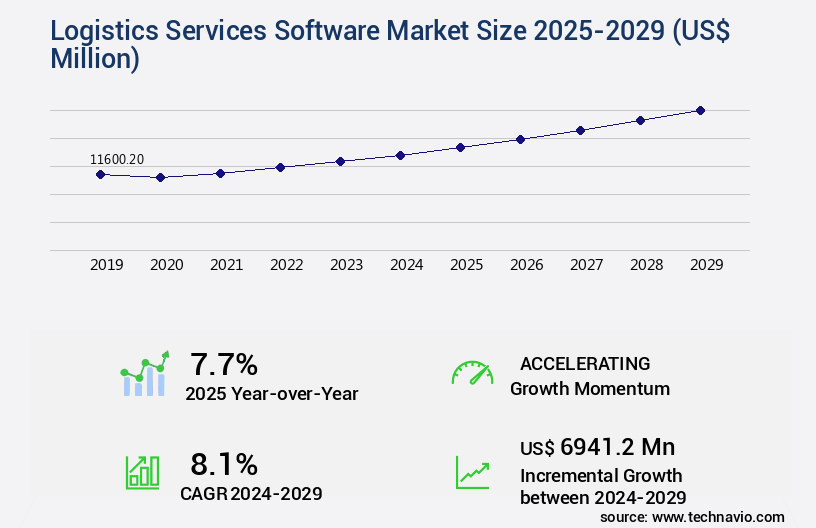
The logistics services software market size is valued to increase by USD 6.94 billion, at a CAGR of 8.1% from 2024 to 2029. Increasing adoption of 3PL and emergence of 5PL will drive the logistics services software market.
Major Market Trends & Insights
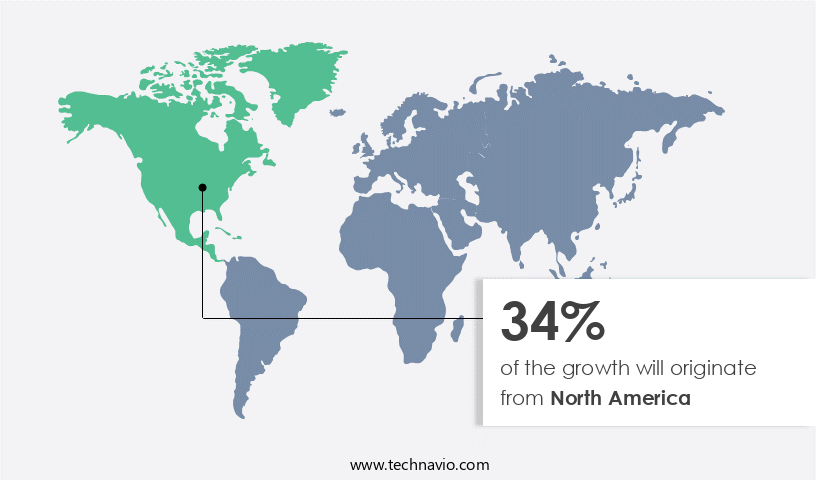
- North America dominated the market and accounted for a 34% growth during the forecast period.
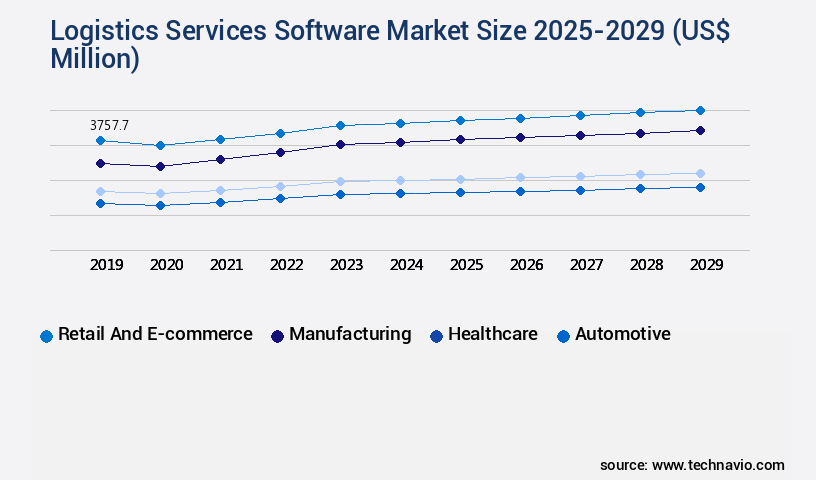
- By End-user - Retail and e-commerce segment was valued at USD 3.76 billion in 2023
- By Deployment - On-premises segment accounted for the largest market revenue share in 2023
Market Size & Forecast
- Market Opportunities: USD 85.38 million
- Market Future Opportunities: USD 6941.20 million
- CAGR from 2024 to 2029 : 8.1%
Market Summary
- The market has experienced significant growth in recent years, driven by the increasing demand for efficient and automated supply chain management solutions. According to a recent study, the global market for logistics services software is projected to reach a value of USD35.5 billion by 2025, underscoring its growing importance in the business world. This trend is fueled by several factors, including the rising adoption of third-party logistics (3PL) services and the emergence of fifth-party logistics (5PL) providers. The shift towards outsourcing logistics functions to specialized providers has enabled businesses to focus on their core competencies while optimizing their supply chain operations.
- Moreover, digital transformation is revolutionizing the logistics industry, with advanced technologies such as artificial intelligence, machine learning, and the Internet of Things (IoT) enabling real-time tracking, predictive analytics, and automated processes. This not only enhances operational efficiency but also improves customer service and reduces costs. However, the market is not without its challenges. The growing number of cargo thefts and cybersecurity threats poses a significant risk to the security and integrity of supply chains. As a result, logistics services software providers must prioritize security features and invest in advanced technologies to mitigate these risks. Despite these challenges, the future of the market looks bright, with continued innovation and growth expected in the years to come.
- By leveraging the latest technologies and best practices, businesses can optimize their supply chain operations, reduce costs, and improve customer satisfaction.
What will be the Size of the Logistics Services Software Market during the forecast period?

Get Key Insights on Market Forecast (PDF) Request Free Sample
How is the Logistics Services Software Market Segmented ?
The logistics services software industry research report provides comprehensive data (region-wise segment analysis), with forecasts and estimates in "USD million" for the period 2025-2029, as well as historical data from 2019-2023 for the following segments.
- End-user
- Retail and e-commerce
- Manufacturing
- Healthcare
- Automotive
- Others
- Deployment
- Type
- Transportation management
- Warehouse management
- Asset and fleet management
- Data management
- Others
- Geography
- North America
- Europe
- Middle East and Africa
- APAC
- South America
- Rest of World (ROW)
By End-user Insights
The retail and e-commerce segment is estimated to witness significant growth during the forecast period.
In the ever-evolving landscape of global business, the market plays a pivotal role, particularly in the retail and e-commerce sector. This software facilitates the seamless management of customer orders, enabling businesses to meet consumer demands efficiently. Key functionalities include order processing, inventory management, warehouse integration, and real-time shipment tracking. Retailers and e-commerce businesses grapple with large inventories and the need for optimal stock levels. Logistics services software addresses this challenge with capabilities like demand forecasting, stock tracking, and automated replenishment. Additionally, advanced features such as automated warehouse systems, yard management systems, and delivery scheduling software enhance operational efficiency.
The market also caters to the growing need for supply chain visibility through supply chain analytics and freight tracking software. With the increasing popularity of e-commerce, the market continues to evolve, integrating solutions for international shipping, customs brokerage, freight brokerage, route optimization algorithms, and last-mile delivery. A recent study revealed that the market is projected to grow at a compound annual growth rate of 12.5% between 2021 and 2026.

Request Free Sample
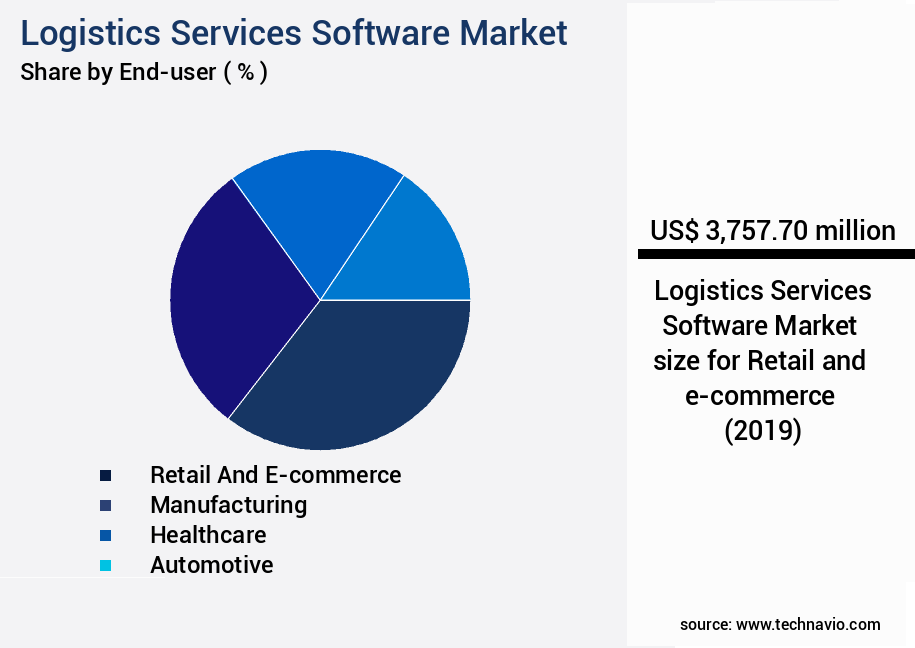
The Retail and e-commerce segment was valued at USD 3.76 billion in 2019 and showed a gradual increase during the forecast period.

Request Free Sample
Regional Analysis
North America is estimated to contribute 34% to the growth of the global market during the forecast period.Technavio's analysts have elaborately explained the regional trends and drivers that shape the market during the forecast period.

See How Logistics Services Software Market Demand is Rising in North America Request Free Sample
The market is experiencing significant growth, driven by the expanding adoption of Transportation Management Systems (TMS) and Warehouse Management Systems (WMS) by logistics and warehouse companies. These systems optimize operations, enhance efficiency, and improve supply chain visibility. North America dominates the market, with a substantial share attributed to the presence of numerous e-commerce enterprises and substantial investments in the logistics sector. Key players in the region include ABCO Transportation, Air Cargo Inc., American Letter Mail Co., United Parcel Service, US Logistics Inc., and UShip Inc.
(US Logistics and UShip are also prominent warehouse companies, alongside Caruso Logistics Inc. And Champion Logistics Group Inc.). This market's growth underscores the increasing importance of technology in logistics and the evolving needs of modern businesses.
Market Dynamics
Our researchers analyzed the data with 2024 as the base year, along with the key drivers, trends, and challenges. A holistic analysis of drivers will help companies refine their marketing strategies to gain a competitive advantage.
The market is experiencing significant growth as businesses seek to streamline their supply chain operations and enhance their competitive edge. One key trend in this market is the integration of logistics software with existing ERP systems, enabling seamless data flow and improved operational efficiency. Real-time tracking and tracing capabilities are also in high demand, allowing businesses to monitor their shipments in transit and optimize delivery routes using machine learning models. Another important aspect of logistics services software is automated freight bill auditing, which helps companies reduce errors and save time and money by automatically comparing invoices with contracted rates and identifying discrepancies. Predictive maintenance for transport fleets is another valuable feature, allowing businesses to proactively address potential issues and minimize downtime.
AI-driven route optimization for last-mile delivery is another area of innovation, using real-time data to optimize routes and reduce delivery times. Warehouse management system integration with e-commerce platforms is also crucial for businesses looking to streamline their order fulfillment processes and provide accurate inventory information to customers. Dynamic pricing algorithms for freight transportation are becoming increasingly common, allowing businesses to optimize their shipping costs based on real-time market conditions. Supply chain visibility through blockchain implementation is another trend, providing end-to-end transparency and traceability for all parties involved in the supply chain. Real-time inventory management and forecasting, efficient capacity planning and resource allocation, and advanced analytics for supply chain performance monitoring are all essential features for businesses looking to optimize their logistics operations. Mobile apps are also playing an important role in improving last-mile delivery efficiency and providing real-time updates to customers. Overall, the market is evolving rapidly, with a focus on integrating advanced technologies to enhance operational efficiency, reduce costs, and improve customer satisfaction.

What are the key market drivers leading to the rise in the adoption of Logistics Services Software Industry?
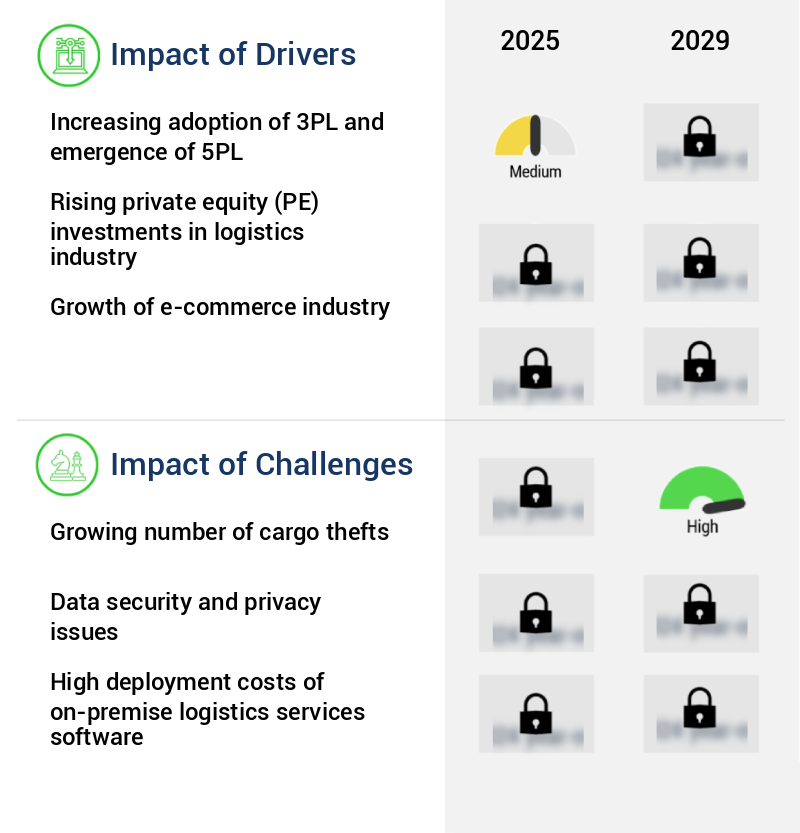
- The increasing adoption of third-party logistics (3PL) services and the emergence of fifth-party logistics (5PL), which involves a higher level of supply chain management and integration, are primary growth drivers in the market.
- Third-party logistics (3PL) is a business model where companies outsource their logistics functions to specialized providers. These 3PL providers offer services such as warehousing, transportation, freight forwarding, and value-added services (VAS) like inventory management, cross-docking, and packaging. The global 3PL market is dynamic, with providers continuously innovating to improve operational efficiency. For instance, they employ advanced technologies like automation, real-time tracking, and predictive analytics to streamline operations. Moreover, 3PL providers cater to diverse industries, adapting to their unique requirements.
- In retail, they manage inventory levels and ensure timely delivery of goods. In healthcare, they handle temperature-controlled transportation and storage. In technology, they facilitate just-in-time delivery and reverse logistics. These providers offer strategic value, optimizing logistics networks, reducing costs, and enhancing customer experience. The 3PL market's evolution underscores its significance in the global supply chain landscape.
What are the market trends shaping the Logistics Services Software Industry?
- Digital transformation is the mandated trend in logistics markets. Digital transformation signifies the integration of digital technology into logistics operations to enhance efficiency, productivity, and customer experience.
- The logistics industry undergoes persistent digital transformation globally, as original equipment manufacturers and technology suppliers adapt business strategies. Competitive pressure propels logistics companies to adopt technology-driven services, such as telematics and electronic proof of delivery (ePOD). Telematics in trucks deliver real-time data on vehicle condition, loading capacity, traffic, and cargo status. This technology offers advantages, including reduced standby times, driver monitoring, optimized routing, fewer accidents, and increased capacity utilization. The integration of telematics in logistics operations enhances efficiency and cost reduction, making it a crucial trend in the industry.
- EPOD, another technology-enabled service, streamlines the delivery process by providing electronic records of deliveries, reducing paperwork, and improving delivery accuracy. These technological advancements reflect the continuous evolution of the logistics sector, shaping its future applications across various industries.
What challenges does the Logistics Services Software Industry face during its growth?
- The escalating issue of cargo theft poses a significant challenge to the expansion and growth of the industry.
- Cargo theft poses a significant challenge to businesses and consumers worldwide, leading to compromised product availability and integrity. The globalization trend has driven companies to expand their market reach, increasing the risk of cargo theft at various stages from manufacturing to delivery. The economic crisis has fueled the demand for black-market goods, consequently increasing the number of cargo theft incidents. In the US, the Federal Bureau of Investigation reports that an estimated USD15 to USD30 billion worth of cargo is stolen annually.
- This issue underscores the need for robust security measures and continuous efforts to mitigate cargo theft risks. The evolving nature of this concern necessitates ongoing vigilance and adaptation to emerging trends and patterns.
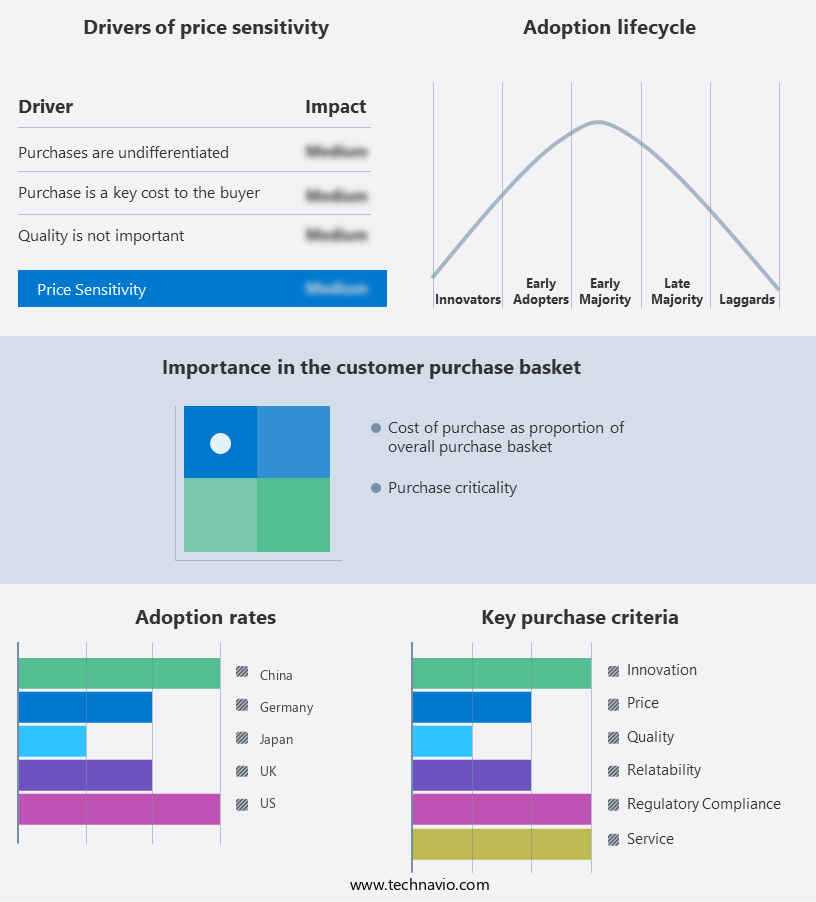
Exclusive Technavio Analysis on Customer Landscape
The logistics services software market forecasting report includes the adoption lifecycle of the market, covering from the innovator's stage to the laggard's stage. It focuses on adoption rates in different regions based on penetration. Furthermore, the logistics services software market report also includes key purchase criteria and drivers of price sensitivity to help companies evaluate and develop their market growth analysis strategies.

Customer Landscape of Logistics Services Software Industry
Competitive Landscape
Companies are implementing various strategies, such as strategic alliances, logistics services software market forecast, partnerships, mergers and acquisitions, geographical expansion, and product/service launches, to enhance their presence in the industry.
Accenture PLC - This company specializes in logistic service software solutions, including Accenture Freight and Logistics Software. These technology platforms cater to the needs of airlines and ocean transportation industries, streamlining operations and enhancing efficiency.
The industry research and growth report includes detailed analyses of the competitive landscape of the market and information about key companies, including:
- Accenture PLC
- Descartes Systems Group Inc.
- E2open Parent Holdings Inc.
- Epicor Software Corp.
- Fishbowl
- Honeywell International Inc.
- International Business Machines Corp.
- Koch Industries Inc.
- Koerber AG
- Magaya Corp.
- Manhattan Associates Inc.
- Oracle Corp.
- Panasonic Holdings Corp.
- Ramco Systems Ltd.
- Royal 4 Systems
- SAP SE
- Siemens AG
- SPEC India
- Trimble Inc.
- WiseTech Global Ltd.
Qualitative and quantitative analysis of companies has been conducted to help clients understand the wider business environment as well as the strengths and weaknesses of key industry players. Data is qualitatively analyzed to categorize companies as pure play, category-focused, industry-focused, and diversified; it is quantitatively analyzed to categorize companies as dominant, leading, strong, tentative, and weak.
Recent Development and News in Logistics Services Software Market
- In January 2024, DHL Supply Chain, a leading global logistics provider, announced the launch of its new Digital Logistics Platform, integrating advanced logistics services software to optimize supply chain visibility and efficiency for clients (DHL press release).
- In March 2024, UPS and Oracle collaborated to offer Oracle Transportation Management Cloud customers real-time access to UPS's global logistics network, enhancing their supply chain operations (UPS press release).
- In April 2024, Flexport, a logistics technology company, raised USD935 million in a Series E funding round, bringing its valuation to USD8 billion and fueling its expansion into new markets and services (TechCrunch).
- In May 2025, the European Union's Executive European Commission approved the merger of DB Schenker and MercuryGate, creating a larger logistics services software provider with enhanced capabilities to cater to European businesses (European Commission press release).
Dive into Technavio's robust research methodology, blending expert interviews, extensive data synthesis, and validated models for unparalleled Logistics Services Software Market insights. See full methodology.
|
Market Scope
|
|
Report Coverage
|
Details
|
|
Page number
|
239
|
|
Base year
|
2024
|
|
Historic period
|
2019-2023 |
|
Forecast period
|
2025-2029
|
|
Growth momentum & CAGR
|
Accelerate at a CAGR of 8.1%
|
|
Market growth 2025-2029
|
USD 6941.2 million
|
|
Market structure
|
Fragmented
|
|
YoY growth 2024-2025(%)
|
7.7
|
|
Key countries
|
US, Canada, Germany, UK, Italy, France, China, India, Japan, Brazil, Egypt, UAE, Oman, Argentina, KSA, UAE, Brazil, and Rest of World (ROW)
|
|
Competitive landscape
|
Leading Companies, Market Positioning of Companies, Competitive Strategies, and Industry Risks
|
Request Free Sample
Research Analyst Overview
- The market continues to evolve, driven by the growing complexity of supply chains and the increasing demand for real-time visibility and automation. E-commerce logistics, in particular, has fueled the growth of this market, as businesses strive to meet customer expectations for fast and reliable delivery. Order management systems, automated warehouse systems, and yard management systems are essential components of modern logistics operations. Real-time location tracking, logistics execution systems, and delivery scheduling software enable supply chain visibility, ensuring that all stakeholders are informed in real-time. Demand forecasting models and third-party logistics (3PL) help businesses optimize their inventory levels and reduce carrying costs.
- Supply chain analytics, fleet management software, and network optimization tools provide valuable insights into logistics operations, enabling continuous improvement. Reverse logistics processes, international shipping software, and customs brokerage software are crucial for managing returns and cross-border shipments. Shipment tracking technology, freight brokerage software, and route optimization algorithms help businesses optimize their transportation networks and reduce shipping costs. Predictive maintenance algorithms and last-mile delivery solutions are the latest trends in logistics software, ensuring that assets are maintained efficiently and that deliveries are made on time. Warehouse management systems, carrier management platforms, shipping label generation, and carrier selection algorithms are also essential tools for effective logistics operations.
- According to industry reports, the market is expected to grow by over 10% annually in the coming years, as businesses continue to seek ways to optimize their supply chains and improve customer satisfaction. For instance, a leading retailer reported a 20% increase in on-time deliveries after implementing a comprehensive logistics software solution.
What are the Key Data Covered in this Logistics Services Software Market Research and Growth Report?
-
What is the expected growth of the Logistics Services Software Market between 2025 and 2029?
-
What segmentation does the market report cover?
-
The report is segmented by End-user (Retail and e-commerce, Manufacturing, Healthcare, Automotive, and Others), Deployment (On-premises and Cloud-based), Type (Transportation management, Warehouse management, Asset and fleet management, Data management, and Others), and Geography (North America, Europe, APAC, Middle East and Africa, and South America)
-
Which regions are analyzed in the report?
-
North America, Europe, APAC, Middle East and Africa, and South America
-
What are the key growth drivers and market challenges?
-
Who are the major players in the Logistics Services Software Market?
-
Accenture PLC, Descartes Systems Group Inc., E2open Parent Holdings Inc., Epicor Software Corp., Fishbowl, Honeywell International Inc., International Business Machines Corp., Koch Industries Inc., Koerber AG, Magaya Corp., Manhattan Associates Inc., Oracle Corp., Panasonic Holdings Corp., Ramco Systems Ltd., Royal 4 Systems, SAP SE, Siemens AG, SPEC India, Trimble Inc., and WiseTech Global Ltd.
Market Research Insights
- The market continues to evolve, integrating advanced technologies to enhance efficiency and effectiveness. Two notable trends include the adoption of AI-powered solutions for dynamic routing and last-mile delivery optimization. For instance, the implementation of AI algorithms can lead to a 10% reduction in delivery time. Furthermore, industry experts anticipate a 15% compound annual growth rate in cloud-based logistics software solutions over the next five years. These technologies enable real-time visibility, data integration, and predictive analytics, fostering capacity planning, risk management strategies, and cost optimization.
- Additionally, they offer automated workflows, API integrations, and reporting and analytics capabilities, ensuring seamless supply chain optimization. Geospatial analytics and simulation software play a crucial role in optimizing routes and improving delivery performance. Ultimately, these innovations contribute to the ongoing transformation of the market.
We can help! Our analysts can customize this logistics services software market research report to meet your requirements.
Get in touch
1 Executive Summary
- 1.1 Market overview
- Executive Summary - Chart on Market Overview
- Executive Summary - Data Table on Market Overview
- Executive Summary - Chart on Global Market Characteristics
- Executive Summary - Chart on Market by Geography
- Executive Summary - Chart on Market Segmentation by End-user
- Executive Summary - Chart on Market Segmentation by Deployment
- Executive Summary - Chart on Market Segmentation by Type
- Executive Summary - Chart on Incremental Growth
- Executive Summary - Data Table on Incremental Growth
- Executive Summary - Chart on Company Market Positioning
2 Technavio Analysis
- 2.1 Analysis of price sensitivity, lifecycle, customer purchase basket, adoption rates, and purchase criteria
- Analysis of price sensitivity, lifecycle, customer purchase basket, adoption rates, and purchase criteria
- 2.2 Criticality of inputs and Factors of differentiation
- Overview on criticality of inputs and factors of differentiation
- 2.3 Factors of disruption
- Overview on factors of disruption
- 2.4 Impact of drivers and challenges
- Impact of drivers and challenges in 2024 and 2029
3 Market Landscape
- 3.1 Market ecosystem
- Parent Market
- Data Table on - Parent Market
- 3.2 Market characteristics
- Market characteristics analysis
4 Market Sizing
- 4.1 Market definition
- Offerings of companies included in the market definition
- 4.2 Market segment analysis
- 4.4 Market outlook: Forecast for 2024-2029
- Chart on Global - Market size and forecast 2024-2029 ($ million)
- Data Table on Global - Market size and forecast 2024-2029 ($ million)
- Chart on Global Market: Year-over-year growth 2024-2029 (%)
- Data Table on Global Market: Year-over-year growth 2024-2029 (%)
5 Historic Market Size
- 5.1 Global Logistics Services Software Market 2019 - 2023
- Historic Market Size - Data Table on Global Logistics Services Software Market 2019 - 2023 ($ million)
- 5.2 End-user segment analysis 2019 - 2023
- Historic Market Size - End-user Segment 2019 - 2023 ($ million)
- 5.3 Deployment segment analysis 2019 - 2023
- Historic Market Size - Deployment Segment 2019 - 2023 ($ million)
- 5.4 Type segment analysis 2019 - 2023
- Historic Market Size - Type Segment 2019 - 2023 ($ million)
- 5.5 Geography segment analysis 2019 - 2023
- Historic Market Size - Geography Segment 2019 - 2023 ($ million)
- 5.6 Country segment analysis 2019 - 2023
- Historic Market Size - Country Segment 2019 - 2023 ($ million)
6 Qualitative Analysis
- 6.1 Impact of AI on Global Logistics Services Software Market
7 Five Forces Analysis
- 7.1 Five forces summary
- Five forces analysis - Comparison between 2024 and 2029
- 7.2 Bargaining power of buyers
- Bargaining power of buyers - Impact of key factors 2024 and 2029
- 7.3 Bargaining power of suppliers
- Bargaining power of suppliers - Impact of key factors in 2024 and 2029
- 7.4 Threat of new entrants
- Threat of new entrants - Impact of key factors in 2024 and 2029
- 7.5 Threat of substitutes
- Threat of substitutes - Impact of key factors in 2024 and 2029
- 7.6 Threat of rivalry
- Threat of rivalry - Impact of key factors in 2024 and 2029
- 7.7 Market condition
- Chart on Market condition - Five forces 2024 and 2029
8 Market Segmentation by End-user
- 8.1 Market segments
- Chart on End-user - Market share (2024-2029) (%)
- Data Table on End-user - Market share (2024-2029) (%)
- 8.2 Comparison by End-user
- Chart on Comparison by End-user
- Data Table on Comparison by End-user
- 8.3 Retail and e-commerce - Market size and forecast (2024-2029)
- Chart on Retail and e-commerce - Market size and forecast (2024-2029) ($ million)
- Data Table on Retail and e-commerce - Market size and forecast (2024-2029) ($ million)
- Chart on Retail and e-commerce - Year-over-year growth (2024-2029) (%)
- Data Table on Retail and e-commerce - Year-over-year growth (2024-2029) (%)
- 8.4 Manufacturing - Market size and forecast (2024-2029)
- Chart on Manufacturing - Market size and forecast (2024-2029) ($ million)
- Data Table on Manufacturing - Market size and forecast (2024-2029) ($ million)
- Chart on Manufacturing - Year-over-year growth (2024-2029) (%)
- Data Table on Manufacturing - Year-over-year growth (2024-2029) (%)
- 8.5 Healthcare - Market size and forecast (2024-2029)
- Chart on Healthcare - Market size and forecast (2024-2029) ($ million)
- Data Table on Healthcare - Market size and forecast (2024-2029) ($ million)
- Chart on Healthcare - Year-over-year growth (2024-2029) (%)
- Data Table on Healthcare - Year-over-year growth (2024-2029) (%)
- 8.6 Automotive - Market size and forecast (2024-2029)
- Chart on Automotive - Market size and forecast (2024-2029) ($ million)
- Data Table on Automotive - Market size and forecast (2024-2029) ($ million)
- Chart on Automotive - Year-over-year growth (2024-2029) (%)
- Data Table on Automotive - Year-over-year growth (2024-2029) (%)
- 8.7 Others - Market size and forecast (2024-2029)
- Chart on Others - Market size and forecast (2024-2029) ($ million)
- Data Table on Others - Market size and forecast (2024-2029) ($ million)
- Chart on Others - Year-over-year growth (2024-2029) (%)
- Data Table on Others - Year-over-year growth (2024-2029) (%)
- 8.8 Market opportunity by End-user
- Market opportunity by End-user ($ million)
- Data Table on Market opportunity by End-user ($ million)
9 Market Segmentation by Deployment
- 9.1 Market segments
- Chart on Deployment - Market share (2024-2029) (%)
- Data Table on Deployment - Market share (2024-2029) (%)
- 9.2 Comparison by Deployment
- Chart on Comparison by Deployment
- Data Table on Comparison by Deployment
- 9.3 On-premises - Market size and forecast (2024-2029)
- Chart on On-premises - Market size and forecast (2024-2029) ($ million)
- Data Table on On-premises - Market size and forecast (2024-2029) ($ million)
- Chart on On-premises - Year-over-year growth (2024-2029) (%)
- Data Table on On-premises - Year-over-year growth (2024-2029) (%)
- 9.4 Cloud-based - Market size and forecast (2024-2029)
- Chart on Cloud-based - Market size and forecast (2024-2029) ($ million)
- Data Table on Cloud-based - Market size and forecast (2024-2029) ($ million)
- Chart on Cloud-based - Year-over-year growth (2024-2029) (%)
- Data Table on Cloud-based - Year-over-year growth (2024-2029) (%)
- 9.5 Market opportunity by Deployment
- Market opportunity by Deployment ($ million)
- Data Table on Market opportunity by Deployment ($ million)
10 Market Segmentation by Type
- 10.1 Market segments
- Chart on Type - Market share (2024-2029) (%)
- Data Table on Type - Market share (2024-2029) (%)
- 10.2 Comparison by Type
- Chart on Comparison by Type
- Data Table on Comparison by Type
- 10.3 Transportation management - Market size and forecast (2024-2029)
- Chart on Transportation management - Market size and forecast (2024-2029) ($ million)
- Data Table on Transportation management - Market size and forecast (2024-2029) ($ million)
- Chart on Transportation management - Year-over-year growth (2024-2029) (%)
- Data Table on Transportation management - Year-over-year growth (2024-2029) (%)
- 10.4 Warehouse management - Market size and forecast (2024-2029)
- Chart on Warehouse management - Market size and forecast (2024-2029) ($ million)
- Data Table on Warehouse management - Market size and forecast (2024-2029) ($ million)
- Chart on Warehouse management - Year-over-year growth (2024-2029) (%)
- Data Table on Warehouse management - Year-over-year growth (2024-2029) (%)
- 10.5 Asset and fleet management - Market size and forecast (2024-2029)
- Chart on Asset and fleet management - Market size and forecast (2024-2029) ($ million)
- Data Table on Asset and fleet management - Market size and forecast (2024-2029) ($ million)
- Chart on Asset and fleet management - Year-over-year growth (2024-2029) (%)
- Data Table on Asset and fleet management - Year-over-year growth (2024-2029) (%)
- 10.6 Data management - Market size and forecast (2024-2029)
- Chart on Data management - Market size and forecast (2024-2029) ($ million)
- Data Table on Data management - Market size and forecast (2024-2029) ($ million)
- Chart on Data management - Year-over-year growth (2024-2029) (%)
- Data Table on Data management - Year-over-year growth (2024-2029) (%)
- 10.7 Others - Market size and forecast (2024-2029)
- Chart on Others - Market size and forecast (2024-2029) ($ million)
- Data Table on Others - Market size and forecast (2024-2029) ($ million)
- Chart on Others - Year-over-year growth (2024-2029) (%)
- Data Table on Others - Year-over-year growth (2024-2029) (%)
- 10.8 Market opportunity by Type
- Market opportunity by Type ($ million)
- Data Table on Market opportunity by Type ($ million)
11 Customer Landscape
- 11.1 Customer landscape overview
- Analysis of price sensitivity, lifecycle, customer purchase basket, adoption rates, and purchase criteria
12 Geographic Landscape
- 12.1 Geographic segmentation
- Chart on Market share by geography 2024-2029 (%)
- Data Table on Market share by geography 2024-2029 (%)
- 12.2 Geographic comparison
- Chart on Geographic comparison
- Data Table on Geographic comparison
- 12.3 North America - Market size and forecast 2024-2029
- Chart on North America - Market size and forecast 2024-2029 ($ million)
- Data Table on North America - Market size and forecast 2024-2029 ($ million)
- Chart on North America - Year-over-year growth 2024-2029 (%)
- Data Table on North America - Year-over-year growth 2024-2029 (%)
- 12.4 Europe - Market size and forecast 2024-2029
- Chart on Europe - Market size and forecast 2024-2029 ($ million)
- Data Table on Europe - Market size and forecast 2024-2029 ($ million)
- Chart on Europe - Year-over-year growth 2024-2029 (%)
- Data Table on Europe - Year-over-year growth 2024-2029 (%)
- 12.5 APAC - Market size and forecast 2024-2029
- Chart on APAC - Market size and forecast 2024-2029 ($ million)
- Data Table on APAC - Market size and forecast 2024-2029 ($ million)
- Chart on APAC - Year-over-year growth 2024-2029 (%)
- Data Table on APAC - Year-over-year growth 2024-2029 (%)
- 12.6 Middle East and Africa - Market size and forecast 2024-2029
- Chart on Middle East and Africa - Market size and forecast 2024-2029 ($ million)
- Data Table on Middle East and Africa - Market size and forecast 2024-2029 ($ million)
- Chart on Middle East and Africa - Year-over-year growth 2024-2029 (%)
- Data Table on Middle East and Africa - Year-over-year growth 2024-2029 (%)
- 12.7 South America - Market size and forecast 2024-2029
- Chart on South America - Market size and forecast 2024-2029 ($ million)
- Data Table on South America - Market size and forecast 2024-2029 ($ million)
- Chart on South America - Year-over-year growth 2024-2029 (%)
- Data Table on South America - Year-over-year growth 2024-2029 (%)
- 12.8 US - Market size and forecast 2024-2029
- Chart on US - Market size and forecast 2024-2029 ($ million)
- Data Table on US - Market size and forecast 2024-2029 ($ million)
- Chart on US - Year-over-year growth 2024-2029 (%)
- Data Table on US - Year-over-year growth 2024-2029 (%)
- 12.9 China - Market size and forecast 2024-2029
- Chart on China - Market size and forecast 2024-2029 ($ million)
- Data Table on China - Market size and forecast 2024-2029 ($ million)
- Chart on China - Year-over-year growth 2024-2029 (%)
- Data Table on China - Year-over-year growth 2024-2029 (%)
- 12.10 Germany - Market size and forecast 2024-2029
- Chart on Germany - Market size and forecast 2024-2029 ($ million)
- Data Table on Germany - Market size and forecast 2024-2029 ($ million)
- Chart on Germany - Year-over-year growth 2024-2029 (%)
- Data Table on Germany - Year-over-year growth 2024-2029 (%)
- 12.11 Canada - Market size and forecast 2024-2029
- Chart on Canada - Market size and forecast 2024-2029 ($ million)
- Data Table on Canada - Market size and forecast 2024-2029 ($ million)
- Chart on Canada - Year-over-year growth 2024-2029 (%)
- Data Table on Canada - Year-over-year growth 2024-2029 (%)
- 12.12 UK - Market size and forecast 2024-2029
- Chart on UK - Market size and forecast 2024-2029 ($ million)
- Data Table on UK - Market size and forecast 2024-2029 ($ million)
- Chart on UK - Year-over-year growth 2024-2029 (%)
- Data Table on UK - Year-over-year growth 2024-2029 (%)
- 12.13 India - Market size and forecast 2024-2029
- Chart on India - Market size and forecast 2024-2029 ($ million)
- Data Table on India - Market size and forecast 2024-2029 ($ million)
- Chart on India - Year-over-year growth 2024-2029 (%)
- Data Table on India - Year-over-year growth 2024-2029 (%)
- 12.14 France - Market size and forecast 2024-2029
- Chart on France - Market size and forecast 2024-2029 ($ million)
- Data Table on France - Market size and forecast 2024-2029 ($ million)
- Chart on France - Year-over-year growth 2024-2029 (%)
- Data Table on France - Year-over-year growth 2024-2029 (%)
- 12.15 Japan - Market size and forecast 2024-2029
- Chart on Japan - Market size and forecast 2024-2029 ($ million)
- Data Table on Japan - Market size and forecast 2024-2029 ($ million)
- Chart on Japan - Year-over-year growth 2024-2029 (%)
- Data Table on Japan - Year-over-year growth 2024-2029 (%)
- 12.16 Italy - Market size and forecast 2024-2029
- Chart on Italy - Market size and forecast 2024-2029 ($ million)
- Data Table on Italy - Market size and forecast 2024-2029 ($ million)
- Chart on Italy - Year-over-year growth 2024-2029 (%)
- Data Table on Italy - Year-over-year growth 2024-2029 (%)
- 12.17 South Korea - Market size and forecast 2024-2029
- Chart on South Korea - Market size and forecast 2024-2029 ($ million)
- Data Table on South Korea - Market size and forecast 2024-2029 ($ million)
- Chart on South Korea - Year-over-year growth 2024-2029 (%)
- Data Table on South Korea - Year-over-year growth 2024-2029 (%)
- 12.18 Market opportunity by geography
- Market opportunity by geography ($ million)
- Data Tables on Market opportunity by geography ($ million)
- 12.19 Brazil - Market size and forecast (2024-2029)
- Chart on Brazil - Market size and forecast (2024-2029) ($ million)
- Data Table on Brazil - Market size and forecast (2024-2029) ($ million)
- Chart on Brazil - Year-over-year growth (2024-2029) (%)
- Data Table on Brazil - Year-over-year growth (2024-2029) (%)
- 12.20 Egypt - Market size and forecast (2024-2029)
- Chart on Egypt - Market size and forecast (2024-2029) ($ million)
- Data Table on Egypt - Market size and forecast (2024-2029) ($ million)
- Chart on Egypt - Year-over-year growth (2024-2029) (%)
- Data Table on Egypt - Year-over-year growth (2024-2029) (%)
- 12.21 UAE - Market size and forecast (2024-2029)
- Chart on UAE - Market size and forecast (2024-2029) ($ million)
- Data Table on UAE - Market size and forecast (2024-2029) ($ million)
- Chart on UAE - Year-over-year growth (2024-2029) (%)
- Data Table on UAE - Year-over-year growth (2024-2029) (%)
- 12.22 Oman - Market size and forecast (2024-2029)
- Chart on Oman - Market size and forecast (2024-2029) ($ million)
- Data Table on Oman - Market size and forecast (2024-2029) ($ million)
- Chart on Oman - Year-over-year growth (2024-2029) (%)
- Data Table on Oman - Year-over-year growth (2024-2029) (%)
- 12.23 Argentina - Market size and forecast (2024-2029)
- Chart on Argentina - Market size and forecast (2024-2029) ($ million)
- Data Table on Argentina - Market size and forecast (2024-2029) ($ million)
- Chart on Argentina - Year-over-year growth (2024-2029) (%)
- Data Table on Argentina - Year-over-year growth (2024-2029) (%)
- 12.24 KSA - Market size and forecast (2024-2029)
- Chart on KSA - Market size and forecast (2024-2029) ($ million)
- Data Table on KSA - Market size and forecast (2024-2029) ($ million)
- Chart on KSA - Year-over-year growth (2024-2029) (%)
- Data Table on KSA - Year-over-year growth (2024-2029) (%)
- 12.25 Rest of World (ROW) - Market size and forecast (2024-2029)
- Chart on Rest of World (ROW) - Market size and forecast (2024-2029) ($ million)
- Data Table on Rest of World (ROW) - Market size and forecast (2024-2029) ($ million)
- Chart on Rest of World (ROW) - Year-over-year growth (2024-2029) (%)
- Data Table on Rest of World (ROW) - Year-over-year growth (2024-2029) (%)
13 Drivers, Challenges, and Opportunity/Restraints
- 13.3 Impact of drivers and challenges
- Impact of drivers and challenges in 2024 and 2029
- 13.4 Market opportunities/restraints
14 Competitive Landscape
- 14.2 Competitive Landscape
- Overview on criticality of inputs and factors of differentiation
- 14.3 Landscape disruption
- Overview on factors of disruption
- 14.4 Industry risks
- Impact of key risks on business
15 Competitive Analysis
- 15.2 Market positioning of companies
- Matrix on companies position and classification
- 15.3 Accenture PLC
- Accenture PLC - Overview
- Accenture PLC - Product / Service
- Accenture PLC - Key offerings
- 15.4 Descartes Systems Group Inc.
- Descartes Systems Group Inc. - Overview
- Descartes Systems Group Inc. - Product / Service
- Descartes Systems Group Inc. - Key offerings
- 15.5 E2open Parent Holdings Inc.
- E2open Parent Holdings Inc. - Overview
- E2open Parent Holdings Inc. - Product / Service
- E2open Parent Holdings Inc. - Key offerings
- 15.6 Epicor Software Corp.
- Epicor Software Corp. - Overview
- Epicor Software Corp. - Product / Service
- Epicor Software Corp. - Key offerings
- 15.7 Fishbowl
- Fishbowl - Overview
- Fishbowl - Product / Service
- Fishbowl - Key offerings
- 15.8 Honeywell International Inc.
- Honeywell International Inc. - Overview
- Honeywell International Inc. - Product / Service
- Honeywell International Inc. - Key offerings
- 15.9 International Business Machines Corp.
- International Business Machines Corp. - Overview
- International Business Machines Corp. - Product / Service
- International Business Machines Corp. - Key offerings
- 15.10 Koch Industries Inc.
- Koch Industries Inc. - Overview
- Koch Industries Inc. - Product / Service
- Koch Industries Inc. - Key offerings
- 15.11 Koerber AG
- Koerber AG - Overview
- Koerber AG - Product / Service
- Koerber AG - Key offerings
- 15.12 Magaya Corp.
- Magaya Corp. - Overview
- Magaya Corp. - Product / Service
- Magaya Corp. - Key offerings
- 15.13 Manhattan Associates Inc.
- Manhattan Associates Inc. - Overview
- Manhattan Associates Inc. - Product / Service
- Manhattan Associates Inc. - Key offerings
- 15.14 Oracle Corp.
- Oracle Corp. - Overview
- Oracle Corp. - Product / Service
- Oracle Corp. - Key offerings
- 15.15 Panasonic Holdings Corp.
- Panasonic Holdings Corp. - Overview
- Panasonic Holdings Corp. - Product / Service
- Panasonic Holdings Corp. - Key offerings
- 15.16 Ramco Systems Ltd.
- Ramco Systems Ltd. - Overview
- Ramco Systems Ltd. - Product / Service
- Ramco Systems Ltd. - Key offerings
- 15.17 Royal 4 Systems
- Royal 4 Systems - Overview
- Royal 4 Systems - Product / Service
- Royal 4 Systems - Key offerings
- 15.18 SAP SE
- SAP SE - Overview
- SAP SE - Product / Service
- SAP SE - Key offerings
- 15.19 Siemens AG
- Siemens AG - Overview
- Siemens AG - Product / Service
- Siemens AG - Key offerings
- 15.20 SPEC INDIA
- SPEC INDIA - Overview
- SPEC INDIA - Product / Service
- SPEC INDIA - Key offerings
- 15.21 Trimble Inc.
- Trimble Inc. - Overview
- Trimble Inc. - Product / Service
- Trimble Inc. - Key offerings
- 15.22 WiseTech Global Ltd.
- WiseTech Global Ltd. - Overview
- WiseTech Global Ltd. - Product / Service
- WiseTech Global Ltd. - Key offerings
- 15.23 Descartes Systems Group Inc.
- Descartes Systems Group Inc. - Overview
- Descartes Systems Group Inc. - Product / Service
- Descartes Systems Group Inc. - Key offerings
- 15.24 E2open Parent Holdings Inc.
- E2open Parent Holdings Inc. - Overview
- E2open Parent Holdings Inc. - Product / Service
- E2open Parent Holdings Inc. - Key offerings
- 15.25 Epicor Software Corp.
- Epicor Software Corp. - Overview
- Epicor Software Corp. - Product / Service
- Epicor Software Corp. - Key offerings
- 15.26 Fishbowl
- Fishbowl - Overview
- Fishbowl - Product / Service
- Fishbowl - Key offerings
- 15.27 Honeywell International Inc.
- Honeywell International Inc. - Overview
- Honeywell International Inc. - Product / Service
- Honeywell International Inc. - Key offerings
- 15.28 International Business Machines Corp.
- International Business Machines Corp. - Overview
- International Business Machines Corp. - Product / Service
- International Business Machines Corp. - Key offerings
- 15.29 Koch Industries Inc.
- Koch Industries Inc. - Overview
- Koch Industries Inc. - Product / Service
- Koch Industries Inc. - Key offerings
- 15.30 Koerber AG
- Koerber AG - Overview
- Koerber AG - Product / Service
- Koerber AG - Key offerings
- 15.31 Magaya Corp.
- Magaya Corp. - Overview
- Magaya Corp. - Product / Service
- Magaya Corp. - Key offerings
- 15.32 Manhattan Associates Inc.
- Manhattan Associates Inc. - Overview
- Manhattan Associates Inc. - Product / Service
- Manhattan Associates Inc. - Key offerings
- 15.33 Oracle Corp.
- Oracle Corp. - Overview
- Oracle Corp. - Product / Service
- Oracle Corp. - Key offerings
- 15.34 Panasonic Holdings Corporation
- Panasonic Holdings Corporation - Overview
- Panasonic Holdings Corporation - Product / Service
- Panasonic Holdings Corporation - Key offerings
- 15.35 Ramco Systems Ltd.
- Ramco Systems Ltd. - Overview
- Ramco Systems Ltd. - Product / Service
- Ramco Systems Ltd. - Key offerings
- 15.36 Royal 4 Systems
- Royal 4 Systems - Overview
- Royal 4 Systems - Product / Service
- Royal 4 Systems - Key offerings
- 15.37 SAP SE
- SAP SE - Overview
- SAP SE - Product / Service
- SAP SE - Key offerings
- 15.38 Siemens AG
- Siemens AG - Overview
- Siemens AG - Product / Service
- Siemens AG - Key offerings
- 15.39 SPEC INDIA
- SPEC INDIA - Overview
- SPEC INDIA - Product / Service
- SPEC INDIA - Key offerings
- 15.40 Trimble Inc.
- Trimble Inc. - Overview
- Trimble Inc. - Product / Service
- Trimble Inc. - Key offerings
- 15.41 WiseTech Global Ltd.
- WiseTech Global Ltd. - Overview
- WiseTech Global Ltd. - Product / Service
- WiseTech Global Ltd. - Key offerings
- 15.42 Accenture Plc
- Accenture Plc - Overview
- Accenture Plc - Product / Service
- Accenture Plc - Key offerings
16 Appendix
- 16.2 Inclusions and exclusions checklist
- Inclusions checklist
- Exclusions checklist
- 16.3 Currency conversion rates for US$
- Currency conversion rates for US$
- 16.4 Research methodology
- 16.7 Validation techniques employed for market sizing
- Validation techniques employed for market sizing
- 16.9 360 degree market analysis
- 360 degree market analysis
- 16.10 List of abbreviations