
Dry Honey Market Size 2024-2028
The dry honey market size is forecast to increase by USD 257.6 million at a CAGR of 3.7% between 2023 and 2028.
- The market is experiencing significant growth due to its versatility as a nutritional supplement, preservative, and sweetener in various industries. In the cosmetics industry, dry honey is used in formulations for its restorative properties. Furthermore, the increasing prevalence of diabetes has led to a rise in demand for natural sweeteners as an alternative to refined sugars. The health benefits of consuming dry honey, including its rich macronutrient content, make it an attractive option for consumers. However, challenges such as the declining number of honeybee colonies and the need for preservatives to extend shelf life remain key concerns for market growth.
What will be the Size of the Dry Honey Market during the forecast period?

- The market is witnessing significant growth due to its versatility and numerous health benefits. Dry honey, also known as powdered or granulated honey, is obtained by dehydrating liquid honey. This process preserves the nutritional properties and unique taste of honey. Dry honey is gaining popularity as a natural sweetener in various industries, including food and beverage, pharmaceuticals, and cosmetics. Its usage as a sugar substitute in health-conscious products is a major driving factor for the market growth. The demand for natural and organic products is on the rise In the US, and dry honey caters to this trend as it is a natural and vegan-friendly sweetener.
- It is also a suitable option for individuals following a keto diet or those with diabetes, as it has a low glycemic index. Moreover, dry honey offers various health benefits. It is rich in antioxidants, which help fight free radicals and protect the body from oxidative stress. It also has anti-inflammatory and antibacterial properties, making it an effective remedy for various health issues, including coughs and burns. In the food and beverage industry, dry honey is used as a sweetener in baked goods, beverages, and confectionery products. Its usage In the pharmaceutical industry includes nutraceuticals and health supplements.
- In the cosmetics industry, dry honey is used in skincare and hair care products due to its moisturizing and anti-aging properties. The market is expected to grow at a steady pace due to its increasing usage in various industries and its numerous health benefits. Furthermore, the growing awareness of the health risks associated with refined sugars is driving the demand for natural sweeteners like dry honey. In summary, the market is witnessing significant growth due to its versatility, health benefits, and increasing demand for natural and organic products. Its usage as a sugar substitute in various industries, including food and beverage, pharmaceuticals, and cosmetics, is a major driving factor for the market growth.
- Dry honey offers numerous health benefits, including antioxidant properties, anti-inflammatory and antibacterial properties, and a low glycemic index, making it a popular choice for health-conscious consumers.
How is this Dry Honey Industry segmented?
The dry honey industry research report provides comprehensive data (region-wise segment analysis), with forecasts and estimates in "USD million" for the period 2024-2028, as well as historical data from 2018-2022 for the following segments.
- Product
- Conventional
- Organic
- Geography
- North America
- US
- Canada
- Europe
- Germany
- UK
- APAC
- China
- South America
- Middle East and Africa
- North America
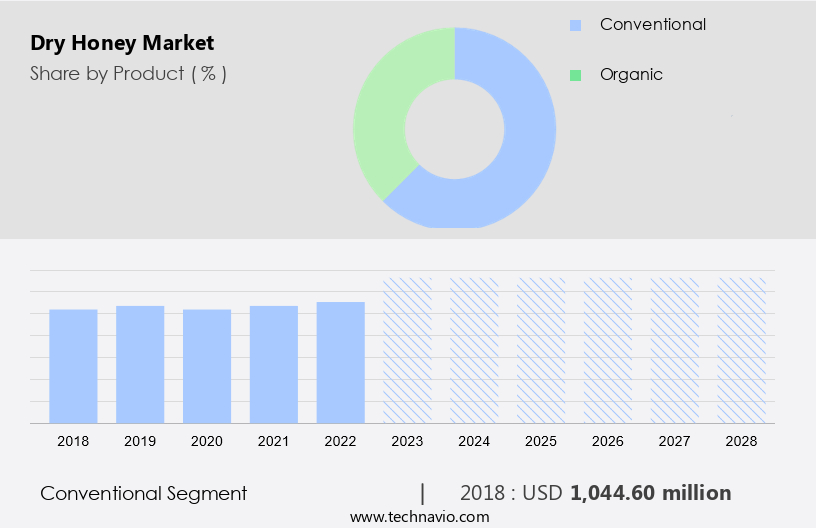
By Product Insights
The conventional segment is estimated to witness significant growth during the forecast period. The market is anticipated to experience significant expansion In the upcoming years due to various factors. One of the primary drivers of this growth is the affordability of conventional dry honey compared to its organic counterpart. This price difference is expected to attract a large consumer base, particularly those who are health-conscious but have budget constraints. Dry honey is not only a popular sweetener but also a nutritional supplement. It is rich in antioxidants and provides essential vitamins and minerals, making it an excellent addition to various food and beverage products. In the baking industry, dry honey is widely used In the production of bread and cakes, adding sweetness and nutritional value to these items. In the food sector, dry honey is used as a food sweetener in bakery products such as bread and cake, catering to the health-conscious consumer trend.
Moreover, the personal care industry also utilizes dry honey in cosmetics formulations due to its moisturizing and antioxidant properties. The increasing awareness about the health benefits of dry honey is expected to boost its demand in both the food and personal care industries during the forecast period. Therefore, the versatility and health benefits of dry honey make it an attractive option for various applications, ensuring its continued growth In the market.
Get a glance at the market report of share of various segments Request Free Sample
The Conventional segment was valued at USD 1.04 billion in 2018 and showed a gradual increase during the forecast period.
Regional Analysis
North America is estimated to contribute 46% to the growth of the global market during the forecast period. Technavio's analysts have elaborately explained the regional trends and drivers that shape the market during the forecast period.

For more insights on the market size of various regions, Request Free Sample
The market In the United States, Canada, and Mexico is experiencing growth due to the expanding number of honeybee colonies. According to the United States Department of Agriculture (USDA), the total count of bee colonies for honey production In the US rose by 1.52% from January 2018 to January 2019. This growth trend is anticipated to boost the production of raw honey, subsequently increasing the availability of dry honey for industries such as food and beverage and personal care. Beekeepers and researchers are dedicated to preserving honeybee colonies and enhancing honey production, making honey a healthier alternative for various food items, including cereals and low-calorie snacks.
Dry honey, also known as honey powder, functions as a flavor enhancer and contributes to the growth of the organic food market. As a result, the demand for dry honey is expected to continue rising in North America.
Market Dynamics
Our researchers analyzed the data with 2023 as the base year, along with the key drivers, trends, and challenges. A holistic analysis of drivers will help companies refine their marketing strategies to gain a competitive advantage.
What are the key market drivers leading to the rise In the adoption of Dry Honey Industry?
- Health benefits of consuming dry honey is the key driver of the market. Dry honey, a natural sweetener, is gaining popularity in various industries due to its antimicrobial properties and rich antioxidant content. Composed primarily of glucose and fructose, it also contains essential minerals like iron, phosphate, calcium, potassium, sodium chloride, and magnesium.
- Consumption of dry honey offers numerous health benefits, including control of blood pressure and heart diseases, reduction of LDL cholesterol, improvement of HDL cholesterol levels, promotion of wound and burn healing, and suppression of cough in children. In the food manufacturing sector, dry honey is used as a healthier substitute for artificial sweeteners in baked goods and dietary supplements. Thus, such factors are driving the growth of the market during the forecast period.
What are the market trends shaping the Dry Honey Industry?
- Restoration of natural bee habitats is the upcoming market trend. The global decline in honeybee populations is posing significant challenges to the production of dry honey and other honey-based products. Natural habitats, such as tree cavities or hives in gardens and forests, are essential for honeybees to thrive. However, urbanization is destroying these habitats, forcing bees to build hives in unnatural environments or travel long distances to find food sources.
- As a result, there is a growing interest in initiatives aimed at increasing the number of natural bee habitats, such as the Fort Honeybee pilot project and the Feed a Bee initiative. In the US, some cities have started installing bee hotels and planting pollinator-friendly gardens to provide bees with suitable habitats. Dry honey, a form of honey that does not contain moisture, is used as a substitute for sucrose in various medicines, supplements, and food additives. Thus, such trends will shape the growth of the market during the forecast period.
What challenges does the Dry Honey Industry face during its growth?
- Declining number of honeybee colonies is a key challenge affecting the industry growth. The global honey market encompasses various honey products, including desserts, that utilize different drying methods such as sun-drying and modern techniques like freeze-drying. As consumer preferences shift towards clean-label ingredients, the demand for natural, additive-free honey, including powdered honey and honey snacks, is on the rise.
- Moreover, eco-friendly packaging is gaining traction as a crucial consideration for environmentally-conscious consumers. Despite the declining number of honey bee colonies worldwide, primarily due to natural disasters and weather conditions, the honey industry continues to thrive. Countries like Portugal, Italy, Northern Ireland, the UK, Israel, Belarus, and Serbia have reported significant losses in honey bee colonies. Hence, the above factors will impede the growth of the market during the forecast period.
Exclusive Customer Landscape
The dry honey market forecasting report includes the adoption lifecycle of the market, covering from the innovator's stage to the laggard's stage. It focuses on adoption rates in different regions based on penetration. Furthermore, the dry honey market report also includes key purchase criteria and drivers of price sensitivity to help companies evaluate and develop their market growth analysis strategies.

Customer Landscape
Key Companies & Market Insights
Companies are implementing various strategies, such as strategic alliances, dry honey market forecast, partnerships, mergers and acquisitions, geographical expansion, and product/service launches, to enhance their presence In the industry.
The industry research and growth report includes detailed analyses of the competitive landscape of the market and information about key companies, including:
- AmTech Ingredients
- Archer Daniels Midland Co.
- ASR GROUP
- Associated British Foods Plc
- Blue Chip Group
- Delee Foods Group Co. Ltd.
- Fresh Essentials organics
- Holy Natural
- Honibe
- Melland Ecogreen Technology Co. Ltd.
- Norevo GmbH
- SoulBee Honey
- Woodland Foods Ltd.
Qualitative and quantitative analysis of companies has been conducted to help clients understand the wider business environment as well as the strengths and weaknesses of key industry players. Data is qualitatively analyzed to categorize companies as pure play, category-focused, industry-focused, and diversified; it is quantitatively analyzed to categorize companies as dominant, leading, strong, tentative, and weak.
Research Analyst Overview
The market is witnessing significant growth due to the increasing demand for natural sweeteners and functional food items. Chronic conditions such as diabetes have led consumers to seek healthier alternatives to traditional sweeteners like sugar and high-fructose corn syrup. Dry honey, with its natural sweetness and nutritional benefits, is gaining popularity as a substitute in various food applications. Furthermore, dry honey is used as a preservative and flavor enhancer in cosmetics formulations, including moisturizing creams and shampoos. Its consistency makes it an ideal ingredient for bakery food products, providing a more natural and healthier alternative to processed sweeteners.
Dry honey is also used as a nutritional supplement and food additive, providing essential macronutrients and micronutrients. It is used In the production of various food items, including cereals, cakes, bread, and low-calorie snacks. The market for dry honey is expected to grow as consumers shift towards a healthy diet and eco-friendly packaging. Manufacturers are adopting sustainable drying methods such as vacuum drying and freeze-drying to maintain the natural properties of honey. Additionally, the use of clean-label ingredients and sustainable packaging is becoming increasingly important In the organic food market, further driving the demand for dry honey.
Moreover, Honey is a natural sugar alternative with a wide array of health benefits. Rich in honey nutrition, it provides a natural source of energy and is a great vegan sweetener and organic sweetener. Honey for immunity is well-known, offering antioxidants, anti-inflammatory, and antibacterial properties. It also aids in wound healing, digestion, and weight management. Honey for skin and honey for hair are common in cosmetics and skin care routines. Honey for cough, soothing sore throats, and promoting sleep are just a few of its therapeutic uses. As a diabetic-friendly, sugar-free option, it's perfect for honey recipes and baking.
|
Market Scope |
|
|
Report Coverage |
Details |
|
Page number |
169 |
|
Base year |
2023 |
|
Historic period |
2018-2022 |
|
Forecast period |
2024-2028 |
|
Growth momentum & CAGR |
Accelerate at a CAGR of 3.7% |
|
Market growth 2024-2028 |
USD 257.6 million |
|
Market structure |
Concentrated |
|
YoY growth 2023-2024(%) |
3.5 |
|
Key countries |
US, Canada, Germany, UK, and China |
|
Competitive landscape |
Leading Companies, Market Positioning of Companies, Competitive Strategies, and Industry Risks |
What are the Key Data Covered in this Dry Honey Market Research and Growth Report?
- CAGR of the Dry Honey industry during the forecast period
- Detailed information on factors that will drive the growth and forecasting between 2024 and 2028
- Precise estimation of the size of the market and its contribution of the industry in focus to the parent market
- Accurate predictions about upcoming growth and trends and changes in consumer behaviour
- Growth of the market across North America, Europe, APAC, South America, and Middle East and Africa
- Thorough analysis of the market's competitive landscape and detailed information about companies
- Comprehensive analysis of factors that will challenge the dry honey market growth and forecasting
We can help! Our analysts can customize this dry honey market research report to meet your requirements.
 RIA -
RIA - 
