
Amines Market Analysis, Size, and Forecast 2026-2030: APAC (China, India, and Japan), North America (US, Canada, and Mexico), Europe (Germany, UK, and France), Middle East and Africa (Saudi Arabia, UAE, and Turkey), South America (Brazil, Argentina, and Chile), and Rest of World (ROW)

Amines Market Analysis, Size, and Forecast 2026-2030:
APAC (China, India, and Japan), North America (US, Canada, and Mexico), Europe (Germany, UK, and France), Middle East and Africa (Saudi Arabia, UAE, and Turkey), South America (Brazil, Argentina, and Chile), and Rest of World (ROW)

Published: Oct 2026 316 Pages SKU: IRTNTR75587

Market Overview at a Glance

$2.80 B
Market Opportunity
4.6%
CAGR 2025 - 2030
31.7%
North America Growth
$4.88 B
Ethanolamine segment 2024

Amines Market Size 2026-2030

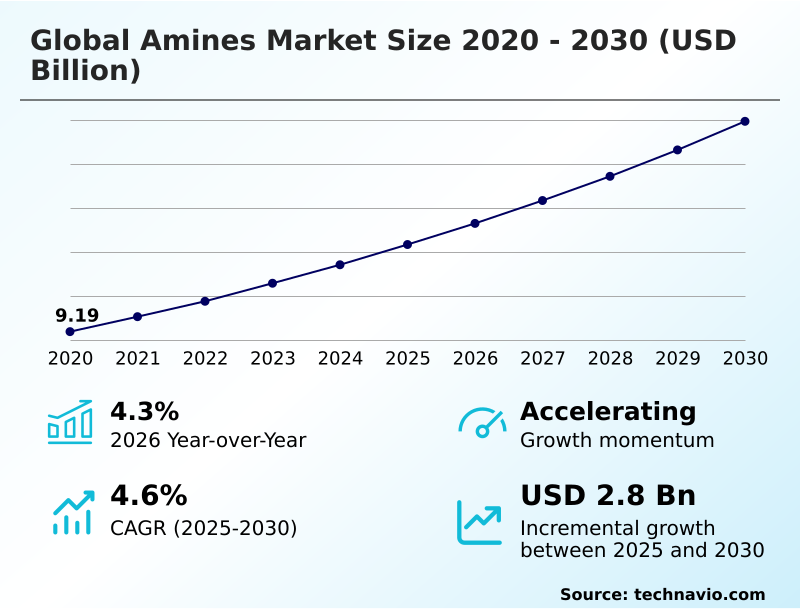
The amines market size is valued to increase by USD 2.80 billion, at a CAGR of 4.6% from 2025 to 2030. Expansive and resilient demand from core end-use industries will drive the amines market.

Major Market Trends & Insights

  • North America dominated the market and accounted for a 31.7% growth during the forecast period.
  • By Product - Ethanolamine segment was valued at USD 4.88 billion in 2024
  • By Application - Pesticides segment accounted for the largest market revenue share in 2024

Market Size & Forecast

  • Market Opportunities: USD 4.77 billion
  • Market Future Opportunities: USD 2.80 billion
  • CAGR from 2025 to 2030 : 4.6%

Market Summary

  • The Amines Market demonstrates consistent behavioral resilience due to its indispensable role in formulating critical industrial intermediates. Continuous demand from agricultural and energy sectors underpins this stability. A notable business scenario involves energy operators enhancing gas sweetening processes to remove acidic impurities from natural gas.
  • By implementing advanced amine solvents, these facilities achieve a 20% reduction in equipment corrosion rates, directly improving operational longevity. The market is primarily driven by the imperative to increase agricultural output, which requires robust agrochemical formulations for crop protection. Conversely, the industry faces severe challenges from fluctuating petrochemical feedstock availability, which creates unpredictable production cost variations.
  • Supply bottlenecks in core chemical precursors frequently force manufacturers to recalibrate pricing structures and inventory strategies. As regulatory pressures intensify, companies are increasingly exploring alternative sustainable feedstocks to mitigate procurement risks. These strategic adaptations are fundamentally reshaping how industrial chemicals are sourced, refined, and distributed across the broader manufacturing landscape.

What will be the Size of the Amines Market during the forecast period?
Get Key Insights on Market Forecast (PDF) Get Free Sample

How is the Amines Market Segmented?

The amines industry research report provides comprehensive data (region-wise segment analysis), with forecasts and estimates in "USD million" for the period 2026-2030, as well as historical data from 2020-2024 for the following segments.

  • Product
    • Ethanolamine
    • Fatty amines
    • Specialty amines
    • Ethyleneamines
  • Application
    • Pesticides
    • Surfactants
    • Personal care
    • Lubricants
    • Others
  • Product type
    • Synthetic amines
    • Bio-based amines
  • Geography
    • APAC
      • China
      • India
      • Japan
      • South Korea
      • Indonesia
      • Australia
    • North America
      • US
      • Canada
      • Mexico
    • Europe
      • Germany
      • UK
      • France
      • Italy
      • Spain
      • The Netherlands
    • Middle East and Africa
      • Saudi Arabia
      • UAE
      • Turkey
      • South Africa
      • Israel
    • South America
      • Brazil
      • Argentina
      • Chile

By Product Insights

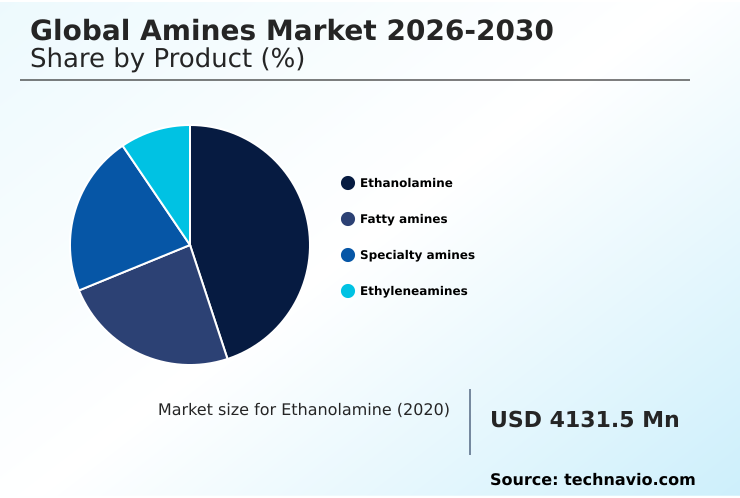
The ethanolamine segment is estimated to witness significant growth during the forecast period.

Ethanolamine formulation serves as a critical structural component across multiple downstream industrial applications. The segment functions primarily as an intermediary for gas processing and industrial chemical reactions.

Businesses utilizing aliphatic amine derivatives report a 15% improvement in process stability during natural gas purification. Manufacturers are increasingly optimizing fatty amine synthesis alongside specialty amine production to meet shifting performance criteria.

This operational pivot enhances supply chain resilience against raw material volatility by diversifying precursor sourcing. Companies leverage continuous chemical reaction optimization to refine the purity of ethanolamines. These strategic adjustments ensure stable throughput for agricultural and construction end-users.

Consequently, specialized formulations are directly reducing production bottlenecks and aligning output with stringent application requirements.
Get Free Sample

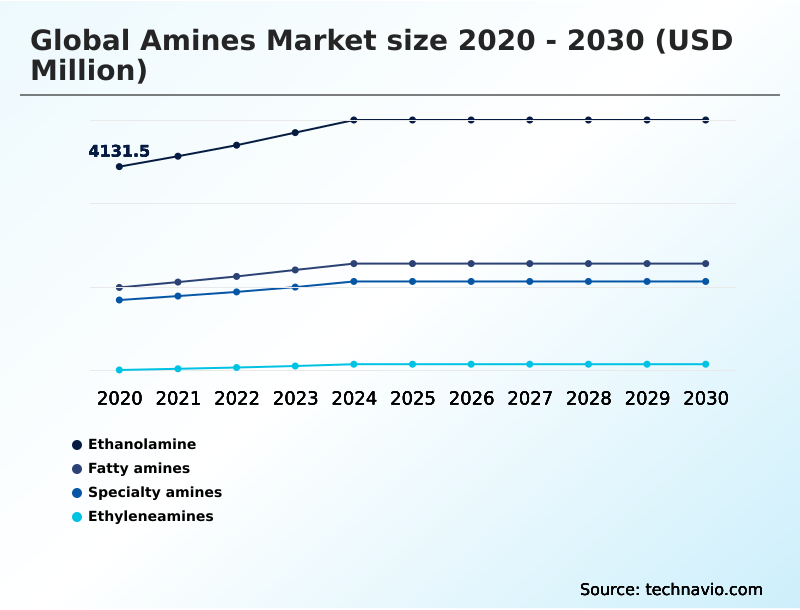
The Ethanolamine segment was valued at USD 4.88 billion in 2024 and showed a gradual increase during the forecast period.
Get Free Sample

Regional Analysis

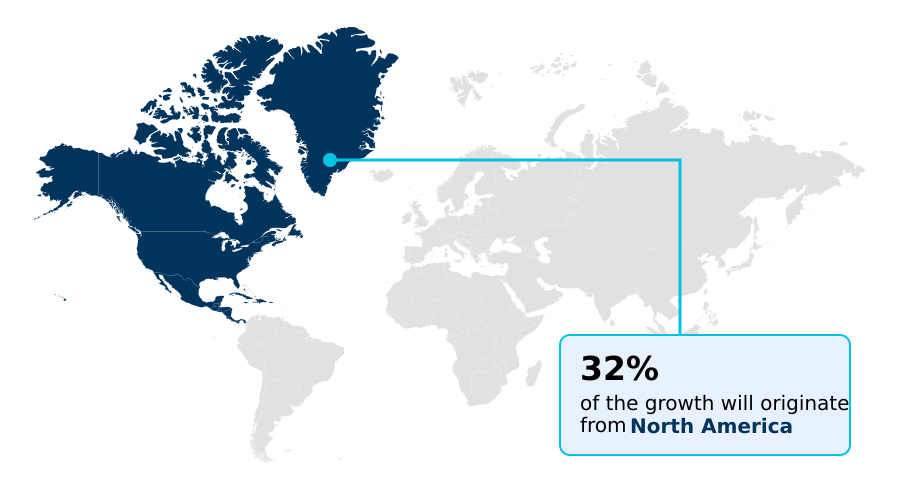
North America is estimated to contribute 31.7% to the growth of the global market during the forecast period.Technavio’s analysts have elaborately explained the regional trends and drivers that shape the market during the forecast period.
See How Amines Market Demand is Rising in North America Get Free Sample

Regional discrepancies in the Amines Market stem from varying industrial maturity and regulatory frameworks. North America demonstrates a highly integrated approach, where continuous chemical synthesis improves resource utilization by 18% compared to emerging regions.

In contrast, APAC focuses on volume-driven agricultural and manufacturing outputs, leading to a 25% higher consumption rate of specialized intermediaries.

Businesses in North America prioritize advanced polymer composites for renewable infrastructure, whereas APAC entities heavily rely on polyurethane foam catalysts for rapid urbanization projects.

The transition toward hydrogen sulfide removal in the energy sector is accelerating, prompting organizations to adopt green chemistry transition protocols. Firms utilizing predictive maintenance algorithms have reduced unplanned plant downtime by 14%, ensuring steady inventory management agility.

These adaptations enable companies to navigate diverse supply chain complexities while maintaining competitive operational margins across differing geographical landscapes.

Market Dynamics

Our researchers analyzed the data with 2025 as the base year, along with the key drivers, trends, and challenges. A holistic analysis of drivers will help companies refine their marketing strategies to gain a competitive advantage.

  • The evolving landscape of chemical processing demands highly specialized solutions to address complex manufacturing constraints. Companies engaging in industrial bio based amine production are experiencing a notable paradigm shift, as sustainability mandates redefine operational priorities. This transition requires significant adjustments in procurement and synthesis, particularly when integrating amine based epoxy curing agents into durable composite materials.
  • Energy operators rely heavily on gas sweetening carbon capture solvents to minimize corrosive wear, reducing maintenance cycles by nearly a third compared to traditional filtration methods. Concurrently, the agricultural sector is maximizing crop yields through the targeted application of fatty amines for agricultural pesticides.
  • In municipal and industrial settings, the water treatment polyamine flocculants application is critical for meeting stringent discharge regulations. The electronics sector also benefits, utilizing specialty amines in electronics manufacturing to ensure component reliability. Despite these advancements, organizations must navigate synthetic amine supply chain volatility, which frequently disrupts production schedules.
  • To mitigate these risks, firms are optimizing the ethanolamine use in corrosion inhibitors while exploring green chemistry bio based surfactants. These strategic efforts support agricultural yield enhancement amine intermediates and drive industrial decarbonization through carbon capture solvents. Furthermore, the integration of advanced analytical models in chemical synthesis allows manufacturers to refine the quality of amine derivatives for polyurethane foams.
  • This comprehensive approach promotes the sustainable manufacturing of specialty amines and enhances the effectiveness of quaternary ammonium compounds in detergents, ensuring broad operational stability.
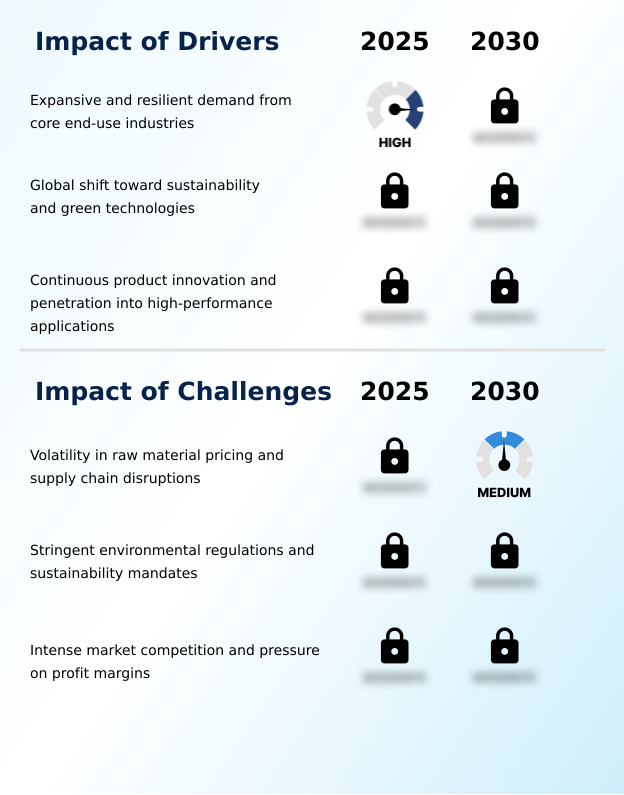
What are the key market drivers leading to the rise in the adoption of Amines Industry?

  • The expansive and resilient demand from core end-use industries serves as the primary driver propelling market expansion.

  • Rising demand for enhanced agricultural yields and resilient infrastructure acts as a powerful catalyst for chemical innovation. The systematic integration of agricultural pesticide intermediates improves crop protection efficacy, allowing farming operations to increase output efficiency by 25%.
  • Concurrently, the formulation of robust corrosion inhibitor compounds extends the lifespan of critical energy pipelines, lowering maintenance energy use by 12%. This demand surge is driven by the urgent need to optimize resource utilization across expanding global populations.
  • As a result, manufacturers of amine based surfactants and personal care emulsifiers are rapidly scaling production capabilities.
  • These expansions directly facilitate circular economy integration and promote the widespread use of environmental abatement technologies alongside advanced industrial cleaning agents, driving comprehensive improvements across multiple downstream manufacturing sectors.

What are the market trends shaping the Amines Industry?

  • The increasing adoption of bio-based amines and sustainable feedstocks represents a significant upcoming market trend. This shift is fundamentally driven by environmental regulations and consumer demand for eco-friendly chemical alternatives.

  • Industrial decarbonization mandates are fundamentally shifting the formulation strategies within the chemical sector. Manufacturers are heavily investing in polyamine flocculants to meet newly established wastewater discharge limits. The utilization of precise ethyleneamine extraction processes allows organizations to refine gas sweetening intermediates, directly decreasing facility emission rates.
  • Facilities implementing these advanced formulations report that equipment downtime reduced by 30%, while overall operational forecast accuracy improved by 18%. This transformation occurs because stricter environmental regulations necessitate superior pollutant capture methodologies. Consequently, downstream formulation processes are becoming highly specialized to accommodate new epoxy curing agents.
  • These strategic adaptations yield significant operational efficiency gains, allowing businesses to maintain high production volumes while strictly adhering to complex regulatory compliance standards.

What challenges does the Amines Industry face during its growth?

  • Volatility in raw material pricing and frequent supply chain disruptions remain critical challenges restricting overall industry growth.

  • Unpredictable fluctuations in raw material pricing create severe bottlenecks across continuous manufacturing operations. The procurement of synthetic amine precursors is highly vulnerable to geopolitical supply chain disruptions, which can increase operational costs by 12%. Furthermore, the complex petrochemical feedstock processing required for high-purity chemical generation frequently experiences delays, causing forecast accuracy to drop by 18%.
  • This instability is primarily caused by an overreliance on volatile crude oil derivatives. Consequently, businesses are struggling to maintain consistent profit margins while attempting to scale the production of carbon capture solvents. To counter these limitations, companies are heavily investing in bio based oleochemicals and sustainable manufacturing processes.
  • These shifts are essential for achieving long-term decarbonization targets and ensuring stable agrochemical yield improvement.

Exclusive Technavio Analysis on Customer Landscape

The amines market forecasting report includes the adoption lifecycle of the market, covering from the innovator’s stage to the laggard’s stage. It focuses on adoption rates in different regions based on penetration. Furthermore, the amines market report also includes key purchase criteria and drivers of price sensitivity to help companies evaluate and develop their market growth analysis strategies.
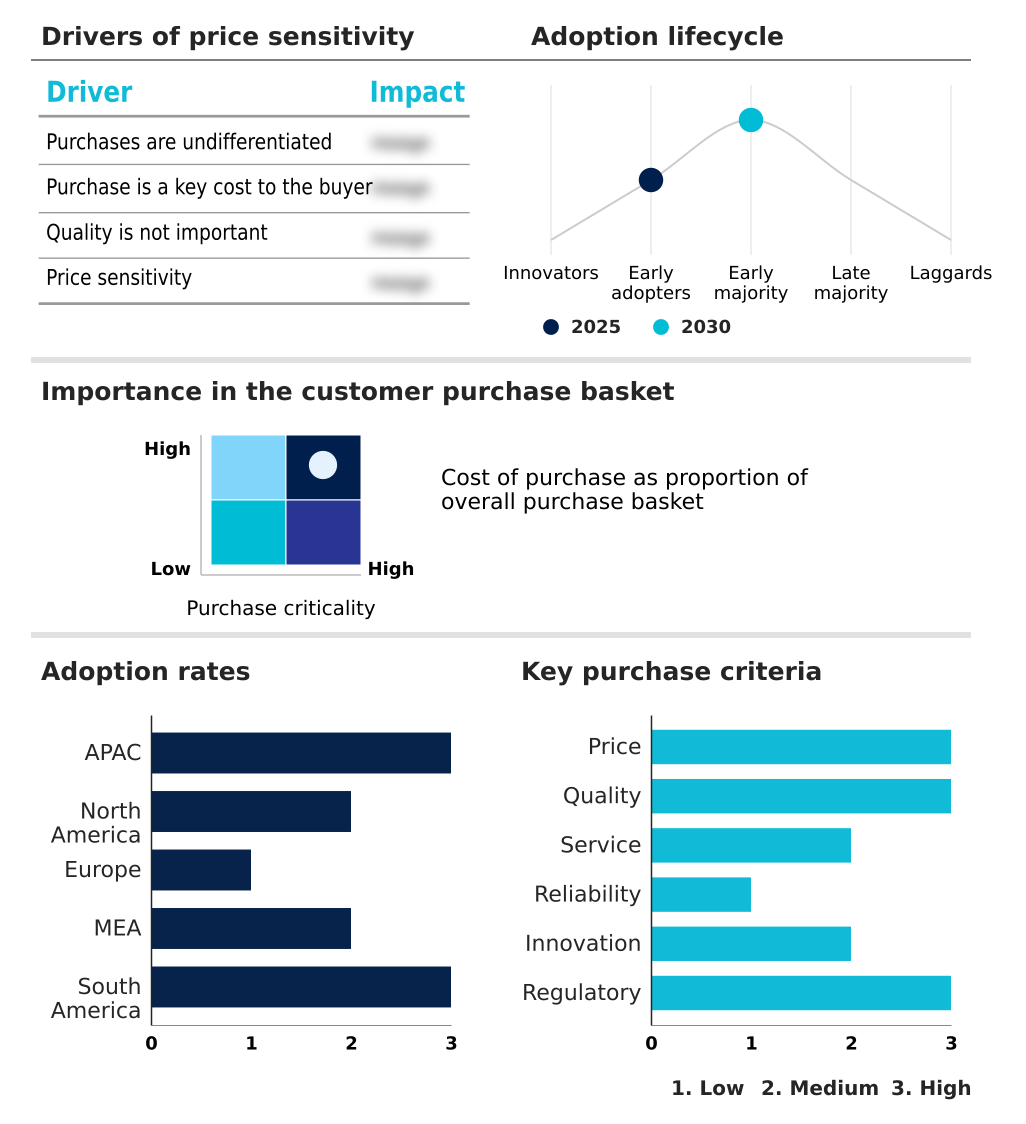
Customer Landscape of Amines Industry

Competitive Landscape

Companies are implementing various strategies, such as strategic alliances, amines market forecast, partnerships, mergers and acquisitions, geographical expansion, and product/service launches, to enhance their presence in the industry.

Alkyl Amines Chemicals Ltd. - This unified segment delivers essential aliphatic amines and fine chemicals, ensuring robust industrial performance while supporting specialized formulations across diverse downstream manufacturing applications.

The industry research and growth report includes detailed analyses of the competitive landscape of the market and information about key companies, including:

  • Alkyl Amines Chemicals Ltd.
  • Amines and Plasticizers ltd.
  • Arkema Group
  • Balaji Amines Ltd.
  • BASF SE
  • Croda International Plc
  • Dow Chemical Co.
  • Eastman Chemical Co.
  • Evonik Industries AG
  • Huntsman International LLC
  • Indo Amines Ltd.
  • INEOS Group Holdings S.A.
  • Kao Corp.
  • Nouryon Chemicals Holding B.V.
  • OQ SAOC
  • Saudi Basic Industries
  • Solvay SA
  • Syensqo SA
  • Tosoh Corp.
  • Wanhua Chemical Group Co. Ltd.

Qualitative and quantitative analysis of companies has been conducted to help clients understand the wider business environment as well as the strengths and weaknesses of key industry players. Data is qualitatively analyzed to categorize companies as pure play, category-focused, industry-focused, and diversified; it is quantitatively analyzed to categorize companies as dominant, leading, strong, tentative, and weak.

Recent Development and News in Amines market

  • In the Commodity Chemicals industry, the widespread adoption of stringent wastewater discharge protocols accelerated the deployment of advanced filtration systems, directly impacting Amines demand by increasing the consumption of specialized coagulants by 22%.
  • The transition toward bio-based feedstocks in oleochemical processing reduced reliance on crude oil derivatives, expanding the availability of renewable precursors for sustainable surfactant production and lowering carbon footprints by 15%.
  • Implementation of the European Union REACH compliance framework mandated rigorous toxicity testing for hazardous intermediates, driving a 30% shift in procurement strategies toward safer chemical catalysts in agricultural formulations.
  • Expansion of offshore wind energy infrastructure necessitated high-durability composite materials, increasing the requirement for advanced epoxy hardeners and boosting regional chemical processing throughput by 18%.

Dive into Technavio’s robust research methodology, blending expert interviews, extensive data synthesis, and validated models for unparalleled Amines Market insights. See full methodology.

Market Scope
Page number 316
Base year 2025
Historic period 2020-2024
Forecast period 2026-2030
Growth momentum & CAGR Accelerate at a CAGR of 4.6%
Market growth 2026-2030 USD 2799.5 million
Market structure Fragmented
YoY growth 2025-2026(%) 4.3%
Key countries China, India, Japan, South Korea, Indonesia, Australia, US, Canada, Mexico, Germany, UK, France, Italy, Spain, The Netherlands, Saudi Arabia, UAE, Turkey, South Africa, Israel, Brazil, Argentina and Chile
Competitive landscape Leading Companies, Market Positioning of Companies, Competitive Strategies, and Industry Risks

Request Free Sample

Research Analyst Overview

  • The Amines Market is undergoing a structural realignment driven by stringent environmental regulations and the necessity for superior material performance. Boardroom executives are increasingly prioritizing biodegradable chemical alternatives to ensure long-term regulatory compliance and mitigate future environmental liabilities. This strategic pivot heavily influences product development budgets, accelerating the commercialization of advanced amine formulations.
  • Facilities adopting specialized curing applications for composite materials have recorded a 30% reduction in processing time, directly enhancing manufacturing throughput. The integration of high performance fluid additives continues to optimize industrial machinery operations by minimizing friction and thermal degradation. Furthermore, the synthesis of precise amine derivatives and aliphatic amines is critical for creating specialized plasticizers used in modern infrastructure.
  • These operational enhancements allow chemical producers to maintain robust margins despite fluctuating precursor costs. By systematically aligning product portfolios with sustainability targets, organizations effectively reduce energy consumption during intensive synthesis phases, securing a resilient and compliant supply chain architecture.

What are the Key Data Covered in this Amines Market Research and Growth Report?

  • What is the expected growth of the Amines Market between 2026 and 2030?

    • USD 2.80 billion, at a CAGR of 4.6%

  • What segmentation does the market report cover?

    • The report is segmented by Product (Ethanolamine, Fatty amines, Specialty amines, and Ethyleneamines), Application (Pesticides, Surfactants, Personal care, Lubricants, and Others), Product Type (Synthetic amines, and Bio-based amines) and Geography (APAC, North America, Europe, Middle East and Africa, South America)

  • Which regions are analyzed in the report?

    • APAC, North America, Europe, Middle East and Africa and South America

  • What are the key growth drivers and market challenges?

    • Expansive and resilient demand from core end-use industries, Volatility in raw material pricing and supply chain disruptions

  • Who are the major players in the Amines Market?

    • Alkyl Amines Chemicals Ltd., Amines and Plasticizers ltd., Arkema Group, Balaji Amines Ltd., BASF SE, Croda International Plc, Dow Chemical Co., Eastman Chemical Co., Evonik Industries AG, Huntsman International LLC, Indo Amines Ltd., INEOS Group Holdings S.A., Kao Corp., Nouryon Chemicals Holding B.V., OQ SAOC, Saudi Basic Industries, Solvay SA, Syensqo SA, Tosoh Corp. and Wanhua Chemical Group Co. Ltd.

Market Research Insights

  • The Amines Market relies heavily on process intensification strategies to balance raw material procurement costs with stringent output demands. Manufacturers implementing advanced catalytic conversion report a 15% improvement in overall yield efficiency. Furthermore, predictive inventory modeling has allowed procurement teams to reduce supply shortage risks by 22%, directly improving production uptime.
  • Companies are aggressively prioritizing carbon footprint mitigation to align with evolving environmental protocols. This proactive approach minimizes compliance penalties while simultaneously decreasing energy expenditure by 18% during intensive refining phases. These structural shifts ensure that intermediate chemical production remains economically viable despite fluctuating global energy indexes.

We can help! Our analysts can customize this amines market research report to meet your requirements.

Get in touch

1. Executive Summary

1.1 Market overview

Executive Summary - Chart on Market Overview
Executive Summary - Data Table on Market Overview
Executive Summary - Chart on Global Market Characteristics
Executive Summary - Chart on Market by Geography
Executive Summary - Chart on Market Segmentation by Product
Executive Summary - Chart on Market Segmentation by Application
Executive Summary - Chart on Market Segmentation by Product Type
Executive Summary - Chart on Incremental Growth
Executive Summary - Data Table on Incremental Growth
Executive Summary - Chart on Company Market Positioning

2. Technavio Analysis

2.1 Analysis of price sensitivity, lifecycle, customer purchase basket, adoption rates, and purchase criteria

2.2 Criticality of inputs and Factors of differentiation

Chart on Overview on criticality of inputs and factors of differentiation

2.3 Factors of disruption

Chart on Overview on factors of disruption

2.4 Impact of drivers and challenges

Chart on Impact of drivers and challenges in 2025 and 2030

3. Market Landscape

3.1 Market ecosystem

Chart on Parent Market
Data Table on - Parent Market

3.2 Market characteristics

Chart on Market characteristics analysis

3.3 Value chain analysis

Chart on Value chain analysis

4. Market Sizing

4.1 Market definition

Data Table on Offerings of companies included in the market definition

4.2 Market segment analysis

Market segments

4.3 Market size 2025

4.4 Market outlook: Forecast for 2025-2030

Chart on Global - Market size and forecast 2025-2030 ($ million)
Data Table on Global - Market size and forecast 2025-2030 ($ million)
Chart on Global Market: Year-over-year growth 2025-2030 (%)
Data Table on Global Market: Year-over-year growth 2025-2030 (%)

5. Historic Market Size

5.1 Global Amines Market 2020 - 2024

Historic Market Size - Data Table on Global Amines Market 2020 - 2024 ($ million)

5.2 Product segment analysis 2020 - 2024

Historic Market Size - Product Segment 2020 - 2024 ($ million)

5.3 Application segment analysis 2020 - 2024

Historic Market Size - Application Segment 2020 - 2024 ($ million)

5.4 Product Type segment analysis 2020 - 2024

Historic Market Size - Product Type Segment 2020 - 2024 ($ million)

5.5 Geography segment analysis 2020 - 2024

Historic Market Size - Geography Segment 2020 - 2024 ($ million)

5.6 Country segment analysis 2020 - 2024

Historic Market Size - Country Segment 2020 - 2024 ($ million)

6. Qualitative Analysis

6.1 Impact of AI on Global Amines Market

6.2 Impact of Geopolitical Conflicts on Global Amines Market

7. Five Forces Analysis

7.1 Five forces summary

Five forces analysis - Comparison between 2025 and 2030

7.2 Bargaining power of buyers

Bargaining power of buyers - Impact of key factors 2025 and 2030

7.3 Bargaining power of suppliers

Bargaining power of suppliers - Impact of key factors in 2025 and 2030

7.4 Threat of new entrants

Threat of new entrants - Impact of key factors in 2025 and 2030

7.5 Threat of substitutes

Threat of substitutes - Impact of key factors in 2025 and 2030

7.6 Threat of rivalry

Threat of rivalry - Impact of key factors in 2025 and 2030

7.7 Market condition

Chart on Market condition - Five forces 2025 and 2030

8. Market Segmentation by Product

8.1 Market segments

Chart on Product - Market share 2025-2030 (%)
Data Table on Product - Market share 2025-2030 (%)

8.2 Comparison by Product

Chart on Comparison by Product
Data Table on Comparison by Product

8.3 Ethanolamine - Market size and forecast 2025-2030

Chart on Ethanolamine - Market size and forecast 2025-2030 ($ million)
Data Table on Ethanolamine - Market size and forecast 2025-2030 ($ million)
Chart on Ethanolamine - Year-over-year growth 2025-2030 (%)
Data Table on Ethanolamine - Year-over-year growth 2025-2030 (%)

8.4 Fatty amines - Market size and forecast 2025-2030

Chart on Fatty amines - Market size and forecast 2025-2030 ($ million)
Data Table on Fatty amines - Market size and forecast 2025-2030 ($ million)
Chart on Fatty amines - Year-over-year growth 2025-2030 (%)
Data Table on Fatty amines - Year-over-year growth 2025-2030 (%)

8.5 Specialty amines - Market size and forecast 2025-2030

Chart on Specialty amines - Market size and forecast 2025-2030 ($ million)
Data Table on Specialty amines - Market size and forecast 2025-2030 ($ million)
Chart on Specialty amines - Year-over-year growth 2025-2030 (%)
Data Table on Specialty amines - Year-over-year growth 2025-2030 (%)

8.6 Ethyleneamines - Market size and forecast 2025-2030

Chart on Ethyleneamines - Market size and forecast 2025-2030 ($ million)
Data Table on Ethyleneamines - Market size and forecast 2025-2030 ($ million)
Chart on Ethyleneamines - Year-over-year growth 2025-2030 (%)
Data Table on Ethyleneamines - Year-over-year growth 2025-2030 (%)

8.7 Market opportunity by Product

Market opportunity by Product ($ million)
Data Table on Market opportunity by Product ($ million)

9. Market Segmentation by Application

9.1 Market segments

Chart on Application - Market share 2025-2030 (%)
Data Table on Application - Market share 2025-2030 (%)

9.2 Comparison by Application

Chart on Comparison by Application
Data Table on Comparison by Application

9.3 Pesticides - Market size and forecast 2025-2030

Chart on Pesticides - Market size and forecast 2025-2030 ($ million)
Data Table on Pesticides - Market size and forecast 2025-2030 ($ million)
Chart on Pesticides - Year-over-year growth 2025-2030 (%)
Data Table on Pesticides - Year-over-year growth 2025-2030 (%)

9.4 Surfactants - Market size and forecast 2025-2030

Chart on Surfactants - Market size and forecast 2025-2030 ($ million)
Data Table on Surfactants - Market size and forecast 2025-2030 ($ million)
Chart on Surfactants - Year-over-year growth 2025-2030 (%)
Data Table on Surfactants - Year-over-year growth 2025-2030 (%)

9.5 Personal care - Market size and forecast 2025-2030

Chart on Personal care - Market size and forecast 2025-2030 ($ million)
Data Table on Personal care - Market size and forecast 2025-2030 ($ million)
Chart on Personal care - Year-over-year growth 2025-2030 (%)
Data Table on Personal care - Year-over-year growth 2025-2030 (%)

9.6 Lubricants - Market size and forecast 2025-2030

Chart on Lubricants - Market size and forecast 2025-2030 ($ million)
Data Table on Lubricants - Market size and forecast 2025-2030 ($ million)
Chart on Lubricants - Year-over-year growth 2025-2030 (%)
Data Table on Lubricants - Year-over-year growth 2025-2030 (%)

9.7 Others - Market size and forecast 2025-2030

Chart on Others - Market size and forecast 2025-2030 ($ million)
Data Table on Others - Market size and forecast 2025-2030 ($ million)
Chart on Others - Year-over-year growth 2025-2030 (%)
Data Table on Others - Year-over-year growth 2025-2030 (%)

9.8 Market opportunity by Application

Market opportunity by Application ($ million)
Data Table on Market opportunity by Application ($ million)

10. Market Segmentation by Product Type

10.1 Market segments

Chart on Product Type - Market share 2025-2030 (%)
Data Table on Product Type - Market share 2025-2030 (%)

10.2 Comparison by Product Type

Chart on Comparison by Product Type
Data Table on Comparison by Product Type

10.3 Synthetic amines - Market size and forecast 2025-2030

Chart on Synthetic amines - Market size and forecast 2025-2030 ($ million)
Data Table on Synthetic amines - Market size and forecast 2025-2030 ($ million)
Chart on Synthetic amines - Year-over-year growth 2025-2030 (%)
Data Table on Synthetic amines - Year-over-year growth 2025-2030 (%)

10.4 Bio-based amines - Market size and forecast 2025-2030

Chart on Bio-based amines - Market size and forecast 2025-2030 ($ million)
Data Table on Bio-based amines - Market size and forecast 2025-2030 ($ million)
Chart on Bio-based amines - Year-over-year growth 2025-2030 (%)
Data Table on Bio-based amines - Year-over-year growth 2025-2030 (%)

10.5 Market opportunity by Product Type

Market opportunity by Product Type ($ million)
Data Table on Market opportunity by Product Type ($ million)

11. Customer Landscape

11.1 Customer landscape overview

Analysis of price sensitivity, lifecycle, customer purchase basket, adoption rates, and purchase criteria

12. Geographic Landscape

12.1 Geographic segmentation

Chart on Market share by geography 2025-2030 (%)
Data Table on Market share by geography 2025-2030 (%)

12.2 Geographic comparison

Chart on Geographic comparison
Data Table on Geographic comparison

12.3 APAC - Market size and forecast 2025-2030

Chart on APAC - Market size and forecast 2025-2030 ($ million)
Data Table on APAC - Market size and forecast 2025-2030 ($ million)
Chart on APAC - Year-over-year growth 2025-2030 (%)
Data Table on APAC - Year-over-year growth 2025-2030 (%)
Chart on Regional Comparison - APAC
Data Table on Regional Comparison - APAC

12.3.1 China - Market size and forecast 2025-2030

Chart on China - Market size and forecast 2025-2030 ($ million)
Data Table on China - Market size and forecast 2025-2030 ($ million)
Chart on China - Year-over-year growth 2025-2030 (%)
Data Table on China - Year-over-year growth 2025-2030 (%)

12.3.2 India - Market size and forecast 2025-2030

Chart on India - Market size and forecast 2025-2030 ($ million)
Data Table on India - Market size and forecast 2025-2030 ($ million)
Chart on India - Year-over-year growth 2025-2030 (%)
Data Table on India - Year-over-year growth 2025-2030 (%)

12.3.3 Japan - Market size and forecast 2025-2030

Chart on Japan - Market size and forecast 2025-2030 ($ million)
Data Table on Japan - Market size and forecast 2025-2030 ($ million)
Chart on Japan - Year-over-year growth 2025-2030 (%)
Data Table on Japan - Year-over-year growth 2025-2030 (%)

12.3.4 South Korea - Market size and forecast 2025-2030

Chart on South Korea - Market size and forecast 2025-2030 ($ million)
Data Table on South Korea - Market size and forecast 2025-2030 ($ million)
Chart on South Korea - Year-over-year growth 2025-2030 (%)
Data Table on South Korea - Year-over-year growth 2025-2030 (%)

12.3.5 Indonesia - Market size and forecast 2025-2030

Chart on Indonesia - Market size and forecast 2025-2030 ($ million)
Data Table on Indonesia - Market size and forecast 2025-2030 ($ million)
Chart on Indonesia - Year-over-year growth 2025-2030 (%)
Data Table on Indonesia - Year-over-year growth 2025-2030 (%)

12.3.6 Australia - Market size and forecast 2025-2030

Chart on Australia - Market size and forecast 2025-2030 ($ million)
Data Table on Australia - Market size and forecast 2025-2030 ($ million)
Chart on Australia - Year-over-year growth 2025-2030 (%)
Data Table on Australia - Year-over-year growth 2025-2030 (%)

12.4 North America - Market size and forecast 2025-2030

Chart on North America - Market size and forecast 2025-2030 ($ million)
Data Table on North America - Market size and forecast 2025-2030 ($ million)
Chart on North America - Year-over-year growth 2025-2030 (%)
Data Table on North America - Year-over-year growth 2025-2030 (%)
Chart on Regional Comparison - North America
Data Table on Regional Comparison - North America

12.4.1 US - Market size and forecast 2025-2030

Chart on US - Market size and forecast 2025-2030 ($ million)
Data Table on US - Market size and forecast 2025-2030 ($ million)
Chart on US - Year-over-year growth 2025-2030 (%)
Data Table on US - Year-over-year growth 2025-2030 (%)

12.4.2 Canada - Market size and forecast 2025-2030

Chart on Canada - Market size and forecast 2025-2030 ($ million)
Data Table on Canada - Market size and forecast 2025-2030 ($ million)
Chart on Canada - Year-over-year growth 2025-2030 (%)
Data Table on Canada - Year-over-year growth 2025-2030 (%)

12.4.3 Mexico - Market size and forecast 2025-2030

Chart on Mexico - Market size and forecast 2025-2030 ($ million)
Data Table on Mexico - Market size and forecast 2025-2030 ($ million)
Chart on Mexico - Year-over-year growth 2025-2030 (%)
Data Table on Mexico - Year-over-year growth 2025-2030 (%)

12.5 Europe - Market size and forecast 2025-2030

Chart on Europe - Market size and forecast 2025-2030 ($ million)
Data Table on Europe - Market size and forecast 2025-2030 ($ million)
Chart on Europe - Year-over-year growth 2025-2030 (%)
Data Table on Europe - Year-over-year growth 2025-2030 (%)
Chart on Regional Comparison - Europe
Data Table on Regional Comparison - Europe

12.5.1 Germany - Market size and forecast 2025-2030

Chart on Germany - Market size and forecast 2025-2030 ($ million)
Data Table on Germany - Market size and forecast 2025-2030 ($ million)
Chart on Germany - Year-over-year growth 2025-2030 (%)
Data Table on Germany - Year-over-year growth 2025-2030 (%)

12.5.2 UK - Market size and forecast 2025-2030

Chart on UK - Market size and forecast 2025-2030 ($ million)
Data Table on UK - Market size and forecast 2025-2030 ($ million)
Chart on UK - Year-over-year growth 2025-2030 (%)
Data Table on UK - Year-over-year growth 2025-2030 (%)

12.5.3 France - Market size and forecast 2025-2030

Chart on France - Market size and forecast 2025-2030 ($ million)
Data Table on France - Market size and forecast 2025-2030 ($ million)
Chart on France - Year-over-year growth 2025-2030 (%)
Data Table on France - Year-over-year growth 2025-2030 (%)

12.5.4 Italy - Market size and forecast 2025-2030

Chart on Italy - Market size and forecast 2025-2030 ($ million)
Data Table on Italy - Market size and forecast 2025-2030 ($ million)
Chart on Italy - Year-over-year growth 2025-2030 (%)
Data Table on Italy - Year-over-year growth 2025-2030 (%)

12.5.5 Spain - Market size and forecast 2025-2030

Chart on Spain - Market size and forecast 2025-2030 ($ million)
Data Table on Spain - Market size and forecast 2025-2030 ($ million)
Chart on Spain - Year-over-year growth 2025-2030 (%)
Data Table on Spain - Year-over-year growth 2025-2030 (%)

12.5.6 The Netherlands - Market size and forecast 2025-2030

Chart on The Netherlands - Market size and forecast 2025-2030 ($ million)
Data Table on The Netherlands - Market size and forecast 2025-2030 ($ million)
Chart on The Netherlands - Year-over-year growth 2025-2030 (%)
Data Table on The Netherlands - Year-over-year growth 2025-2030 (%)

12.6 Middle East and Africa - Market size and forecast 2025-2030

Chart on Middle East and Africa - Market size and forecast 2025-2030 ($ million)
Data Table on Middle East and Africa - Market size and forecast 2025-2030 ($ million)
Chart on Middle East and Africa - Year-over-year growth 2025-2030 (%)
Data Table on Middle East and Africa - Year-over-year growth 2025-2030 (%)
Chart on Regional Comparison - Middle East and Africa
Data Table on Regional Comparison - Middle East and Africa

12.6.1 Saudi Arabia - Market size and forecast 2025-2030

Chart on Saudi Arabia - Market size and forecast 2025-2030 ($ million)
Data Table on Saudi Arabia - Market size and forecast 2025-2030 ($ million)
Chart on Saudi Arabia - Year-over-year growth 2025-2030 (%)
Data Table on Saudi Arabia - Year-over-year growth 2025-2030 (%)

12.6.2 UAE - Market size and forecast 2025-2030

Chart on UAE - Market size and forecast 2025-2030 ($ million)
Data Table on UAE - Market size and forecast 2025-2030 ($ million)
Chart on UAE - Year-over-year growth 2025-2030 (%)
Data Table on UAE - Year-over-year growth 2025-2030 (%)

12.6.3 Turkey - Market size and forecast 2025-2030

Chart on Turkey - Market size and forecast 2025-2030 ($ million)
Data Table on Turkey - Market size and forecast 2025-2030 ($ million)
Chart on Turkey - Year-over-year growth 2025-2030 (%)
Data Table on Turkey - Year-over-year growth 2025-2030 (%)

12.6.4 South Africa - Market size and forecast 2025-2030

Chart on South Africa - Market size and forecast 2025-2030 ($ million)
Data Table on South Africa - Market size and forecast 2025-2030 ($ million)
Chart on South Africa - Year-over-year growth 2025-2030 (%)
Data Table on South Africa - Year-over-year growth 2025-2030 (%)

12.6.5 Israel - Market size and forecast 2025-2030

Chart on Israel - Market size and forecast 2025-2030 ($ million)
Data Table on Israel - Market size and forecast 2025-2030 ($ million)
Chart on Israel - Year-over-year growth 2025-2030 (%)
Data Table on Israel - Year-over-year growth 2025-2030 (%)

12.7 South America - Market size and forecast 2025-2030

Chart on South America - Market size and forecast 2025-2030 ($ million)
Data Table on South America - Market size and forecast 2025-2030 ($ million)
Chart on South America - Year-over-year growth 2025-2030 (%)
Data Table on South America - Year-over-year growth 2025-2030 (%)
Chart on Regional Comparison - South America
Data Table on Regional Comparison - South America

12.7.1 Brazil - Market size and forecast 2025-2030

Chart on Brazil - Market size and forecast 2025-2030 ($ million)
Data Table on Brazil - Market size and forecast 2025-2030 ($ million)
Chart on Brazil - Year-over-year growth 2025-2030 (%)
Data Table on Brazil - Year-over-year growth 2025-2030 (%)

12.7.2 Argentina - Market size and forecast 2025-2030

Chart on Argentina - Market size and forecast 2025-2030 ($ million)
Data Table on Argentina - Market size and forecast 2025-2030 ($ million)
Chart on Argentina - Year-over-year growth 2025-2030 (%)
Data Table on Argentina - Year-over-year growth 2025-2030 (%)

12.7.3 Chile - Market size and forecast 2025-2030

Chart on Chile - Market size and forecast 2025-2030 ($ million)
Data Table on Chile - Market size and forecast 2025-2030 ($ million)
Chart on Chile - Year-over-year growth 2025-2030 (%)
Data Table on Chile - Year-over-year growth 2025-2030 (%)

12.8 Market opportunity by geography

Market opportunity by geography ($ million)
Data Tables on Market opportunity by geography ($ million)

13. Drivers, Challenges, and Opportunity

13.1 Market drivers

Expansive and resilient demand from core end-use industries
Global shift toward sustainability and green technologies
Continuous product innovation and penetration into high-performance applications

13.2 Market challenges

Volatility in raw material pricing and supply chain disruptions
Stringent environmental regulations and sustainability mandates
Intense market competition and pressure on profit margins

13.3 Impact of drivers and challenges

Impact of drivers and challenges in 2025 and 2030

13.4 Market opportunities

Increasing adoption of bio-based amines and sustainable feedstocks
Strategic shift towards high-value specialty amines
Integration of digitalization and industry 4.0 in manufacturing

14. Competitive Landscape

14.1 Overview

14.2

Overview on criticality of inputs and factors of differentiation

14.3 Landscape disruption

Overview on factors of disruption

14.4 Industry risks

Impact of key risks on business

15. Competitive Analysis

15.1 Companies profiled

Companies covered

15.2 Company ranking index

15.3 Market positioning of companies

Matrix on companies position and classification

15.4 Alkyl Amines Chemicals Ltd.

Alkyl Amines Chemicals Ltd. - Overview
Alkyl Amines Chemicals Ltd. - Product / Service
Alkyl Amines Chemicals Ltd. - Key offerings
SWOT

15.5 Arkema Group

Arkema Group - Overview
Arkema Group - Business segments
Arkema Group - Key news
Arkema Group - Key offerings
Arkema Group - Segment focus
SWOT

15.6 Balaji Amines Ltd.

Balaji Amines Ltd. - Overview
Balaji Amines Ltd. - Product / Service
Balaji Amines Ltd. - Key offerings
SWOT

15.7 BASF SE

BASF SE - Overview
BASF SE - Business segments
BASF SE - Key news
BASF SE - Key offerings
BASF SE - Segment focus
SWOT

15.8 Croda International Plc

Croda International Plc - Overview
Croda International Plc - Business segments
Croda International Plc - Key offerings
Croda International Plc - Segment focus
SWOT

15.9 Dow Chemical Co.

Dow Chemical Co. - Overview
Dow Chemical Co. - Business segments
Dow Chemical Co. - Key news
Dow Chemical Co. - Key offerings
Dow Chemical Co. - Segment focus
SWOT

15.10 Eastman Chemical Co.

Eastman Chemical Co. - Overview
Eastman Chemical Co. - Business segments
Eastman Chemical Co. - Key offerings
Eastman Chemical Co. - Segment focus
SWOT

15.11 Evonik Industries AG

Evonik Industries AG - Overview
Evonik Industries AG - Business segments
Evonik Industries AG - Key news
Evonik Industries AG - Key offerings
Evonik Industries AG - Segment focus
SWOT

15.12 Huntsman International LLC

Huntsman International LLC - Overview
Huntsman International LLC - Business segments
Huntsman International LLC - Key news
Huntsman International LLC - Key offerings
Huntsman International LLC - Segment focus
SWOT

15.13 Kao Corp.

Kao Corp. - Overview
Kao Corp. - Business segments
Kao Corp. - Key news
Kao Corp. - Key offerings
Kao Corp. - Segment focus
SWOT

15.14 Saudi Basic Industries

Saudi Basic Industries - Overview
Saudi Basic Industries - Business segments
Saudi Basic Industries - Key offerings
Saudi Basic Industries - Segment focus
SWOT

15.15 Solvay SA

Solvay SA - Overview
Solvay SA - Business segments
Solvay SA - Key offerings
Solvay SA - Segment focus
SWOT

15.16 Syensqo SA

Syensqo SA - Overview
Syensqo SA - Business segments
Syensqo SA - Key news
Syensqo SA - Key offerings
Syensqo SA - Segment focus
SWOT

15.17 Tosoh Corp.

Tosoh Corp. - Overview
Tosoh Corp. - Business segments
Tosoh Corp. - Key offerings
Tosoh Corp. - Segment focus
SWOT

15.18 Wanhua Chemical Group Co. Ltd.

Wanhua Chemical Group Co. Ltd. - Overview
Wanhua Chemical Group Co. Ltd. - Business segments
Wanhua Chemical Group Co. Ltd. - Key offerings
Wanhua Chemical Group Co. Ltd. - Segment focus
SWOT

16. Appendix

16.1 Scope of the report

Market definition
Objectives
Notes and caveats

16.2 Inclusions and exclusions checklist

Inclusions checklist
Exclusions checklist

16.3 Currency conversion rates for US$

16.4 Research methodology

16.5 Data procurement

Information sources

16.6 Data validation

16.7 Validation techniques employed for market sizing

16.8 Data synthesis

16.9 360 degree market analysis

16.10 List of abbreviations

Research Methodology

Technavio presents a detailed picture of the market by way of study, synthesis, and summation of data from multiple sources. The analysts have presented the various facets of the market with a particular focus on identifying the key industry influencers. The data thus presented is comprehensive, reliable, and the result of extensive research, both primary and secondary.

INFORMATION SOURCES

Primary sources

  • Manufacturers and suppliers
  • Channel partners
  • Industry experts
  • Strategic decision makers

Secondary sources

  • Industry journals and periodicals
  • Government data
  • Financial reports of key industry players
  • Historical data
  • Press releases

DATA ANALYSIS

Data Synthesis

  • Collation of data
  • Estimation of key figures
  • Analysis of derived insights

Data Validation

  • Triangulation with data models
  • Reference against proprietary databases
  • Corroboration with industry experts

REPORT WRITING

Qualitative

  • Market drivers
  • Market challenges
  • Market trends
  • Five forces analysis

Quantitative

  • Market size and forecast
  • Market segmentation
  • Geographical insights
  • Competitive landscape

Interested in this report?

Get your sample now to see our research methodology and insights!

Download Now

Frequently Asked Questions

Amines market growth will increase by USD 2799.5 million during 2026-2030.

The Amines market is expected to grow at a CAGR of 4.6% during 2026-2030.

Amines market is segmented by Product (Ethanolamine, Fatty amines, Specialty amines, Ethyleneamines) Application (Pesticides, Surfactants, Personal care, Lubricants, Others) Product type (Synthetic amines, Bio-based amines)

Alkyl Amines Chemicals Ltd., Amines and Plasticizers ltd., Arkema Group, Balaji Amines Ltd., BASF SE, Croda International Plc, Dow Chemical Co., Eastman Chemical Co., Evonik Industries AG, Huntsman International LLC, Indo Amines Ltd., INEOS Group Holdings S.A., Kao Corp., Nouryon Chemicals Holding B.V., OQ SAOC, Saudi Basic Industries, Solvay SA, Syensqo SA, Tosoh Corp., Wanhua Chemical Group Co. Ltd. are a few of the key vendors in the Amines market.

North America will register the highest growth rate of 31.7% among the other regions. Therefore, the Amines market in North America is expected to garner significant business opportunities for the vendors during the forecast period.

China, India, Japan, South Korea, Indonesia, Australia, US, Canada, Mexico, Germany, UK, France, Italy, Spain, The Netherlands, Saudi Arabia, UAE, Turkey, South Africa, Israel, Brazil, Argentina, Chile

  • Expansive and resilient demand from core end-use industries is the driving factor this market.

The Amines market vendors should focus on grabbing business opportunities from the Product segment as it accounted for the largest market share in the base year.
RIA - Research AI Assistant
Ask RIA
